Abstract
Background
It is challenging for the current Doppler imaging to detect blood flow in small retinal vessels. Power Doppler, with its high sensitivity to detect minimal blood flow, can be used with spectral Doppler to measure blood velocity in small vessels of the eye and orbit.
Methods
Sixteen eyes of twelve normal pigmented rabbits were studied, using a dedicated small animal, high-resolution imaging unit (Vevo 770) and 17.6 MHz ultrasound probe. Spectral Doppler (ISPPA=67.1 W/cm2, ISPTA=483.7 mW/cm2, MI=0.5) was combined with power Doppler (ISPPA=137.7 W/cm2, ISPTA=83.1 mW/cm2, MI=0.77) to measure the blood velocity over each identified vessel, including the central retinal artery and vein, branch retinal artery and vein, choroidal vein, and the long and short posterior ciliary artery. Three readings from each vessel were averaged to reduce measurement error. Three indices were calculated from the arterial blood velocity readings: the resistive index, the pulsatility index and the A/B ratio.
Results
The highest arterial blood velocity was measured over the long posterior ciliary artery; peak systolic velocity was 18.29 cm/s and end diastolic velocity was 16.63 cm/s, while the lowest arterial blood velocity was measured over the branch retinal artery; peak systolic velocity was 5.08 cm/s and end diastolic velocity was 3.25 cm/s. On the other hand, the highest venous blood velocity was measured over the choroidal veins (7.0 cm/s), and the lowest venous blood velocity was measured over the branch retinal vein (2.88 cm/s). No statistically significant difference was observed between the nasal and temporal retinal arterial blood velocity. Combining power Doppler with spectral Doppler imaging caused no damage and is a safe technique to measure blood velocity.
Conclusion
A combination of spectral Doppler and power Doppler ultrasound can be used as a noninvasive and efficient tool for reproducible measurement of the blood velocity in the posterior segment.
Keywords: Ultrasound, Blood velocity, Rabbit eye, Retina, Choroid
Introduction
Evaluation of the ocular circulation and the influences exerted on it by pharmacological and surgical interventions is important in many retinal diseases such as diabetic retinopathy [1–4], age-related macular degeneration [5, 6], glaucomatous optic neuropathy [7–9], and retinal vascular occlusion [10, 11].
Several tools have been found useful for the study of specific components of the ocular circulation: laser Doppler velocimetry [12–14] for the larger vessels of the retinal circulation; single point [15] and scanning [16] laser Doppler flowmetry and laser speckle flowgraphy [17] for the optic nerve head and the choroidal and retinal capillaries, the tonometric pulsatile ocular blood flow technique [18] for the bulk choroidal circulation, and ultrasound-based color Doppler imaging [19] for the central retinal artery (CRA) and vein (CRV), the posterior ciliary arteries, and the ophthalmic artery.
Color Doppler can depict flow within small blood vessels, and spectral Doppler can measure a spectrum of red cell velocities across blood vessels. However, color Doppler has a number of drawbacks, including angle dependency and aliasing, as well as limited resolution due to overwriting beyond the vessel wall, which prevents accurate measurement of the small ocular blood vessel diameter [20].
In an attempt to overcome these shortcomings, power Doppler was developed. Power Doppler is more sensitive to low flow states; it is not angle-dependent; and it is not susceptible to aliasing like color Doppler [21].
In the present study we focus on the clinical usefulness of combining power Doppler and spectral Doppler to increase the sensitivity of the latter to low flow rates. For this purpose, we used the rabbit eye model, which is a commonly used model for many human ocular diseases [22–29]. Moreover, we performed a detailed study of the normal retinal and choroidal blood flow in the rabbit eye, which can be of an experimental importance for researchers.
Material and methods
Animal preparation
Sixteen eyes of 12 normal Dutch pigmented rabbits weighing 2–3 kg were used in this study. All animal experiments adhered to the Principles of Laboratory Animal Care (NIH publication no. 85–23, revised 1985), the OPRR Public Health Service Policy on the Humane Care and Use of Laboratory Animals (revised 1986), the U.S. Animal Welfare Act, as amended, and the Institutional Animal Care and Use Committee of the University of Southern California, as well as the ARVO Statement on the Use of Animals in Ophthalmic and Vision Research.
For all animal procedures, the rabbits were anesthetized with an intramuscular injection of a mixture of ketamine hydrochloride (25 mg/kg) and xylazine hydrochloride (6 mg/kg). Anesthesia was supplemented as needed during the experiment.
Fundus imaging
A digital fundus camera system (FF 450Plus, Carl Zeiss Meditec AG, Jena, Germany) was used for fundus color imaging and fluorescein angiography to document normal retinal vasculature.
Ultrasound imaging
We used a dedicated small-animal high-resolution imaging unit (Vevo 770; Visual Sonics, Toronto, Canada) and an RMV-710B ultrasound probe with the following parameters: transmit frequency, 25 MHz; center frequency, 17.6–22.3 MHz; axial resolution, 70 μm; lateral resolution, 140 μm; focal length, 15 mm; mechanical index, 0.14; transmit power, 50%; dynamic range, 52 dB. The anesthetized animal was placed on its side on a special table. Pre-warmed ultrasound gel (Aquasonic, Parker Laboratories Inc, Fairfield, NJ, USA) was used as a coupling agent on the cornea of the rabbit after instillation of two drops of topical anesthesia (tetracaine ophthalmic drops) and placement of a self-retaining wire eye speculum. The following protocol was followed for ultrasound imaging in all cases with minor modifications as indicated:
1-Probe positioning
The unit was attached to a stereotactic stand that allowed application of the probe at the 6-o’clock position of the globe on the bulbar conjunctival surface, while avoiding untoward pressure on the globe that can give rise to erroneous measurements. The long axis of the probe was adjusted to lie parallel to the limbus, with the marker pointing nasally (instead of toward the temporal sclera as in humans) [30]. This position helped bypass the lens, thereby decreasing attenuation and scatter of the sound beam and improving scan quality.
Traction sutures were placed at the 3- and 9-o’clock positions of the limbus when necessary to change the angle between the globe and probe.
2-B-scan
Two-dimensional B-mode image planes were acquired with optimization of the gain and the time gain compensation settings, which were kept constant throughout the experiment. With this probe position, the optic nerve should be in the center of the screen, with the nasal side to the left and the temporal side to the right of the screen.
3-Power Doppler imaging
The imaging mode was then changed to the power Doppler mode, which helps determine the relative position of each vessel seen. An adequate imaging box size for power Doppler imaging was chosen to include the eye wall and the anterior 2 mm of the retrobulbar optic nerve, including the CRA and CRV.
4-Spectral Doppler imaging
After power Doppler detected flow, the spectral Doppler sampling volume (with 0.1–0.5 mm width) was placed in the center of the imaged vessel, and the imaging mode was changed to the spectral Doppler mode. The Doppler angle of insonation was maintained at less than 60°. Angles greater than this produce large errors in velocity measurements [30–32]. To determine the origin of the Doppler signal, it is necessary to find the characteristic spectral waveform. Three measurements were taken for each vessel imaged, and the results were averaged.
To determine the blood flow in the CRA, the artery was tracked in the anterior 2 mm of the optic nerve head. The blood flow in this artery is distinguished by its moderately high flow rate and the dicrotic notch on the waveform.
As for the short posterior ciliary arteries, power Doppler was not able to reliably resolve individual vessels, so we counted on our knowledge of the retrobulbar vascular anatomy to locate a single artery or cluster of arteries. Because numerous branches of the short posterior ciliary artery were available for assessment, only one branch was chosen for analysis. The two long posterior ciliary arteries were identified nasal and temporal to the optic nerve head with their characteristically high flow rate, and the average of both sides was calculated.
To determine the blood velocity in the CRV, the vein was tracked in the anterior 2 mm segment of the optic nerve head as it runs together with the CRA. The blood flow in this vein is characterized by a moderate degree of pulsatility because of its close course to the CRA.
To determine the blood velocity in the choroidal veins, the cursor placement depth was at a distance 200–400 μm from the surface of the retina. These veins have characteristically the highest venous flow rate among the blood vessels of the posterior segment of the eye.
To determine the blood velocity in the branch retinal vein, these veins were tracked within the inner 200 μm of the retina both nasal and temporal to the optic nerve head. These veins have a characteristically smooth, low flow rate.
While the venous flow has minimal changes throughout the cardiac cycle or is essentially a sinusoidal waveform, arterial flow has a sharp upstroke in systole, with varying degrees of reduced velocity in diastole. For the venous flow, five readings over the longest possible frame were averaged, where the mean velocity (Vmean) seems more appropriate for the more uniform venous waveforms. For the pulsatile waveform of the arterial flow, we measured the end diastolic velocity (EDV) and the peak systolic velocity (PSV). Whenever possible, the nasal and temporal measurements were recorded separately.
We used these two values to calculate three indices: the pulsatility index (PI), the resistance index (RI), and the A/B ratio.
| Equation 1 |
where Vm is the mean velocity.
| Equation 2 |
| Equation 3 |
Statistical analysis
Statistical analysis was performed with the SPSS 17.0 statistical package (SPSS Inc, Chicago, IL, USA). For each eye in the present study, the mean velocity in the selected veins and the PSV and EDV of the selected arteries were measured three times in succession. Results are given as the mean ± 1SD. Calculations of the intraclass correlation coefficient were used to determine the reproducibility of the measurements. An intraclass correlation value of ≥0.75 is considered a strong correlation, while values of ≤0.2 are considered poorly correlated.
Moreover, the nasal and temporal retinal circulations were compared using the Vmean of the branch retinal vein and the PSV and EDV of the branch retinal artery. Independent Student’s t-tests were performed to compare the means, and a P-value of <0.05 was considered statistically significant.
Safety studies
To assess any potential safety issues with this Doppler imaging, five randomly selected rabbits from the studied group were euthanized 1 week after the procedure by intracardiac injection of pentobarbital (Beuthanasia-D; Schering Plough Animal Health, Omaha, NE, USA). Eyes were enucleated and immersed in Davidson’s fixative solution overnight, then dehydrated in a series of graded alcohol solutions over the next 24 to 48 h before they were embedded in paraffin. Blocks were obtained from cuts through the whole globe, oriented perpendicular to the medullary wings. Sections of 5 μm thickness obtained by a microtome were stained with hematoxylin and eosin stains, and examined by light microscopy.
Results
Venous flow
Vmean was calculated as described, and the highest mean venous blood velocity was recorded, first over the choroidal veins then over the CRV then the branch retinal vein. The results showed low variability between the studied rabbits in these three veins (Figs. 1, 2).
Fig. 1.
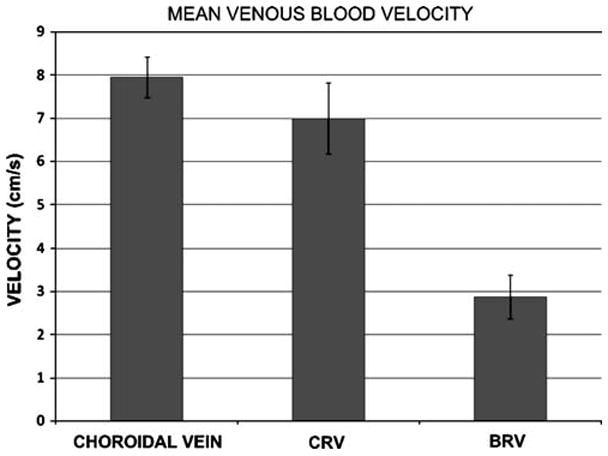
Graph shows the mean blood velocity in choroidal veins, CRV, and branch retinal vein (BRV). Error bars represent ± 1SD
Fig. 2.
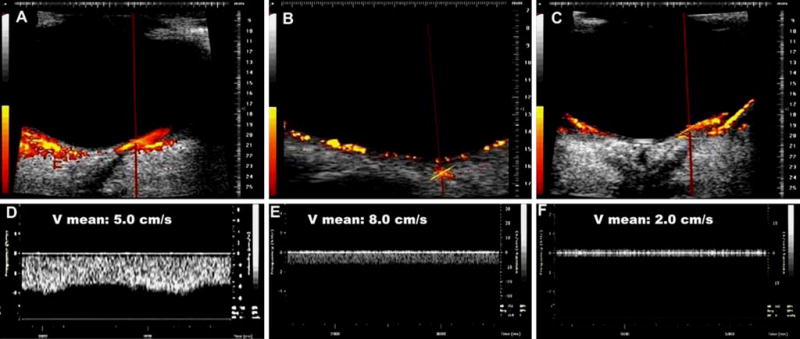
Combined power Doppler and spectral Doppler imaging of the choroidal vein (a, d), CRV (b, e), and branch retinal vein (c, f). Blood velocity in these veins is represented by the mean velocity (Vmean). Note the pulsatile waveform of the choroidal vein
Arterial flow
Comparison of the measured arteries showed the highest PSV and EDV in the long posterior ciliary artery, followed by the short posterior ciliary artery, then the CRA, and the branch retinal artery (Table 1, Fig. 3). The highest variability between the studied rabbits is observed in the short posterior ciliary artery, while the lowest variability was observed with the branch retinal artery. The branch retinal artery showed the highest RI and the lowest PI, while the long posterior ciliary artery showed the lowest RI and the highest PI.
Table 1.
Blood velocity and vascular indices in the short posterior ciliary artery, long posterior ciliary artery, central retinal artery, and branch retinal artery
| SPCA | LPCA | CRA | BRA | |
|---|---|---|---|---|
| PSV (cm/s) | 17.42 (1.7) | 18.29 (0.4) | 12.5 (1.12) | 5.08 (0.6) |
| EDV (cm/s) | 12.17 (1.52) | 16.63 (0.91) | 10.25 (1.16) | 3.25 (0.58) |
| A/B RATIO | 1.44 (0.09) | 1.1 (0.06) | 1.22 (0.06) | 1.62 (0.38) |
| RI | 0.3 (0.04) | 0.09 (0.05) | 0.18 (0.04) | 0.35 (0.13) |
| PI | 1.84 (0.26) | 2.5 (1.25) | 0.79 (0.16) | 0.68 (0.3) |
SPCA: short posterior ciliary artery; LPCA: long posterior ciliary artery; BRA: branch retinal artery; PSV: peak systolic velocity; EDV: end diastolic velocity; RI: resistance index; PI: pulsatility index
Fig. 3.
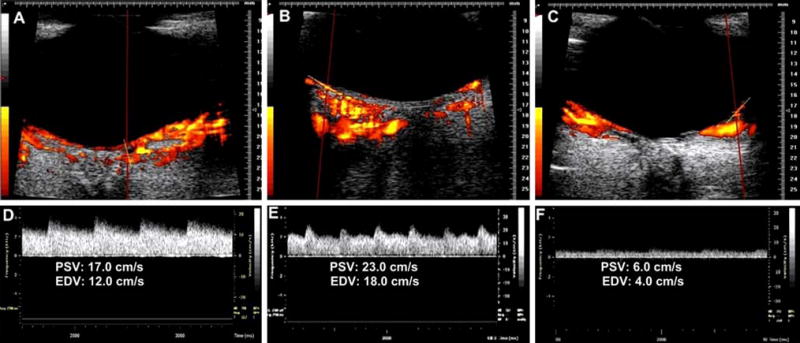
Combined power Doppler and spectral Doppler imaging of a long posterior ciliary artery (a, d), CRA (b, e), and the branch retinal artery (c, f). Blood velocity in the artery is represented by peak systolic velocity (PSV) and end diastolic velocity (EDV)
Comparison of the nasal and temporal sides of the retinal circulation revealed higher branch vein flow velocity on the temporal side than on the nasal side, with a statistically significant difference, (P-value 0.03). On the other hand, neither the PSV nor the EDV of the branch retinal artery showed any significant difference between the nasal and temporal sides (P-value 0.67 for the PSV and P-value 0.18 for the EDV) (Fig. 4).
Fig. 4.
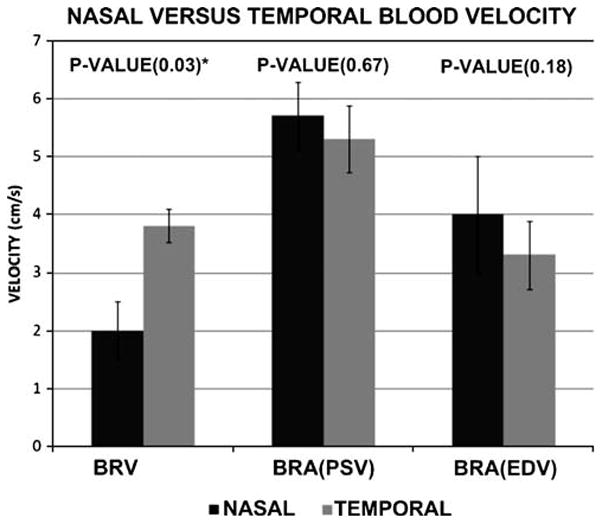
Graph shows the comparison between the nasal and temporal sides of the branch retinal vein (BRV) and branch retinal artery (BRA) end diastolic velocity (EDV) and peak systolic velocity (PSV). Results represent the mean blood velocity and error bars represent ± 1SD. * indicates statistical significance
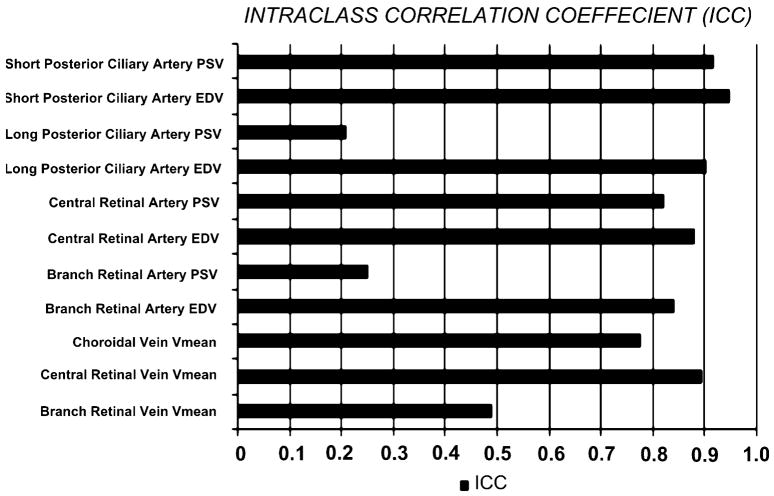
Results of reproducibility, as represented by the intraclass correlation, showed the highest correlation with the PSV and EDV of the short posterior ciliary artery and the lowest correlation with the PSV of the long posterior ciliary artery and branch retinal artery (Fig. 5). The intraclass correlation for the branch retinal vein is medium (0.5).
Fig. 5.
Graph shows the intraclass correlation (ICC) of the blood velocity of the different vessels
Histopathologic examination
Detailed examination of the retinal layers in different regions showed no abnormality that can be attributed to ultrasound-induced cell damage, such as cell necrosis, vaccuolation, nerve fiber layer changes, or retinal pigment epithelium degenerative changes (Fig. 6). Neither the retinal regions that were away from the ultrasound beam (i.e. peripheral and midperipheral retina) nor the central retina showed toxic changes.
Fig. 6.
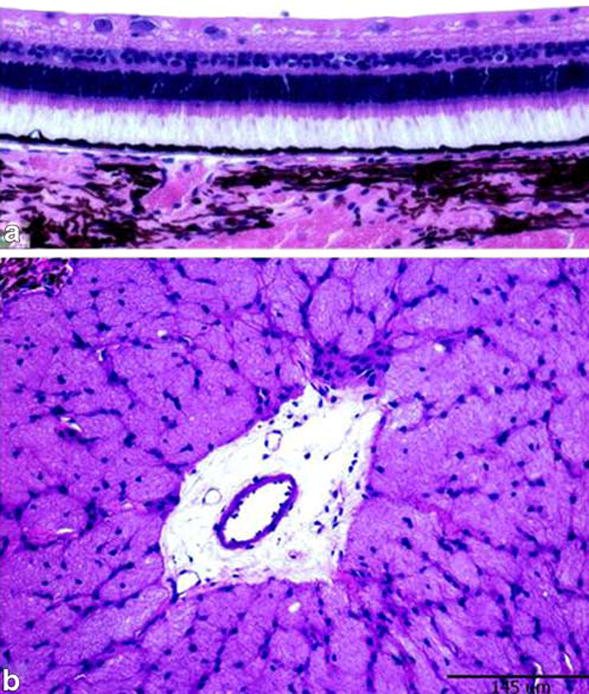
Hematoxylin and eosin stained slides showing normal retinal architecture in the paracentral retina (a) and normal optic nerve cut section (b) in one eye included in the Doppler study. Calibration bar measures 145 μm
Discussion
To our knowledge, there have been few previous reports of using Doppler ultrasound to measure blood velocity in the retinal vessels because of the small diameters and low flow rates of these vessels.
In a study performed in rabbits using 12-MHz linear ultrasound transducer with a 16-mm focal length, researchers were able to examine the ophthalmic artery [33]. However, due to the lower frequency of the system they used, they could not resolve the smaller retinal vessels. Our system with the 17.5-MHz linear ultrasound transducer with a 15-mm focal length was unable to detect this artery in any animal. This inability to detect the artery may be due to the lower penetration of the ultrasound beam with our system.
The high resolution provided by our machine (axial resolution, 70μm; lateral resolution, 140μm) allowed us to image both the retinal arteries and veins (the branch and central vessels) in the majority of our animals. The only exception was the CRV, which was detected in only 80% of our animals (apparently because of the anatomical variation in this vessel with regard to the course, angle of entry into the back of the globe, and site of bifurcation).
Overall, the reproducibility for all of these vessels, as measured by intraclass correlation, ranged between 0.25 for the PSV of the branch retinal artery and 0.89 for the Vmean of the CRV. The low reliability for the PSV of the branch retinal artery may be due to the low pulsatility of the branch retinal artery, with common errors during manual calculation of its value. Our measurements in CRA are comparable to baseline findings in an experimental study conducted on rabbits, using Doppler ultrasound [34]; the measured PI in that study was 0.8 versus our measured PI of 0.79. Interestingly, we detected no significant difference between the nasal and temporal sides of the retinal circulation (other than a trend toward a higher flow rate in the temporal branch retinal vein compared to the nasal side). Studies of the regional retinal blood flow in humans [35–38] showed that the temporal retinal blood flow rate is higher than the nasal side; the higher flow rate can be attributed to the high metabolic activity at the macular region and the corresponding thicker ganglion cell layer on the temporal side [35]. We hypothesize that the lack of difference in the blood flow velocity in rabbits shown in our results may relate to the absence of a true macula in the rabbit, which has essentially no central vision and a symmetrical ganglion cell layer thickness on either side.
We explored the advantage of power Doppler to guide the identification of ocular and retrobulbar vessels. Power Doppler is a display format that is alternative to the conventional color Doppler imaging. Power Doppler sacrifices velocity and directional information, displaying only a color brightness linked to the total sum of power in the Doppler spectrum. Many drawbacks observed with the conventional color Doppler are eliminated in power Doppler. In contrast to the frequency-shift color Doppler, which indicates blood flow velocity and direction, power Doppler visualizes the concentration of moving blood scatterers. It is more sensitive than color Doppler, relatively angle independent, free of aliasing, more accurate in depicting luminal edges, and better at visualizing the continuity of flow [39].
One study in the human eye has used a combination of color Doppler and spectral Doppler to measure blood velocity in the ocular and retrobulbar vessels [40]. However, to our knowledge, no previous reports of combining power Doppler with spectral Doppler to detect these vessels have been published. The present study addressed the advantages of using the high sensitivity of power Doppler to detect low flow rates and to image small vessels. One potential disadvantage of power Doppler is its sensitivity to tissue motion artifacts [41]. This possibility is partially eliminated by the stable position of the scan head probe on its stand and manipulator, and by the automatic synchronization of the Doppler imaging with the respiratory cycle of the examined animal. We further evaluated the feasibility of using spectral Doppler guided with power Doppler to measure blood velocity in the ocular and retro-ocular vessels. We found that the arterial and venous choroidal circulation have the highest blood flow velocity.
For the long posterior ciliary artery, this blood velocity was statistically significantly higher than that of the short posterior ciliary artery, branch retinal artery, and CRA; and the long posterior ciliary artery had the lowest RI (0.09±0.05) and highest PI (2.25±1.25) compared with the other measured vessels. This high blood flow rate was attributed to the choriocapillaris layer, with its relatively large diameter (10 μm), that provides high flow/low resistance channels [42, 43]. This seems to be beneficial for the high metabolic demands of the photoreceptor layer [44–46]. This high blood flow was documented in previous studies using methods other than Doppler US [47]. This is especially important in the rabbit eye because the rabbit retina is avascular except for the central horizontal streak; and its main nourishment comes from the choroid. Because of its extremely low resistance, choroidal circulation has been assumed to be a form of autoregulation [48–50].
In the present study, we were able to image the short posterior ciliary artery 100% of the time in the deep ventromedial and ventrolateral orbit. Our results show that the short posterior ciliary artery has a lower velocity than the choroidal arterial system, with a mean PSV of 17.42±1.7 cm/s, EDV of 12.17±1.52 cm/s and RI 0.3± 0.04. Reproducibility of these measurements was the highest among the imaged vessels in this study. In a rabbit study done by Bayón et al. [51], Doppler ultrasound measurements of short posterior ciliary artery blood velocity were reported as PSV, 17.3±4 cm/s; EDV 11.43±2.91 cm/s; RI 0.34±0.07. Their calculation of the PI was 0.43±0.11, which is much lower than our calculation (1.84±0.26).
Finally, our histopathologic analysis of the examined eyes revealed no evidence of gross toxicity. However, a larger study of the retinal electrophysiological changes and more detailed histopathologic evaluation may be needed to exclude the possibility of a mild toxicity.
Limitations of our study include the small sample size and the artifacts encountered during Doppler US imaging. Artifacts included the false detection of flow in unusual locations caused by rapid movement of the rabbit head with fast breathing, and a false absence of flow on one retinal side caused by improper probe positioning. False positive flow in power Doppler was overcome by giving a supplementary dose of ketamine and xylazine to deepen the anesthesia, while false negative flow was overcome by proper alignment of the probe. There was also a possibility that undue pressure on the globe could affect our measurements of blood velocity. However, the use of a stand with a manipulator that fixes the relative position of the scan head eliminated this possibility.
Conclusion
The present study documents the feasibility of imaging and measuring the blood velocity of small ocular and retrobulbar blood vessels using a combination of power Doppler and spectral Doppler imaging. This technique can provide reproducible measurements, and is a potentially safe technique. Further studies of potential bioeffects are needed before validation of the safety of this approach for the evaluation of various retinal vascular disorders affecting the human eye.
Acknowledgments
Supported in part by NEI core grant EY03040. The authors have full control of all primary data, and agree to allow Graefe’s Archive for Clinical and Experimental Ophthalmology to review their data upon request.
Contributor Information
Walid Abdallah, Doheny Retina Institute, Doheny Eye Institute, 1450 San Pablo Street, Los Angeles, CA 90033, USA.
Amani Fawzi, Doheny Retina Institute, Doheny Eye Institute, 1450 San Pablo Street, Los Angeles, CA 90033, USA, Department of Ophthalmology, Keck School of Medicine of the University of Southern California, Los Angeles, CA 90033, USA.
Hitenkumar Patel, USC Molecular Imaging Center, Keck School of Medicine of the University of Southern California, Los Angeles, CA 90033, USA.
Grant Dagliyan, USC Molecular Imaging Center, Keck School of Medicine of the University of Southern California, Los Angeles, CA 90033, USA.
Naoki Matsuoka, Doheny Retina Institute, Doheny Eye Institute, 1450 San Pablo Street, Los Angeles, CA 90033, USA.
Edward Grant, Department of Radiology, Keck School of Medicine of the University of Southern California, Los Angeles, CA 90033, USA.
Mark Humayun, Email: Humayun@usc.edu, Doheny Retina Institute, Doheny Eye Institute, 1450 San Pablo Street, Los Angeles, CA 90033, USA, Department of Ophthalmology, Keck School of Medicine of the University of Southern California, Los Angeles, CA 90033, USA, Department of Biomedical Engineering, Viterbi School of Engineering of the University of Southern California, Los Angeles, CA 90089, USA, Biomedical Engineering, Cell Neurobiology, Associate Director of Research, Doheny Eye Institute, 1355 San Pablo Street, Los Angeles, CA 90033, USA.
References
- 1.Gracner T. Ocular blood flow velocity determined by color Doppler imaging in diabetic retinopathy. Ophthalmologica. 2004;218:237–242. doi: 10.1159/000078613. [DOI] [PubMed] [Google Scholar]
- 2.Bursell SE, Clermont AC, Kinsley BT, Simonson DC, Aiello LM, Wolpert HA. Retinal blood flow changes in patients with insulin-dependent diabetes mellitus and no diabetic retinopathy. Invest Ophthalmol Vis Sci. 1996;37:886–897. [PubMed] [Google Scholar]
- 3.Cunha-Vaz JG, Fonseca JR, de Abreu JR, Lima JJ. Studies on retinal blood flow. II. Diabetic retinopathy. Arch Ophthalmol. 1978;96:809–811. doi: 10.1001/archopht.1978.03910050415001. [DOI] [PubMed] [Google Scholar]
- 4.Lorenzi M, Feke GT, Cagliero E, Pitler L, Schaumberg DA, Berisha F, Nathan DM, McMeel JW. Retinal haemodynamics in individuals with well-controlled type 1 diabetes. Diabetologia. 2008;51:361–364. doi: 10.1007/s00125-007-0872-0. [DOI] [PMC free article] [PubMed] [Google Scholar]
- 5.Friedman E, Krupsky S, Lane AM, Oak SS, Friedman ES, Egan K, Gragoudas ES. Ocular blood flow velocity in age-related macular degeneration. Ophthalmology. 1995;102:640–646. doi: 10.1016/s0161-6420(95)30974-8. [DOI] [PubMed] [Google Scholar]
- 6.Ciulla TA, Harris A, Chung HS, Danis RP, Kagemann L, McNulty L, Pratt LM, Martin BJ. Color Doppler imaging discloses reduced ocular blood flow velocities in nonexudative age-related macular degeneration. Am J Ophthalmol. 1999;128:75–80. doi: 10.1016/s0002-9394(99)00061-6. [DOI] [PubMed] [Google Scholar]
- 7.Butt Z, O’Brien C, McKillop G, Aspinall P, Allan P. Color Doppler imaging in untreated high- and normal-pressure open-angle glaucoma. Invest Ophthalmol Vis Sci. 1997;38:690–696. [PubMed] [Google Scholar]
- 8.Butt Z, McKillop G, O’Brien C, Allan P, Aspinall P. Measurement of ocular blood flow velocity using colour Doppler imaging in low tension glaucoma. Eye. 1995;9:29–33. doi: 10.1038/eye.1995.4. [DOI] [PubMed] [Google Scholar]
- 9.Akarsu C, Bilgili MY. Color Doppler imaging in ocular hypertension and open-angle glaucoma. Graefes Arch Clin Exp Ophthalmol. 2004;242:125–129. doi: 10.1007/s00417-003-0809-3. [DOI] [PubMed] [Google Scholar]
- 10.Williamson TH, Baxter GM. Central retinal vein occlusion, an investigation by color Doppler imaging. Blood velocity characteristics and prediction of iris neovascularization. Ophthalmology. 1994;101:1362–1372. doi: 10.1016/s0161-6420(94)31173-0. [DOI] [PubMed] [Google Scholar]
- 11.Chen HC, Gupta A, Wiek J, Kohner EM. Retinal blood flow in nonischemic central retinal vein occlusion. Ophthalmology. 1998;105:772–775. doi: 10.1016/S0161-6420(98)95013-8. [DOI] [PubMed] [Google Scholar]
- 12.Konno S, Feke GT, Yoshida A, Fujio N, Goger DG, Buzney SM. Retinal blood flow changes in type I diabetes. A long-term follow-up study. Invest Ophthalmol Vis Sci. 1996;37:1140–1148. [PubMed] [Google Scholar]
- 13.Ogasawara H, Feke GT, Yoshida A, Milbocker MT, Weiter JJ, McMeel JW. Retinal blood flow alterations associated with scleral buckling and encircling procedures. Br J Ophthalmol. 1992;76:275–279. doi: 10.1136/bjo.76.5.275. [DOI] [PMC free article] [PubMed] [Google Scholar]
- 14.Fujio N, Feke GT, Ogasawara H, Goger DG, Yoshida A, McMeel JW. Quantitative circulatory measurements in branch retinal vessel occlusion. Eye. 1994;8:324–328. doi: 10.1038/eye.1994.66. [DOI] [PubMed] [Google Scholar]
- 15.Joos KM, Pillunat LE, Knighton RW, Anderson DR, Feuer WJ. Reproducibility of laser Doppler flowmetry in the human optic nerve head. J Glaucoma. 1997;6:212–216. [PubMed] [Google Scholar]
- 16.Nicolela MT, Hnik P, Schulzer M, Drance SM. Reproducibility of retinal and optic nerve head blood flow measurements with scanning laser Doppler flowmetry. J Glaucoma. 1997;6:157–164. [PubMed] [Google Scholar]
- 17.Tamaki Y, Araie M, Tomita K, Nagahara M, Tomidokoro A, Fujii H. Real-time measurement of human optic nerve head and choroid circulation, using the laser speckle phenomenon. Jpn J Ophthalmol. 1997;41:49–54. doi: 10.1016/s0021-5155(96)00008-1. [DOI] [PubMed] [Google Scholar]
- 18.Mori F, Konno S, Hikichi T, Yamaguchi Y, Ishiko S, Yoshida A. Pulsatile ocular blood flow study: decreases in exudative age related macular degeneration. Br J Ophthalmol. 2001;85:531–533. doi: 10.1136/bjo.85.5.531. [DOI] [PMC free article] [PubMed] [Google Scholar]
- 19.Dimitrova G, Tamaki Y, Kato S. Retrobulbar circulation in patients with age-related maculopathy. Eye. 2002;16:580–586. doi: 10.1038/sj.eye.6700161. [DOI] [PubMed] [Google Scholar]
- 20.Williamson TH, Harris A. Ocular blood flow measurement. Br J Ophthalmol. 1994;78:939–945. doi: 10.1136/bjo.78.12.939. [DOI] [PMC free article] [PubMed] [Google Scholar]
- 21.Jain SP, Fan PH, Philpot EF, Nanda NC, Aggarwal KK, Moos S, Yoganathan AP. Influence of various instrument settings on the flow information derived from the power mode. Ultrasound Med Biol. 1991;17:49–54. doi: 10.1016/0301-5629(91)90008-k. [DOI] [PubMed] [Google Scholar]
- 22.Higa A, Nakanishi-Ueda T, Arai Y, Tsuchiya T, Ueda T, Fukuda S, Watanabe K, Kan K, Yasuhara H, Koide R, Armstrong D. Lipid hydroperoxide induced corneal neovascularization in hyperglycemic rabbits. Curr Eye Res. 2002;25:49–53. doi: 10.1076/ceyr.25.1.49.9958. [DOI] [PubMed] [Google Scholar]
- 23.Julien S, Kreppel F, Beck S, Heiduschka P, Brito V, Schnichels S, Kochanek S, Schraermeyer U. A reproducible and quantifiable model of choroidal neovascularization induced by VEGF A165 after subretinal adenoviral gene transfer in the rabbit. Mol Vis. 2008;14:1358–1372. [PMC free article] [PubMed] [Google Scholar]
- 24.Kimura H, Sakamoto T, Hinton DR, Spee C, Ogura Y, Tabata Y, Ikada Y, Ryan SJ. A new model of subretinal neovascularization in the rabbit. Invest Ophthalmol Vis Sci. 1995;36:2110–2119. [PubMed] [Google Scholar]
- 25.Ogura H, Nakanishi-Ueda T, Ueda T, Iwai S, Uchida S, Saito Y, Taguchi Y, Yasuhara H, Armstrong D, Oguchi K, Koide R. Effect of a dihydrobenzofuran derivative on lipid hydroperoxide-induced rabbit corneal neovascularization. J Pharmacol Sci. 2007;103:234–240. doi: 10.1254/jphs.fp0061301. [DOI] [PubMed] [Google Scholar]
- 26.Ueda T, Fukuda S, Browne R, Jenis E, Spengler R, Chou R, Buch P, Aljada A, Dandona P, Sasisekharan R, Dorey CK, Armstrong D. Lipid hydroperoxide-induced tumor necrosis factor (TNF)-alpha, vascular endothelial growth factor and neovascularization in the rabbit cornea: effect of TNF inhibition. Angiogenesis. 1998;1:174–184. doi: 10.1023/A:1018377621102. [DOI] [PubMed] [Google Scholar]
- 27.Qiu G, Stewart JM, Sadda S, Freda R, Lee S, Guven D, De Juan E, Jr, Varner SE. A new model of experimental subretinal neovascularization in the rabbit. Exp Eye Res. 2006;83:141–152. doi: 10.1016/j.exer.2005.11.014. [DOI] [PubMed] [Google Scholar]
- 28.Framme C, Sachs HG, Kobuch K, Flucke B, Birngruber R. Clinical evaluation of experimentally induced choroidal neovascularizations in pigmented rabbits by subretinal injection of lipid hydroperoxide and consecutive preliminary photodynamic treatment with Tookad. Ophthalmologica. 2008;222:254–264. doi: 10.1159/000136903. [DOI] [PubMed] [Google Scholar]
- 29.Robinson MR, Baffi J, Yuan P, Sung C, Byrnes G, Cox TA, Csaky KG. Safety and pharmacokinetics of intravitreal 2-methoxyestradiol implants in normal rabbit and pharmacodynamics in a rat model of choroidal neovascularization. Exp Eye Res. 2002;74:309–317. doi: 10.1006/exer.2001.1132. [DOI] [PubMed] [Google Scholar]
- 30.Byrne SF, Green RL. Ultrasound of the eye and orbit. 2. Mosby Year Book; St. Louis: 2002. [Google Scholar]
- 31.Liu JH, Li R, Nelson TR, Weinreb RN. Sympathetic activities influence blood-flow velocity and resistance in the rabbit ophthalmic artery. J Ocul Pharmacol Ther. 2007;23:110–115. doi: 10.1089/jop.2006.0099. [DOI] [PubMed] [Google Scholar]
- 32.Taylor KJW, Burns PN, Wells PNT. Clinical applications of Doppler ultrasound. 2. Raven Press; New York: 1995. [Google Scholar]
- 33.Liu JH, Li R, Nelson TR, Weinreb RN. Resistance to blood flow in the rabbit ophthalmic artery after topical treatment with timolol. J Ocul Pharmacol Ther. 2007;23:103–109. doi: 10.1089/jop.2006.0098. [DOI] [PubMed] [Google Scholar]
- 34.Yamada R, Hayashi Y, Ueno S, Yamada S. Blood flow velocity in the central retinal artery of exotoxin-induced uveitis in rabbits. Nippon Ganka Gakkai Zasshi. 1999;103:591–596. [PubMed] [Google Scholar]
- 35.Hill DW. Measurement of retinal blood flow. Trans Ophthalmol Soc UK. 1976;96:199–201. [PubMed] [Google Scholar]
- 36.Rassam SMB, Patel V, Chen C, Kohner EM. Regional retinal blood flow and vascular autoregulation. Eye. 1996;10:331–337. doi: 10.1038/eye.1996.69. [DOI] [PubMed] [Google Scholar]
- 37.Riva CE, Grunwald JE, Sinclair SH, Petrig BL. Blood velocity and volumetric flow rate in human retinal vessels. Invest Ophthalmol Vis Sci. 1985;26:1124–1132. [PubMed] [Google Scholar]
- 38.Feke GT, Tagawa H, Deupree DM, Goger DG, Sebag J, Weiter JJ. Blood flow in the normal human retina. Invest Ophthalmol Vis Sci. 1989;30:58–65. [PubMed] [Google Scholar]
- 39.Lin GS, Milburn DT, Briggs S. Power Doppler: how it works, its clinical benefits, and recent technologic advances. J Diagn Med Sonogr. 1998;14:151–161. [Google Scholar]
- 40.Mendivil A, Cuartero V, Mendivil MP. Color Doppler imaging of the ocular vessels. Graefes Arch Clin Exp Ophthalmol. 1995;233:135–139. doi: 10.1007/BF00166605. [DOI] [PubMed] [Google Scholar]
- 41.Silverman RH, Kruse DE, Coleman DJ, Ferrara KW. High-resolution ultrasonic imaging of blood flow in the anterior segment of the eye. Invest Ophthalmol Vis Sci. 1999;40:1373–1381. [PubMed] [Google Scholar]
- 42.Bill A. Some aspects of the ocular circulation. Friedenwald lecture. Invest Ophthalmol Vis Sci. 1985;26:410–424. [PubMed] [Google Scholar]
- 43.Wise GN, Dollery CT, Henkind P. The retinal circulation. Harper and Row; Evanston: 1971. [Google Scholar]
- 44.Parver LM, Auker C, Carpenter DO. Choroidal blood flow as a heat dissipating mechanism in the macula. Am J Ophthalmol. 1980;89:641–646. doi: 10.1016/0002-9394(80)90280-9. [DOI] [PubMed] [Google Scholar]
- 45.Keough EM, Wilcox LM, Jr, Connolly RJ, Hotte CE. Comparative ocular blood flow. Comp Biochem Physiol. 1981;68A:269–271. [Google Scholar]
- 46.Linsenmeier RA, Padnick-Silver L. Metabolic dependence of photoreceptors on the choroid in the normal and detached retina. Invest Ophthalmol Vis Sci. 2000;41:3117–3123. [PubMed] [Google Scholar]
- 47.Tomita K, Araie M, Tamaki Y, Nagahara M, Sugiyama T. Effects of nilvadipine, a calcium antagonist, on rabbit ocular circulation and optic nerve head circulation in NTG subjects. Invest Ophthalmol Vis Sci. 1999;40:1144–1151. [PubMed] [Google Scholar]
- 48.Kiel JW, van Heuven WA. Ocular perfusion pressure and choroidal blood flow in the rabbit. Invest Ophthalmol Vis Sci. 1995;36:579–585. [PubMed] [Google Scholar]
- 49.Kiel JW, Shepherd AP. Autoregulation of choroidal blood flow in the rabbit. Invest Ophthalmol Vis Sci. 1992;33:2399–2410. [PubMed] [Google Scholar]
- 50.Riva CE, Titze P, Hero M, Petrig BL. Effect of acute decreases of perfusion pressure on choroidal blood flow in humans. Invest Ophthalmol Vis Sci. 1997;38:1752–1760. [PubMed] [Google Scholar]
- 51.Bayon A, Jara J, Albert A, Fernandez Del Palacio MJ. Two-dimensional and duplex Doppler ultrasonography of the eye in normal rabbits. 27 WSAVA Congress, 8 FECAVA Congress, 37 National Congress of AVEPA; October, 2002; Granada, Spain. 2002. [Google Scholar]


