

Abstract
The purpose of this research was to determine whether a decreased hamstring activation rate among the elderly is responsible for a higher horizontal heel contact velocity and increased likelihood of slip-induced falls compared to their younger counterparts. Twenty-eight subjects from two age groups (14 young and 14 old) walked across a linear walking track with embedded force platforms while wearing a fall arresting harness attached to an overhead arresting rig for safety. In order to obtain realistic unexpected slip-induced fall data, a soapy vinyl floor surface was hidden from the subjects and unexpectedly introduced. Synchronized kinematics, kinetic and electromyography (EMG) analyses during the heel contact phase of the gait cycle while walking over slippery and non-slippery floor surfaces were examined in the study. Normalized EMG data were examined in terms of hamstring activation rate and evaluated with heel contact velocity and friction demand characteristic (as measured by peak required coefficient of friction (RCOF)) on the dry vinyl floor surface. Furthermore, slip parameters (i.e. slip distances and slipping velocity) were assessed on the soapy vinyl floor surface. The results indicated that younger adults’ hamstring activation rate was higher than older adults, whereas younger adults’ heel contact velocity was not different from older adults. These results suggested that heel contact velocity in younger adults was sufficiently reduced before the heel contact phase of the gait cycle. This could be due to the outcome of higher hamstring activation rate in younger adults in comparison to older adults. However, lower friction demand (peak RCOF), shorter slip distances, slower peak sliding heel velocity and more falls among older adults suggested that the slip initiation characteristics were not the only factors contributing to slip-induced falls among the elderly.
Keywords: Slips, Falls, Hamstring activation rate, Heel velocity, RCOF, Age
1. Introduction
Slip-induced fall accidents are among the most common and serious problems facing older adults. Often, falls in the elderly population involve environmental hazards associated with slippery floor surfaces [1,2], and both the incidence of falls and the severity of fall-related complications rise steadily after about age 60. In the age 65-and-over population, approximately 35–40% of community dwelling, generally healthy elderly persons fall annually. After age 75, the rates are higher [3]. The National Safety Council [4] reported that in 2001, the number of deaths caused or led by falls was 15,400 in US and majority (over 80%) were over 65 years of age. Additionally, falls and hip fractures among older individuals rank as one of the most serious public health problems in the US, with costs expected to exceed US$ 32 billion by the year 2040 [5].
Major physiological changes affecting the potential for slip-induced fall accidents begin to appear in the mid-20’s. In general, isometric muscle strength peaks in the mid-20’s and then decreases slowly until after 50 years of age when there is an accelerated decline [6]. These declines in strength development appear to stem from a proportional shift in muscle fiber types while aging (i.e. more reduction in fast-twitch muscle fibers than in slow-twitch muscle fibers [7–11]). Additionally, fast-twitch muscle fibers produce a given tension at a faster rate than slow-twitch muscle fibers, as a result, many studies suggest that age-related changes in muscle activation rate may have an important implication on initiation and recovery of slip and fall accidents [12–15].
Initiation of a slip occurs whenever the frictional force (Fμ) opposing the movement of the foot is less than the horizontal shear force (Fh) at the foot during the heel contact phase of the gait cycle [16,17]. Specifically, at the time of the heel contact, there is a forward thrust component of force on the swing foot against the floor. This results in a forward horizontal shear force (Fh) of the ground against the heel. Additionally, a vertical force (Fv) occurs as the body weight and the downward momentum of the swing foot (and leg) make contact against the ground. Perkins and Wilson [17] identified six peak forces in a normal gait cycle by measuring ground reaction forces exerted between the shoe and ground. The ratio of horizontal to vertical foot forces (Fh/Fv) was also calculated. Analyzing the ratio, Perkins noted that a dangerous forward slip was most likely to occur shortly after (<70–120 ms) the heel contact phase of the gait cycle. This ratio (Fh/Fv at peak 3) was called “required coefficient of friction” (RCOF) [17] because it represented the general friction demand (i.e. minimum coefficient of friction that must be available or “required”) at the shoe–floor interface to prevent initiation of forward slipping. In terms of slip-induced fall accidents, previous literature suggest that as the differences between the friction demand characteristic (i.e. RCOF) of an individual and available dynamic coefficient of friction (COF) of the walking surface increase, the number of slip-induced fall events increased [16,17]. In other words, most slips that lead to falls occur when the friction force opposing the movement of the foot is less than the shear force of the foot immediately after the heel contact phase of the gait cycle [16,17]. Given the constant contact time and mass associated with heel contact phase of the gait cycle [18], the impulse–momentum relationship indicates that horizontal shear force increases proportionally as horizontal heel contact velocity increases. Furthermore, as indicated by many studies, gait characteristics such as heel contact velocity and walking velocity influence the friction demand characteristics due to the alterations of the shear force of the contacting foot [14,25,26]. Most common gait changes in older adults, in comparison to younger adults, are slower walking velocity, shorter step length and longer double support time [19–22]. However, in spite of slower walking velocity, shorter step length and a longer double support time, horizontal heel contact velocity among older adults was found to be faster in comparison to younger adults [10,14,23]. Furthermore, an implication of the higher potential risk of slip-induced falls among older adults was presumed upon the results of the faster heel contact velocity found among older adults [10,14,24]. Additionally, hamstring muscle activation rate was suggested to be a factor contributing to higher heel contact velocity [14]. The primary objective of this study was to describe the relationships between hamstring activation rate and heel contact parameters to observe if hamstring activation rate could be one factor contributing to changes in gait and ultimately slip-induced fall accidents among the elderly. It was hypothesized that older adults’ heel contact velocity would be faster than their younger counterparts due to slower hamstring activation rate, and increases in heel contact velocity would increase friction demand characteristic (as measured by RCOF) at the shoe–floor interface, and ultimately increase the likelihood of slip-induced falls.
2. Method
2.1. Subjects
Fourteen healthy young individuals (7 male and 7 female; mean ± S.D. = 23.21 ± 4.41 years) and 14 healthy older individuals (7 male and 7 female; mean ± S.D. = 72.64 ± 4.36 years) participated in this experiment. The young adults were recruited from general student population at Virginia Tech and older adults were recruited from the local community. Each participant completed an inform consent form approved by the Virginia Tech Internal Review Board (IRB). A questionnaire was used as an initial screening tool. Participants were excluded from the study if they indicated any physical problems (i.e. hip, knee and ankle problems) or had a least one previous fall within 6 months.
2.2. Apparatus
One commonly used floor material (vinyl tile, Armstrong) was used in this experiment to represent a realistic environmental setting. The entire walking track was covered with vinyl tile, and the dynamic coefficient of friction (DCOF) of the dry vinyl floor surface was 1.80. For slippery conditions, the vinyl tile surface was covered with a soap and water mixture (2:3) to reduce COF of the floor surface. DCOF of the soapy vinyl floor surface was 0.07. The DCOF for each surface was measured using a standard 4.54 kg (10 lb) horizontal pull slip-meter with a rubber sole material (same sole material as the standard shoes provided to the subjects) on the force plates [26]. Walking trials were conducted on a linear walking track (1.5 m × 5.5 m) embedded with two force plates (BERTEC #K80102, Type 45550-08, Bertec Corporation, OH 43212, USA). The test surface was mounted on a moveable platform and connected to force plates. The overall function of the system was to control the experimental conditions without participants being aware of any floor surface change (Fig. 1). Standard shoes with rubber soles (athletic works) were supplied to all subjects to maintain constant COF levels among all participants. A fall-arresting rig was used to protect participants from falling during the experiment and was designed to permit participants to fall approximately 30 cm before arresting the falls and stopping any forward motion. A six-camera ProReflex system (Qualysis) was used to collect three-dimensional posture data of participants as they walked over the test floor surface. Kinematic data were sampled and recorded at 120 Hz. Ground reaction forces of participants walking over the test surfaces were measured using two force plates and sampled at a rate of 1200 Hz. Hamstring muscle activities were measured using electromyography (EMG). The EMG system (Noraxon Telemyo System, Noraxon USA, Inc. Scottsdale, AZ) was composed of one transmitter, one receiver and surface electrodes. The transmitter was portable and powered by a battery (9 V), and the receiver telecommunicated to the transmitter. A built-in amplifier bandpass-filtered the signal (10–500 Hz) and performed an RMS conversion (50 ms-time constant). Raw EMG signals were monitored, sampled and stored by the National Instrument hardware and the LabView system with sampling rate of 1200 Hz.
Fig. 1.
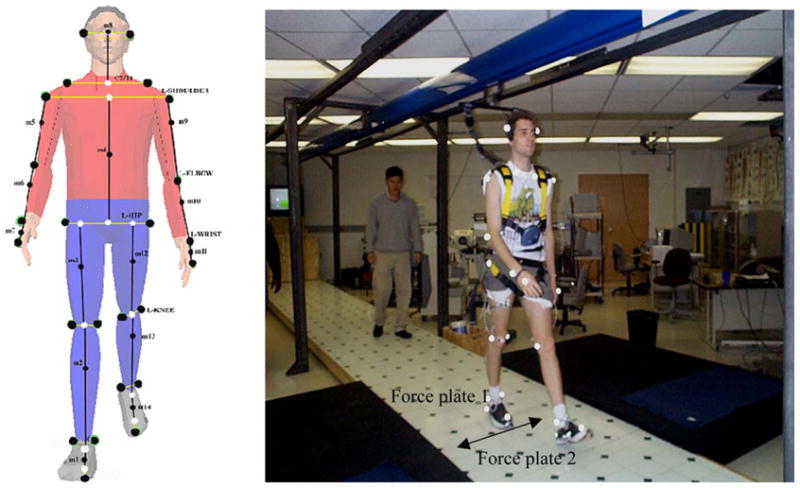
Field layout of the experiment including fall arresting harness and locations of force plates. Lateral moveable floor surfaces at the force plate locations (arrow). On the left side, 26 reflective marker positions (two heel markers hidden on the illustration) are also illustrated.
2.3. Procedure
Twenty-six reflective-markers were attached to anatomically significant landmarks [24,25] to represent the whole body, and two markers were attached to the heel to measure heel velocity (Fig. 1). Two EMG electrodes were placed over the belly of semi-tendinosus in each leg. The electrodes were placed at 50% on the line between the ischial tuberosity and the medial condyle of the tibia. Inter-electrode distance was 20 mm. Thereafter, participants were equipped with the fall arresting rig. All the instructions were presented in written and oral forms. Participants were asked to keep walking back and forth as instructed from one workstation to the other workstation at their preferred speed (i.e. natural gait). They were instructed to always initiate walking by standing behind a line with feet together. In order for experimenters to collect adequate ground reaction forces for each foot (left and right), experimenters adjusted the start line near by the workstations so that their left and right heels struck on the first force plate and on the following force plate, respectively. Participants’ feet consistently struck the force plates after walking about 10–15 min at their natural gait. While walking, they were instructed to count a colored circle and to listen to comedy routine via Walkman. The colored circle was in three different colors. They flashed one at a time randomly on a TV screen located on each workstation. These secondary tasks were provided to take away participants’ attention from the floor surfaces. One of the main purposes of a walkway (during the slippery conditions) with two force plates embedded in the center (with sliding floor to switch from normal-dry floor surface to slippery floor surface) was to simulate realistic slip-induced fall events. Some studies simulated slip-induced fall events utilizing only 2–3 steps. In the present study, it was thought that 2–3 steps could not account for participants’ natural gait characteristics; the present study attempted to evaluate biomechanical response and gait characteristics while all the participants were walking naturally in a laboratory setting. All walking trials lasted in range between 15 min and 20 min and they were told to stop once a slippery surface was introduced. Within each session, one base-line data for normal gait parameters (i.e. posture, GRF and EMG) was collected on the dry vinyl floor surface and, then, a slippery condition was introduced.
2.4. Dependent variables
2.4.1. Heel contact velocity (HCV)
The instantaneous horizontal heel contact velocity was calculated utilizing the heel position in horizontal direction at the foot displacement of 1/120 s before and after the heel contact phase of the gait cycle using the instantaneous heel velocity formula [14]. Heel contact was defined when the vertical force exceeded more than 7 N after the heel contacted the ground (Fig. 2E).
Fig. 2.

Characteristics of EMG and kinematics and kinetics data during walking; these characteristics seen in the graph are observed throughout all the participants in this study: (A) raw EMG of hamstring, (B) integrated EMG of hamstring, (C) heel velocity, (D) heel acceleration and (E) vertical force.
2.4.2. Heel deceleration angle (HAD)
The heel deceleration angle was calculated to investigate the effects of hamstring activation rate on heel contact dynamics utilizing heel position data before heel contact phase of the gait cycle. The heel deceleration data were normalized in gait cycle (x-axis) and in its peak (y-axis) as seen in Figs. 2D and 3.
Fig. 3.
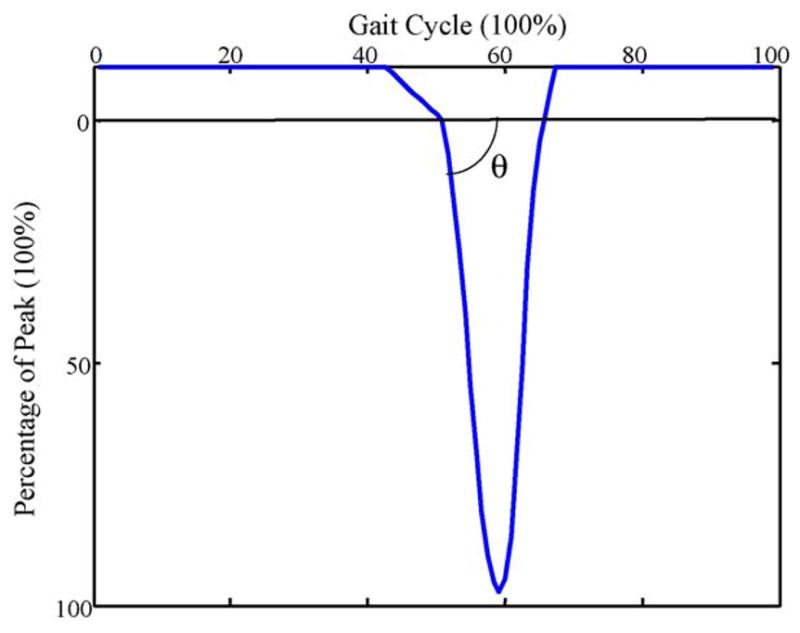
Illustration of deceleration angle. It represents slope of heel deceleration after mid-swing. It is normalized in gait cycle and magnitude of deceleration.
2.4.3. The whole body center-of-mass (COM) velocity (i.e. walking velocity)
The whole body center-of-mass was calculated by averaging all the centers of mass from the 14 segments (left and right feet, left and right shanks, left and right thighs, trunk, left and right hands, left and right lower arms, left and right upper arms, head) link-segment system defined by MacKinnon and Winter [65] and Lockhart et al., [25]. The COM velocity of all the participants was calculated using the formula:
where X = COM;
Then, all COM velocities from heel contact to heel contact were averaged.
2.4.4. Required coefficient of friction
The required coefficient of friction was obtained by dividing the horizontal ground reaction force by the vertical ground reaction force (Fx/Fz) shortly after the heel contacted the dry vinyl floor surface (peak 3 as defined by Perkins [26]).
2.4.5. Muscle activation rate (HAR)
EMGs were normalized using the peak of the within-subject ensemble average addressed by Yang and Winter [27]. The ensemble EMG data were normalized in percent of gait cycle (x-axis) and EMG amplitude (y-axis), as illustrated in Figs. 2B and 4. In order to find the EMG onset of the hamstring muscle, a period between two points in the heel velocity graph (Fig. 2C; points (a) and (b)) was initially identified. The onset of the hamstring muscle occurred between the two points throughout the majority of the participants in this study. During the period, the onset of EMG activity was defined as the point where the signal first deviated more than 1 S.D. from the level recorded as the baseline [28].
Fig. 4.
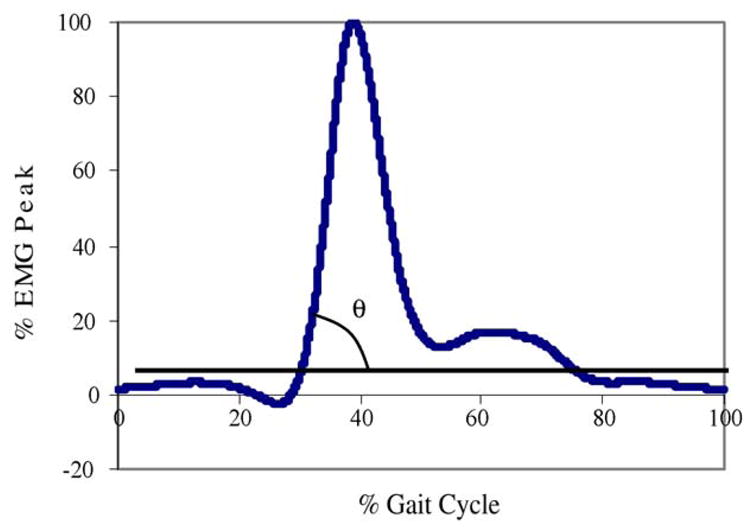
Illustration of hamstring activation rate showing the integrated EMG (iEMG) of hamstring muscle of right leg during a complete gait cycle (i.e. heel contact to heel contact of the same foot, e.g. left heel contact to left heel contact) and percentage of EMG peak of the other leg (e.g. right leg in this example). This figure illustrates normalization of the hamstring iEMG parameter of the swing leg (in this example, right leg) utilizing gait cycle of the other leg (in this example, left leg).
2.4.6. Initial slip distance (SDI)
Slip distance was divided into slip distance I (SDI) and slip distance II (SDII). SDI was measured to provide information concerning the severity of slip initiation. Slip-start point was defined as the point where non-rearward positive acceleration of the heel after heel contact, equivalently where the first minimum of the horizontal heel velocity after the heel contact [24,25] (Fig. 5a). The slip-stop point for SDI was defined as the point where peak horizontal heel acceleration occurred after the slip-start point (mid slip on Fig. 5a). SDI was obtained using the heel coordinates between slip-start and slip-end point on the vinyl floor surface (Fig. 5c).
Fig. 5.

Composite view of slip parameters (adapted from Lockhart et al. [24]).
2.4.7. Slip distance II
Slip distance II provided information concerning the slip behavior after the initiation of slips. The start point for the slip distance II was defined from SDI slip-stop point (peak heel acceleration “mid slip” in Fig. 5a) to the end of slip [24,25]. The end of the slip was estimated as the time where the first maximum of the horizontal heel velocity after slip-start point occurred (Fig. 5a and b) [24,25]. SDII was calculated from the heel coordinates using the distance between the two points as with SDI (Fig. 5c).
2.4.8. Peak sliding heel velocity
The peak sliding heel velocity after slip-start point was measured while slipping (Fig. 5b). This measure was used to predict slip severity in addition to slip distances.
2.4.9. Step length (SL)
The linear distance was measured in the direction of progression between successive points of foot-to-floor contact of the first foot (X1, Y1) and other foot (X2, Y2). Step length was calculated from the distance between consecutive positions of the heel contacting the floor. This measure was used only for test of “inadvertency” to assess if participants walked at the same speed (i.e. natural gait) during different trials (from normal-dry floor surface to slippery floor surface).
2.4.10. Fall frequency
Slip distance, sliding heel velocity, the whole body COM velocity and motion pictures were considered to identify the fall frequency. To be considered as a fall, the slip distance must exceed 10 cm, and peak sliding heel velocity must exceed the whole body COM velocity while slipping [24]. In addition, videos for each slip trial of the participant were analyzed to assess if an actual fall had occurred. All of above three conditions had to be met to be considered as a fall.
2.5. Data analyses
The coordinate data from the motion analysis system were used to calculate the gait parameters (step length, horizontal heel contact velocity, heel deceleration angle, the whole body COM velocity (i.e. walking velocity), initial slip distance, slip distance II and peak sliding heel velocity (PSHV)).
A built-in function of the EMG system (Noraxon Telemyo System, Noraxon USA, Inc. Scottsdale, AZ) converted raw EMG data into integrated EMG data (50 ms-time constant), which were used to determine the activation rate of the hamstring muscle. Force data (horizontal and vertical GRF) were used to determine the friction demand characteristic (as measured by required coefficient of friction) at heel contact on the dry vinyl floor surface only. The EMG and ground reaction forces were collected for 5 s at 1200 Hz and filtered using 4th-order-lowpass-Butterworth-filter at cut-off frequency of 6 Hz following a residual analysis [14]. Kinematic data were recorded for 5 s at 120 Hz and filtered using 4th-order-lowpass-Butterworth-filtered at cut-off frequency of 12 Hz following a residual analysis [14]. To synchronize all of the data (EMG, ground reaction force and kinematics) for each trial, an electronic trigger via a program written in LabView language was used to initiate data collection simultaneously.
Descriptive and inferential statistical analyses were performed by utilizing the JMP statistical packages (SAS Institute Inc., Cary, NC, USA). The group differences were evaluated using one-way analyses of variance (ANOVA). To account for the effect of the walking velocity, analyses of covariance (ANCOVA) was used to evaluate the group difference in hamstring activation rate and heel contact velocity. To test whether or not subjects were aware of the floor surface changes, step length, horizontal heel contact velocity and the whole body COM velocity (i.e. walking velocity) were each analyzed using one-way analyses of variance on both slippery and non-slippery floor surfaces. The results were considered as statistically significant when p ≤ 0.05.
Furthermore, bivariate analyses were performed to investigate relationships between gait parameters, friction demand characteristic and slip parameters. The results were considered as statistically significant when p ≤ 0.05.
3. Results
3.1. Age effect
Table 1 summarizes the mean values and standard deviations for each of the dependent measures in the two age groups.
Table 1.
Means and standard deviations of parameters between young and elderly groups
| Variables | Young mean (S.D.) | Elderly mean (S.D.) | ANOVA | ANCOVA |
|---|---|---|---|---|
| Heel contact velocity (HCV) (cm/s) | 74.36 (21.53) | 57.06 (20.15) | * | N.S |
| Heel deceleration angle (8) | 83.63 (0.75) | 83.08 (0.67) | * | – |
| The whole body COM velocity (cm/s) | 133.23 (11.59) | 120.22 (10.12) | * | – |
| Required coefficient of friction (RCOF) | 0.19 (0.02) | 0.15 (0.02) | * | – |
| Hamstring activation rate (8) | 80.88 (2.40) | 73.36 (7.27) | * | * |
| Slip distance I (SDI) (cm) | 1.89 (1.30) | 0.86 (0.56) | * | – |
| Slip distance II (SDII) (cm) | 7.29 (5.31) | 3.05 (3.75) | * | – |
| Step length (SL) (cm) | 66.09 (6.41) | 61.43 (6.80) | N.S | – |
| Peak sliding velocity (cm/s) | 119.66 (66.57) | 59.88 (43.12) | * | – |
| Fall | Three times | Six times | – | – |
One-way ANOVA on the age differences for all the parameters and ANCOVA on age differences for selected parameters. (–) not applicable; N.S, not significant.
p < 0.05.
3.1.1. Initial gait parameters
The ANOVA results indicated younger adults exhibited significantly higher HAR (F 1,27 = 6.70, p = 0.02), HCV (F 1,27 = 4.22, p = 0.05), walking velocity (F 1,27 = 8.56, p = 0.008) and HDA (F 1,27 = 4.74, p = 0.04). On average, younger adults exhibited higher hamstring activation rate, heel deceleration angle and walking velocity. Even when hamstring activation rate was corrected for walking velocity, the group difference in hamstring activation rate was found to be significant (p = 0.03, ANCOVA). However, when heel contact velocity was corrected for walking velocity (ANCOVA), its difference in the two age groups was not significant. The bivariate analysis indicated the positive correlations between hamstring activation and walking velocity (F 1,27 = 6.19, p = 0.02, R2 = 0.22). In contrast, no relationship between hamstring activation rate and heel deceleration angle or hamstring activation rate and heel contact velocity was found.
3.1.2. Friction demand characteristics
The ANOVA analysis indicated that younger adults had a higher RCOF than older adults (F 1,27 = 11.08, p = 0.002). The bivariate analysis indicated significant correlations between RCOF and heel contact velocity (F 1,27 = 4.84, p = 0.04, R2 = 0.18) and walking velocity (F 1,27 = 10.02, p = 0.004, R2 = 0.44). However, when the correlation between heel contact velocity and RCOF was corrected using walking velocity as a covariate, no relationship was found between heel contact velocity and RCOF (p = 0.72). In all participants, faster walking velocity and higher heel contact velocity were accompanied by the higher RCOF.
3.1.3. Slip parameters
The one-way ANOVA indicated significant differences in SDI (F1,27 = 6.36, p = 0.02), SDII (F1,27 = 5.10, p = 0.03) and peak SHV (F1,27 = 7.32, p = 0.01) between younger and older participants. In general, younger individuals slipped longer and faster than older adults. The bivariate analysis indicated significant statistical correlations between RCOF and SDI (F1,27 = 4.40, p = 0.04, R2 = 0.17), SDII (F1,27 = 7.94, p = 0.01, R2 = 0.27) and PSHV (F1,27 = 12.93, p = 0.001, R2 = 0.35). In general, individuals with higher friction demand (RCOF) slipped longer and faster.
3.1.4. Fall frequency
Older age group fell twice as often as their younger counterparts (six falls compared to three falls, respectively).
3.2. Test of inadvertency
The results of one-way ANOVA suggested no significant floor effects on HCV, walking velocity and SL indicating subjects were not aware of the slippery floor surface change (Table 2).
Table 2.
ANOVA on floor surface (soapy surface and dry surface)
| Younger |
Older |
|||||
|---|---|---|---|---|---|---|
| Dry | Soapy | ANOVA | Dry | Soapy | ANOVA | |
| HCV (cm/s) | 67.43 (26.44) | 76.40 (26.62) | N.S | 60.95 (21.05) | 75.55 (39.48) | N.S |
| COM velocity | 125.44 (17.40) | 125.04 (15.60) | N.S | 118.05 (18.00) | 114.90 (16.48) | N.S |
| Step length | 66.08 (6.41) | 65.54 (6.15) | N.S | 61.43 (6.80) | 60.50 (5.15) | N.S |
N.S, not significant.
p < 0.05.
4. Discussion
The primary objective of the present study was to evaluate if the suggested age-related changes in muscle properties, walking velocity, heel contact velocity and RCOF have an impact on likelihood of slip-induced falls. If results suggested that the slower hamstring activation rate among the elderly would be related to slip-induced fall accidents, an intervention, such as strengthening hamstring muscles could be applied to prevent older adults from slip-induced fall accidents.
In order to determine whether the differences in the gait characteristics were a primary effect of age and not an effect of walking velocity between the two age groups, ANCOVA was performed with walking velocity as a covariate to evaluate differences only due to the effect of age.
4.1. Hamstring activation rate in older adults was lower than their younger counterparts
Previous study [29] suggested that the age-related changes in the skeletal muscle property, such as muscle fiber types, were a factor contributing to falls in the elderly. Also, many studies [7,9,31–35] proposed that a possible mechanism in association with the decreased muscle activation rate among older adults was changes in proportions in muscle fiber types. Previously, an implication of the higher potential risk of slip-induced falls among older adults was presumed upon faster heel contact velocity found among older adults [14,22,25,36,37] while they were exhibiting slower walking velocity than younger adults. Furthermore, studies [14,62] suggested that lower hamstring activation rate was a contributing factor for higher heel contact velocity.
In agreement with the previous suggestion [14], older adults’ hamstring activation rate was lower than their younger counterparts. Overall, younger adults exhibited faster walking velocity and faster hamstring activation rate in comparison to older adults, whereas heel contact velocity did not differ between the two age groups when accounting for walking velocity as a covariate. Additionally, walking velocity was correlated to HAR and HCV in the present study. These results suggested that younger adults’ hamstring muscles were activated at a faster rate than older adults resulting in a sufficient reduction of the heel contact velocity (refer to Fig. 7); it seems that faster HAR played a role in reducing HCV sufficiently, resulting in similar HCV among younger adults while walking faster in comparison to older adults. The previous studies [38–42] found that maximal unloaded shortening velocity in fast-twitch fibers was faster in comparison to slow-twitch fibers and suggested that fast-twitch fibers produced higher force in comparison to slow-twitch fibers in a given time [38–41]. Also, many studies demonstrated a direct relationship between muscle force and EMG activity [36,43–46]. As a result, higher hamstring activation rate found in younger adults in the present study could play a role in producing higher force in hamstring muscles (Fig. 6), decelerating the forward leg momentum sufficiently before heel contact. This statement was further supported by the heel deceleration angle (or heel deceleration rate) prior to heel contact phase of the gait cycle. Higher heel deceleration angle or faster deceleration of the heel of younger individuals suggested that heel contact velocity was sufficiently reduced before the heel contact phase of the gait cycle. This explained why the heel contact velocity was not found to be different between the two age groups in the present study even though younger adults walked faster. Although implicated (i.e. relationship between hamstring activation rate and heel contact velocity), lack of significant relationship between hamstring activation rate and heel contact velocity/heel deceleration angle suggested that hamstring activation rate is not the only factor influencing heel contact velocity and deceleration of the heel. As illustrated in Fig. 7, prior to the heel contact, not only the hamstring muscles were activated, but also Rectus Femoris muscles were activated during normal walking. This pattern was also observed by Hashimoto et al., [63]. Thus, it seems that Rectus Femoris together with hamstring muscles (i.e. co-activation) play an important role in heel contact dynamics. Although suggested, further study incorporating both of these muscles in relationship to heel contact dynamics should be conducted to elucidate this possibility.
Fig. 7.
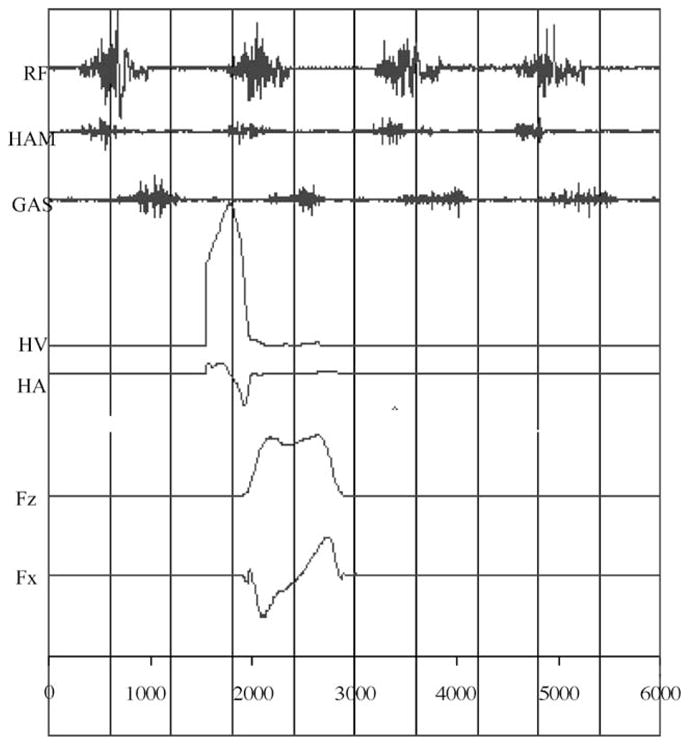
Composite view of raw EMG of rectus femoris (RF), hamstring (HAM), gastronemius (GAS) muscles, heel velocity (HV), heel acceleration (HA), vertical force (Fz) and horizontal force (Fx).
Fig. 6.

Schematic flow diagram for the effect of aging on hamstring activation rate and heel velocity.
4.2. Older adults’ heel contact velocity was slower than their younger counterparts
In previous studies [10,14,23,37], higher heel contact velocity in older adults in comparison to younger adults was found and suggested as a contributing factor for falls among older adults. In the present study, in disagreement with previous studies [10,23–25], the difference in heel contact velocity between the two age groups was mainly due to the effect of walking velocity, not due to the effect of aging. This could be due to the limitations of this study. One of limitations of the present study came from the experimental protocol. Participants were aware of an introduction of a slippery surface while walking, by reading an informed consent form. Lachman et al. [47] and Brown et al. [48] suggested that older adults had an increase level of fear of falling in comparison to younger adults due to previous experiences/expectations regarding an impending disturbance, and argued that a strategy of increased caution (i.e. slowing walking velocity) among older adults was employed. In the present study, older adults’ expectations regarding a slippery surface could slow down their walking velocity more than their younger counterparts and altered their gait characteristics. Previous studies [10,14] that implicated older adults’ higher heel contact velocity did not introduce a slippery surface to participants. This difference in methodology could produce contradicting results in terms of heel contact velocity.
4.3. RCOF was lower in older adults in comparison to younger adults
Several studies suggested that as differences between the friction demand characteristic (i.e. RCOF) and available dynamic COF increased, the number of slip and fall events [16,17] increased. Perkins and Wilson [17] suggested that most slips that led to a fall occurred when the friction force opposing the movement of the foot was less than the shear force of the foot immediately after the heel contacted the ground. Given the constant contact time and mass associated with heel contact of the gait cycle [18], the impulse–momentum relationship indicated that horizontal shear force increased proportionally as horizontal heel contact velocity increased. Furthermore, as indicated by many studies, the gait characteristics, such as heel contact velocity and walking velocity, influenced the friction demand characteristics due to the alterations of the horizontal foot shear force [17,25].
In the present study, as suggested by previous studies [17,18], RCOF was directly correlated to heel contact velocity and walking velocity. However, heel contact velocity was not directly correlated to RCOF when adjusted for walking velocity. These results suggested that heel contact velocity was not the only critical and direct indicator of RCOF. As indicated, older adults exhibited lower RCOF than their younger counterparts. This was a result of younger adults walking faster than older adults. Studies [37,51,52] suggested that the majority of slips were likely to initiate between 70 ms to 120 ms after the heel contacts the ground. In the present study, heel contact velocity was minimized almost to zero after the heel contacted the ground; this result may indicate that during intact normal walking, heel contact velocity may not be a factor contributing to an increased RCOF. When heel contact velocity was minimized to zero, the body traveled forward from one point to the other point in order to maintain forward body momentum. As a result, the imposed horizontal force increased as the whole body COM moved anteriorly as seen in Fig. 8 [25]. The imposed horizontal force continued to increase until it reached peak 3 (RCOF), where a dangerous slip was most likely to occur. As illustrated in Fig. 8, walking velocity (or changes in the whole body COM position) could primarily influence RCOF, which could be used to predict the initiation of slip-induced falls [25]. Thus, it could be improper to suggest that a dangerous slip, which occurs 70–120 ms after heel contact, was directly related to heel contact velocity. Further studies investigating the relationships between the imposed horizontal force (associated with the whole body COM characteristics) and friction demand characteristics should be explored in the future to explain the mechanisms underlying the slip-initiation process.
Fig. 8.

Positions of the whole body COM and RCOF (Fx/Fz) (adapted from Lockhart et al. [25]) after the heel contact.
4.4. Older adults slipped less and slower but fell more often than their younger counterparts
In the present study, younger adults exhibited longer slip distances as well as higher peak sliding heel velocity in comparison to older adults. Higher RCOF, longer slip distance and higher peak sliding heel velocity in younger adults could suggest that younger adults were more prone to encounter slip-induced fall accidents. However, fall frequency results indicated that older adults fell more often than their younger counterparts. These results were in agreement with previous studies [24,64] utilizing fall-recovery-threshold parameters (i.e. initial slip distance, sliding heel velocity, sliding heel acceleration and friction utilization) to explain the relationships between the slip characteristics and falls among different age groups (younger, middle-age and older adults). These studies suggested that younger adults were able to recover from a slip (thus preventing a fall) with much higher sliding speed and longer slip distances. In other words, recovery thresholds (in terms of slip distance and sliding speeds) were different for different age groups.
Possible mechanisms that could explain this phenomenon could be the differences in lower extremity muscle strength, cognitive and sensory impairments between young and older adults [53–55,58,59]. Studies [56,57] suggested that lower extremity muscle weakness was a significant contributing factor to balance dysfunction in older adults. Slip events are very explosive and ballistic; therefore, in order to control or recover from a slip event, rapid force productions of lower-extremity muscles are required. Thus, it seems that younger adults in present study were able to produce sufficient forces in a short time to recover from a fall even though they slipped longer and faster. A thorough investigation relating lower extremity strength and fall recovery process should be conducted to confirm underlying causes associated with fall accidents among the elderly. Additionally, understanding cognitive and sensory impairments among the elderly could clarify the mechanisms associated fall recovery. For example, Tinetti et al. [58] reported that older adults’ fear of falling contributed to changes in the gait characteristics in community dwelling older adults. Tinetti et al. [58] reported that the older adults tended to walk slower to ensure safe gait and they had higher levels of anxiety and depression compared to adults with little fear of falling. This fear of falling could cause problems with balance control, due to an increase in muscle stiffness [59]. Furthermore, sensory degradations in visual and proprioceptive systems [57,60] in older adults could explain the differences in fall frequency among young and older adults. Brownlee et al. [59] suggested that older fallers had proprioceptive dysfunction leading to unstable balance control. Also, Warren et al. [61] suggested that threshold levels for detection of optical flow associated with normal sway rose in older adults. These comments further suggest that studies investigating recovery phase of slip-induced fall accidents are needed.
In conclusion, younger adults’ hamstring activation rate was higher than older adults, whereas younger adults’ heel contact velocity was not different from older adults. These results suggested that heel contact velocity in younger adults was sufficiently reduced before the heel contact phase of the gait cycle. This could be due to the outcome of higher hamstring activation rate in younger adults in comparison to older adults. However, lower friction demand (peak RCOF), shorter slip distances, slower peak sliding heel velocity and more falls among older adults suggested that the slip initiation characteristics were not the only factors contributing to slip-induced falls among the elderly. Thus, studies investigating recovery phase of slip-induced fall accidents are needed to understand fall mechanisms associated with the elderly.
Acknowledgments
This publication was supported by Cooperative Agreement Number UR6/CCU617968 from Centers for Disease Control and Prevention (CDC/NIOSH, K01-OH07450), Its contents are solely the responsibility of the authors and do not necessarily represent the official views of CDC/NIOSH.
References
- 1.Acello B. Falls: a predictor of morbidity and mortality in the elderly. Patientsafety/Patientsafety News. 2001:1. www.patientsafety.com.
- 2.Norton R, Campbell J, Lee-Joe T, Robinson E, Butler M. Circumstances of falls resulting in hip fractures among older people. J Am Geriatr Soc. 1997;45:1108–12. doi: 10.1111/j.1532-5415.1997.tb05975.x. [DOI] [PubMed] [Google Scholar]
- 3.Rubenstein L, Josephson K. The epidimiology of falls and syncope. Geriatr Med Clin. doi: 10.1016/s0749-0690(02)00002-2. in press. [DOI] [PubMed] [Google Scholar]
- 4.National Safety Council. Accidents facts. 2003. [Google Scholar]
- 5.Englander F, Hodson T, Terregrossa R. Economic dimensions of slip and fall injuries. J Forensic Sci. 1996;41:733–46. [PubMed] [Google Scholar]
- 6.Larsson L. Aging in mammalian skeletal muscle. In: Mortimer JA, Pirazzolo PJ, Meletta GJ, editors. The aging motor system. Praeger; New York: 1982. pp. 60–97. [Google Scholar]
- 7.Erim ZM, Faisal Beg M, Burke DT, De Luca CJ. Effects of aging on motor-unit control properties. J Neurophysiol. 1999;82:2081–91. doi: 10.1152/jn.1999.82.5.2081. [DOI] [PubMed] [Google Scholar]
- 8.Howard JE, McGill KC, Dorfman LJ. Age effects on properties of motor unit action potential: ADEMG analysis. Ann Neurol. 1991;24:207–13. doi: 10.1002/ana.410240206. [DOI] [PubMed] [Google Scholar]
- 9.Lexell J. Human aging, muscle mass, and fiber type composition. J Gerontol Ser A. 1995;50A:11–6. doi: 10.1093/gerona/50a.special_issue.11. [special issue] [DOI] [PubMed] [Google Scholar]
- 10.Mills PM, Barrett RS. Swing phase mechanics of healthy young and elderly men. Hum Move Sci. 2001;20:427–46. doi: 10.1016/s0167-9457(01)00061-6. [DOI] [PubMed] [Google Scholar]
- 11.Thelen DG, Schultz AB, Alexander NB, Ashton-Miller JA. Effects of age on rapid ankle torque development. J Gerontol Med Sci. 1996;51A:M226–32. doi: 10.1093/gerona/51a.5.m226. [DOI] [PubMed] [Google Scholar]
- 12.Bonder BR, Wagner MB. Functional performance in older adults. Philadelphia: F.A. Davis; 1994. [Google Scholar]
- 13.Larsson L, Grimby G, Karlsson J. Muscle strength and speed of movement in relation to age and muscle morphology. J Appl Physiol. 1979;46:451–6. doi: 10.1152/jappl.1979.46.3.451. [DOI] [PubMed] [Google Scholar]
- 14.Winter DA. Biomechanics and motor control of human movement. 2. Toronto, ON: Wiley & Sons; 1991. [Google Scholar]
- 15.Winter DA, Patla AE, Frank JS, Walt SE. Biomechanical walking pattern changes in the fit and healthy elderly. Phys Ther. 1990;70:340–7. doi: 10.1093/ptj/70.6.340. [DOI] [PubMed] [Google Scholar]
- 16.Hanson JP, Redfern MS, Mazumdar M. Predicting slips and falls considering required and available friction. Ergonomics. 1999;42(12):1619–33. doi: 10.1080/001401399184712. [DOI] [PubMed] [Google Scholar]
- 17.Perkins PJ, Wilson MP. Slip resistance testing of shoes—new developments. Ergonomics. 1983;26(1):73–82. [Google Scholar]
- 18.Irvine CH. Evaluation of the effect of contact-time when measuring floor slip resistance. J Test Eval. 1986;1:19–22. [Google Scholar]
- 19.Finley FR, Karpovich PV. Locomotor patterns in elderly women. Arch Phys Med Rehab. 1969;50:140–6. [PubMed] [Google Scholar]
- 20.Imms FJ, Edholm OG. The assessment of gait and mobility in the elderly. Age Ageing. 1979;8:261–7. doi: 10.1093/ageing/8.4.261. [DOI] [PubMed] [Google Scholar]
- 21.Imms FJ, Edholm OG. Studies of gait and mobility in the elderly. Age Ageing. 1981;10:147–56. doi: 10.1093/ageing/10.3.147. [DOI] [PubMed] [Google Scholar]
- 22.Murray MP, Kory RC, Clarkson BH. Walking patterns in healthy old men. J Gerontol. 1969;24:169–78. doi: 10.1093/geronj/24.2.169. [DOI] [PubMed] [Google Scholar]
- 23.Karst GM, Hageman PA, Jones TV, Bunner SH. Reliability of foot trajectory measures within and between testing sessions. J Gerontol. 1999;54A:M343–7. doi: 10.1093/gerona/54.7.m343. [DOI] [PubMed] [Google Scholar]
- 24.Lockhart TE, Woldstad JC, Smith JL. ASTM STP 1424 metrology of pedestrian locomotion and slip resistance. West Conshohocken, PA: American Society for Testing and Materials; 2002. Assessment of slip severity among different age groups. [Google Scholar]
- 25.Lockhart TE, Woldstad JC, Smith JL. Effects of age-related gait changes on biomechanics of slips and falls. Ergonomics. 2003;46(12):1136–60. doi: 10.1080/0014013031000139491. [DOI] [PMC free article] [PubMed] [Google Scholar]
- 26.Perkins PJ. American Society of Testing and Materials, Special Technical Publication. Vol. 649. 1978. Measurement of slip between the shoe and ground during walking; pp. 71–87. [Google Scholar]
- 27.Yang J, Winter D. Electromyographic amplitude normalization method: improving their sensitivity as diagnostic tools in gait analysis. Arch Phys Med Rehabil. 1984;65:517–21. [PubMed] [Google Scholar]
- 28.Hodges PW, Bui B. A comparison of computer-based methods for the determination of onset of muscle contraction using electromyography. Electroencephalogr Clin Neurophysiol. 1996;101:511–9. doi: 10.1016/s0013-4694(96)95190-5. [DOI] [PubMed] [Google Scholar]
- 29.Jubrias SA, Odderson IR, Esselman PC, Conley KE. Decline in isokinetic force with age: muscle cross-sectional are and specific force. Pflugers Arch. 1997;434:246–53. doi: 10.1007/s004240050392. [DOI] [PubMed] [Google Scholar]
- 31.Binder MD, Mendel LM, editors. The segmental motor system. New York: Oxford University Press; 1990. [Google Scholar]
- 32.Henneman E, Somjen G, Carpenter DO. Functional significance of cell size in spinal motorneurons. J Neurophysiol. 1965;28:560–80. doi: 10.1152/jn.1965.28.3.560. [DOI] [PubMed] [Google Scholar]
- 33.Milner-Brown HS, Stein RB, Temm R. The contractile properties of human motor units during voluntary isometric contraction. J Physiol (Lond) 1973;228:285–306. doi: 10.1113/jphysiol.1973.sp010087. [DOI] [PMC free article] [PubMed] [Google Scholar]
- 34.Nelson RM, Soderberg GL, Urbscheit NL. Alterations of motor-unit discharge characteristics in aged human. Phys Ther. 1984;64:29–34. doi: 10.1093/ptj/64.1.29. [DOI] [PubMed] [Google Scholar]
- 35.Soderberg GL, Minor SD, Nelson R. A comparison of motor unit behavior in young and aged subjects. Age Ageing. 1991;20(8):8–15. doi: 10.1093/ageing/20.1.8. [DOI] [PubMed] [Google Scholar]
- 36.Karlsson S, Gerdle B. Mean frequency and signal amplitude of the surface EMG of the quadriceps muscles increase with increasing torque––a study using the continuous wavelet transform. J Electromyogr Kinesiol. 2001;11(2):131–40. doi: 10.1016/s1050-6411(00)00046-8. [DOI] [PubMed] [Google Scholar]
- 37.Lockhart TE. The ability of elderly people to traverse slippery walking surfaces. Proceedings of the Human Factors and Ergonomics Society 41st Annual Meeting; 1997. pp. 125–9. [Google Scholar]
- 38.Claflin D, Faulkner J. Shortening velocity extrapolated to zeroload and unloaded shortening velocity of whole rat skeletal muscle. J Physiol (Lond) 1985;395:357–63. doi: 10.1113/jphysiol.1985.sp015589. [DOI] [PMC free article] [PubMed] [Google Scholar]
- 39.Schiaffino S, Reggiani C. Molecular diversity of myofibrillar proteins: gene regulation and functional significance. Physiol Rev. 1996;76:371–423. doi: 10.1152/physrev.1996.76.2.371. [DOI] [PubMed] [Google Scholar]
- 40.Sweeney H, Kushmerick K, Mabuchi K, Sreter F, Gergely J. Myosin alkali light chain and heavy chain variations correlate with altered shortening velocity of isolated skeletal muscle fibers. J Biol Chem. 1988;263:9034–9. [PubMed] [Google Scholar]
- 41.Thompson L, Brown M. Age-related changes in contractile properties of single skeletal fibers from the soleus muscle. J Appl Physiol. 1999;86(3):881–6. doi: 10.1152/jappl.1999.86.3.881. [DOI] [PubMed] [Google Scholar]
- 42.Thompson L. Effects of age, and training on skeletal muscle physiology and performance. Phys Ther. 1994;74:71–81. doi: 10.1093/ptj/74.1.71. [DOI] [PubMed] [Google Scholar]
- 43.De Luca CJ. The use of surface electromyography in biomechanics. J Appl Biomech. 1997;13:135–63. [Google Scholar]
- 44.Linnamo V, Moritani T, Nicol C, Komi PV. Motor unit activation patterns during isometric, concentric and eccentric actions at different force levels. J Electromyogr Kinesiol. 2003;13(1):93–101. doi: 10.1016/s1050-6411(02)00063-9. [DOI] [PubMed] [Google Scholar]
- 45.Madeleine P, Bajaj P, Søgaard K, Arendt-Nielsen L. Mechanomyography and electromyography force relationships during concentric, isometric and eccentric contractions. J Electromyogr Kinesiol. 2001;11(2):13–121. doi: 10.1016/s1050-6411(00)00044-4. [DOI] [PubMed] [Google Scholar]
- 46.Marras WS, Davis K, Maronitis A. A non-MVC EMG normalization technique for the trunk musculature: Part 2. Validation and use to predict spinal loads. J Electromyogr Kinesiol. 2001;11(1):11–8. doi: 10.1016/s1050-6411(00)00040-7. [DOI] [PubMed] [Google Scholar]
- 47.Lachman M, Howland J, Tennstedt S, Jette A, Assmann S, Peterson E. Fear of falling and activity restriction: the survey of activities and fear of falling in the elderly (SAFE) J Gerontol B Psychol Sci Soc Sci. 1998;53B:43–50. doi: 10.1093/geronb/53b.1.p43. [DOI] [PubMed] [Google Scholar]
- 48.Brown L, Gage W, Polych M, Sleik R, Winder T. Central set influence on gait. Exp Brain Res. 2002;145:286–96. doi: 10.1007/s00221-002-1082-0. [DOI] [PubMed] [Google Scholar]
- 51.Gronqvist R. Research Report. Vol. 2. Finnish Institute of Occupational Health; Helsinki: 1995. A dynamic method for assessing pedestrian slip resistance. [Google Scholar]
- 52.Strandderg L, Lanshammar H. The dynamics of slipping accidents. J Occup Accid. 1981;3:153–62. [Google Scholar]
- 53.Frontera WR, Hughes VA, Fielding RA, Fiatarone MA, Evans WJ, Roubenoff R. Aging of skeletal muscle: a 12-yr longitudinal study. J Appl Physiol. 2000;88:1321–6. doi: 10.1152/jappl.2000.88.4.1321. [DOI] [PubMed] [Google Scholar]
- 54.Frontera WR, Hughes VA, Luts KJ, Evans WJ. A cross-sectional study of muscle strength and mass in 45 to 78-year-old men and women. J Appl Physiol. 1991;71:644–50. doi: 10.1152/jappl.1991.71.2.644. [DOI] [PubMed] [Google Scholar]
- 55.Madson OR, Lauridsen U, Kartkopp A, Sorensen O. Muscle strength and soft tissue composition as measured by dual energy X-ray absorptiometry in women aged 18–87 years. Eur J Appl Physiol. 1997;75:239–45. doi: 10.1007/s004210050154. [DOI] [PubMed] [Google Scholar]
- 56.Whipple R, Wolfson L, Amerman P. The relationship of knee and ankle weakness to falls in nursing home residents: an isokinetic study. J Am Geriatr Soc. 1987;35:13–20. doi: 10.1111/j.1532-5415.1987.tb01313.x. [DOI] [PubMed] [Google Scholar]
- 57.Woolacott MH. Aging and postural control: changes in sensory organization and muscular coordination. Int J Aging Hum Dev. 1986;23:97–101. doi: 10.2190/VXN3-N3RT-54JB-X16X. [DOI] [PubMed] [Google Scholar]
- 58.Tinetti M, Richman D, Powell L. Fall efficacy as a measure of fear of falling. J Gerontol. 1990;45:239–43. doi: 10.1093/geronj/45.6.p239. [DOI] [PubMed] [Google Scholar]
- 59.Brownlee M, Banks M, Crosbie W, Meldrum F, Nimmo M. Consideration of spatial orientation mechanisms as related to elderly fallers. Gerontology. 1989;35:323–31. doi: 10.1159/000213044. [DOI] [PubMed] [Google Scholar]
- 60.Wolfson L, Whipple R, Amerman P, Kaplan J, Kleinberg A. Gait and balance in the elderly. Clin Geriatr Med. 1985;1–3:649–59. [PubMed] [Google Scholar]
- 61.Warren W, Blackwell A, Morris M. Age differences in perceiving the direction of self-motion from optical flow. J Gerontol. 1989;44:147–53. doi: 10.1093/geronj/44.5.p147. [DOI] [PubMed] [Google Scholar]
- 62.Inman VT, Ralston HJ, Todd F. Human walking. Baltimore: Williams and Wilkins; 1981. [Google Scholar]
- 63.Hashimoto F, Ogawa R, Kameyama O. Control engineering and electomyographic kinesiology analyses of normal human gait. J Orthop Sci. 2000;5:139–49. doi: 10.1007/s007760050141. [DOI] [PubMed] [Google Scholar]
- 64.Brady R, Pavol M, Owings T, Grabiner M. Foot displacement but velocity predicts the outcome of a slip induced in young subjects while walking. J Biomech. 2000;33:800–8. doi: 10.1016/s0021-9290(00)00037-3. [DOI] [PubMed] [Google Scholar]
- 65.Mackinnon CD, Winter DA. Control of whole body balance and posture in the frontal plane during human walking. J Biomech. 1993;26:633–44. doi: 10.1016/0021-9290(93)90027-c. [DOI] [PubMed] [Google Scholar]