Abstract
Many methods have been proposed for generating an image-derived input function (IDIF) exclusively from PET images. The purpose of this study was to assess the viability of a multimodality approach utilizing registered MR images. 3T-MR and HRRT-PET data were acquired from human subjects. Segmentation of both the left and right carotid arteries was performed in MR images using a 3D level sets method. Vessel centerlines were extracted by parameterization of the segmented voxel coordinates with either a single polynomial curve or a B-spline curve fitted to the segmented data. These centerlines were subsequently re-registered to static PET data to maximize the accurate classification of PET voxels in the ROI. The accuracy of this approach was assessed by comparison of the area under the curve (AUC) of the IDIF to that measured from conventional automated arterial blood sampling.
Our method produces curves similar in shape to that of blood sampling. The mean AUC ratio of the centerline region was 0.40±0.19 before re-registration and 0.69±0.26 after re-registration. Increasing the diameter of the carotid ROI produced a smooth reduction in AUC. Thus, even with the high resolution of the HRRT, partial volume correction is still necessary. This study suggests that the combination of PET information with MR segmented regions will demonstrate an improvement over regions based solely on MR or PET alone.
I. Introduction
The blood radioactivity curve or input function is necessary for full quantification of tissue kinetics from time-activity curves (TACs) using kinetic modeling techniques. The High Resolution Research Tomograph (HRRT), a brain-dedicated, three-dimensional (3D) PET scanner, has made possible unprecedented characterization of small features with a resolution better than 3 mm [1]. This makes it feasible to measure the TAC from a brain blood pool, thus negating the need for arterial cannulation normally required to measure the input function. In addition, corrections normally applied to measured arterial data, including dispersion and delay between the brain and radial artery, can be avoided. Several methods have been proposed to define blood pools in cerebral PET data by clustering PET voxels or applying manually delineated ROIs directly [2], [3]. Methods dependent only on PET data often prove difficult due to the low SNR in PET images. We propose the use of co-registered anatomic magnetic resonance (MR) images to aid in the identification of internal carotid artery voxels in human dynamic PET data. Image-derived input functions (IDIFs) were determined and compared to the gold standard arterial blood sample data.
II. Methods
A. Overview
Emission data were acquired using the HRRT scanner. MR images were collected on a 3T scanner. MR images were registered to PET images by normalized mutual information (NMI) with a 6-parameter transformation using the full brain stripped of surrounding bone and tissue. Registered MR images and PET images were resampled by trilinear interpolation to produce a final voxel size of about 0.2 mm in each dimension.
Left and right carotid arteries were simultaneously segmented in registered MR images. Centerline curves for the segmented carotid regions were extracted by parameterizing the segmented voxel coordinates and modeling these curves with either single polynomials or B-splines.
Centerlines were applied to early PET images and reregistered locally to maximize the average activity along the centerline. Transformation matrices were found for the left and right carotids independently. Repositioned centerlines were applied to the dynamic frames to measure carotid TACs. Carotid ROIs were expanded to a range of diameters around the centerline and TACs were measured and compared to blood sample data.
B. Dynamic Human Measurements
Subject data from two human tracer protocols were used in this study. Six healthy controls received multiple [15O]water injections of 740 MBq infused over 20 s. List-mode data were collected for 3 minutes per injection. Summed images of 60 s duration as well as dynamic sets of 24 5-s frames were reconstructed for each injection. Eight healthy controls received multiple [11C]MRB (norepinephrine transporter ligand) injections of 740 MBq infused over 60 s [4]. List mode data were collected for 120 minutes per injection, but in this work, data from the first 7 min was considered. Dynamic set of images were reconstructed with frame intervals of 1 × 15 s, 5 × 30 s, 1 × 45 s, 2 × 60 s, and 1 × 90 s. Original reconstructed image dimensions were 256 × 256 × 207 with a voxel size of 1.2 mm in each dimension. Images were reconstructed using MOLAR, a custom cluster-based list-mode OSEM algorithm [5]. Reconstructions included corrections for attenuation, normalization, deadtime, randoms, scatter, and motion (measured with the Polaris Vicra tracking system, Northern Digital Inc., Ontario Canada). The arterial input function was measured using an automated blood counter (ABC) system [6]. This system consists of a peristaltic pump which passes blood from an arterial line through a BGO detector. ABC data were corrected for decay, sensitivity, deadtime, external dispersion, and delay between the brain and the external detector. The delay was determined by a whole brain model fit. MR images were generated with an MPRAGE protocol for quick acquisition T1-weighted images. The original resolution of the MR images was 1 mm in each dimension.
C. MR Segmentation
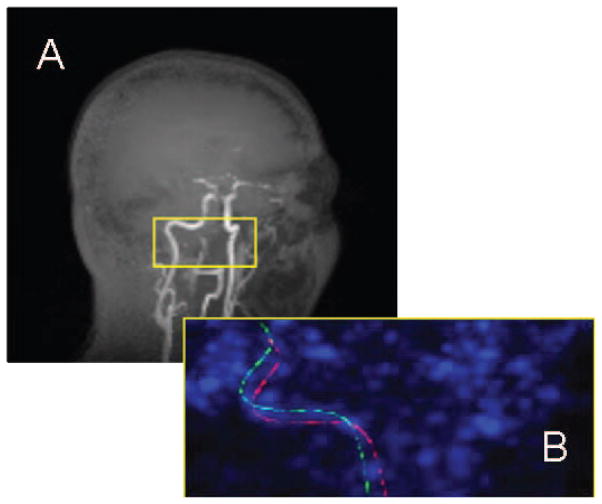
Carotid arteries were visually located in the MR images and bounding boxes, approximately 8 cm (sagittal axis) × 4 cm (coronal axis) × 1.5 cm (transverse axis), were defined to improve the speed and accuracy of the segmentation (Fig. 1). Bounding boxes were positioned to include the cervical portion of the internal carotid artery between the bifurcation with the external carotid and the petrous segment. Images were also thresholded, eliminating values below 20% of the maximum intensity in the bounded region, to reduce the influence of low intensity background. The segmentation was implemented using the level sets method which relates the evolution of a surface to image properties through a signed distance function such that the zero level set of this function contains the desired boundary [7]. In contrast to the more conventional use of the image gradient in the speed term which controls propagation of the level set, the segmentation was based on a piecewise smooth distribution of intensity, an application of the Mumford-Shah functional pioneered by Chan and Vese for image segmentation [8]. The variance of image intensity inside and outside the boundary is minimized through F stopping the level set function ϕ.
Fig. 1.
Maximum intensity projections of (A) T1-weighted MR image of human head with brain subtracted for clarity and (B) zoomed image of centerlines in early PET image. (A) Yellow box on orthogonal MR image shows approximate location of bounding box. (B) Initial position of centerline as determined by whole brain registration is shown in green. Position of centerline after local re-registration is shown in red.
| (1) |
| (2) |
Here I0 is the image intensity, s1 and s2 are the mean values inside and outside the boundary, respectively, and λ1, λ2, ν, and μ are weights. St, the boundary is implicitly determined as St = {(x, y, z) | ϕ(x, y, z, t) = 0}. The segmentations were initialized using the pixels with an intensity greater than or equal to 95% of the maximum intensity in the bounded region of the image. Both carotids were simultaneously segmented from each MR image. The result of this segmentation is a binary image (ϕ> 0) with an initial estimate of the location of the carotid.
D. Centerline Modeling
The segmented carotid arteries were modeled by fitting the 3D coordinates of the carotid ROI voxels in the binary images to either a single parameterized polynomial of at least third degree or a uniform cubic B-spline curve. A uniform cubic B-spline has cubic polynomial segments with equally spaced knots, or junctions where smoothness is enforced [9]. This step was performed in order to reduce reliance on the accuracy of the MR segmented cross section size of the carotids. Also, this provides a framework for controlling the tortuosity of the carotid ROIs.
Polynomial coefficients for third to ninth order polynomials representing the centerline were estimated by minimizing the Euclidean distance between all segmented voxels and their respective nearest points on the parameterized curve by nonlinear least squares. The ninth order polynomial model in three dimensions had 30 unknown coefficients estimated. The nearest point on the centerline curve to each segmented voxel was found as a function of the curve parameters by Newton-Raphson at each iteration of the optimization.
The spline curves were defined by the positions of control points; here, the number of such points was varied from 3 to 9. Control point positions were also estimated using nonlinear least squares minimizing the Euclidean distance between segmented voxels and their corresponding nearest sampled points on the spline curve. The five control point spline curve model in three dimensions had 15 values estimated, each control point having three coordinate values. Segmented voxels were assigned to the nearest sampled point or node along the spline curve for calculating distance at each iteration.
E. Centerline PET-MR Registration
From the initial PET-MR registration, centerlines were applied to the 60-s PET images for [15O]water and to summed 45 s PET images for the [11C]MRB. Early frames were chosen by visual inspection for visibility of the carotid arteries and low activity in the surrounding tissue and proximal brain regions. Since registration of the PET images is optimized for the whole brain, small errors in this registration will cause objects which are far off-center in the image, such as the carotids, to be misaligned. Thus, the centerline position and orientation was then optimized by finding the values of the 6 registration parameters that maximized the average radioactivity concentration measured along the centerline. This was done for both the left and right carotids of each subject independently. Registered centerlines were then applied to the dynamic data sets and time-activity curves collected.
F. Carotid ROI Diameter Variation
The approximate Euclidean distance from all points in the region local to each carotid centerline was calculated. Carotid ROIs of varying diameter were constructed by selecting all voxels less than specific radii from the centerline. Carotid ROIs with diameters 2, 4, 6, and 8 mm were evaluated by application to the dynamic data sets to collect time-activity curves.
III. Results
A. Centerline Accuracy
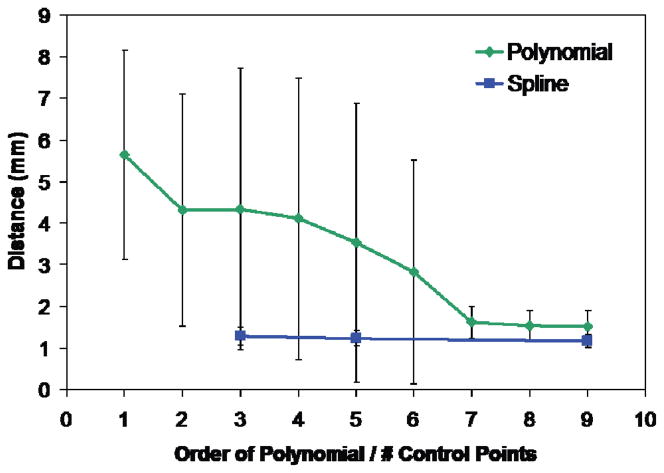
Single polynomials centerline fits improved drastically up to seventh order polynomials, which required estimating 24 coefficients. This can be observed in the sharper decrease in average perpendicular distance from a segmented voxel to the centerline model as the order of the single polynomial is increased (Fig. 2). Average distance from a segmented voxel to the modeled centerline for a ninth degree polynomial was 1.5 ± 0.4 mm. Spline curves with three control points or more performed similarly to the higher order single polynomials. Average distance from a segmented voxel to the modeled centerline for a spline curve with five control points was 1.2 ± 0.2 mm. This approach, though, required much less computation time.
Fig. 2.
Average distance between segmented carotid voxels and nearest point on centerline curve as a function of curve complexity. Single polynomial curves of 7th degree and higher performed similarly to spline curves having 3 to 9 control points.
B. Re-registration
The left and right carotid centerlines were independently reregistered to early PET images. The ipsilateral and contralateral transformation matrices were applied to each centerline and the resultant positions compared. If the datasets were perfectly matched, the transformation matrices from left and right carotids would be identical. The distance between a given centerline transformed by its own transformation matrix and that same centerline transformed by the matrix from the other centerline from the same scan was computed. This distance should approach zero if both matrices were similar. The average distances are given in Table 1 for both centerline models and clearly demonstrate the need for individual carotid registration.
Table I.
Difference between registration with ipsilateral and contralateral transformation matrix
| Centerline Model | Right | Left |
|---|---|---|
| Single Polynomial (9th order) | 12.6 ± 5.9 mm | 9.0 ± 7.6 mm |
| Spline (5 Ctrl Pts) | 4.6 ± 1.5 mm | 9.0 ± 7.6 mm |
C. Comparison of IDIF to ABC
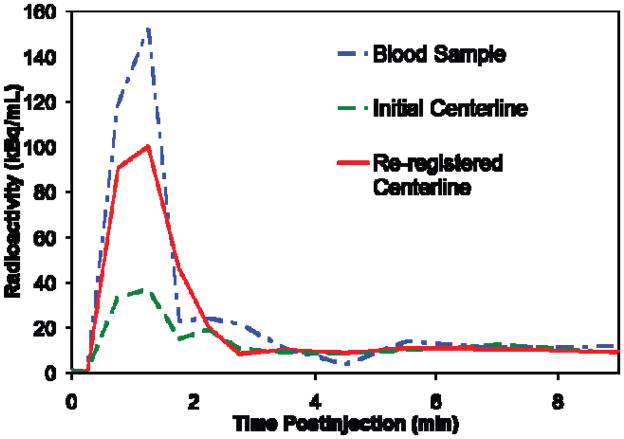
IDIFs were similar in shape to the TACs collected with the ABC system. The early maximum peaks were in good temporal agreement after delay correction of the ABC data [10]. The curves for re-registered carotids were generally higher than corresponding uncorrected application of the carotid segmentations to PET data (Fig. 3). ABC data which had a finer temporal resolution was rebinned, averaging values around the same time points as the IDIF data. However, the ABC curve peaks were still higher for the same subject. This is due to the partial volume effect as the carotid diameter (~ 5 mm) is not sufficiently large to provide accurate quantification for the HRRT (~ 3 mm resolution).
Fig. 3.
Example of results for an individual subject. Spline centerline approximation with five control points was used. Note that peaks are temporally well synchronized. The curve for centerline positioned by whole brain registration (shown in green) is lower than that for centerline positioned by local re-registration (shown in red). Both are lower than the curve derived from the automated blood counter (shown in blue).
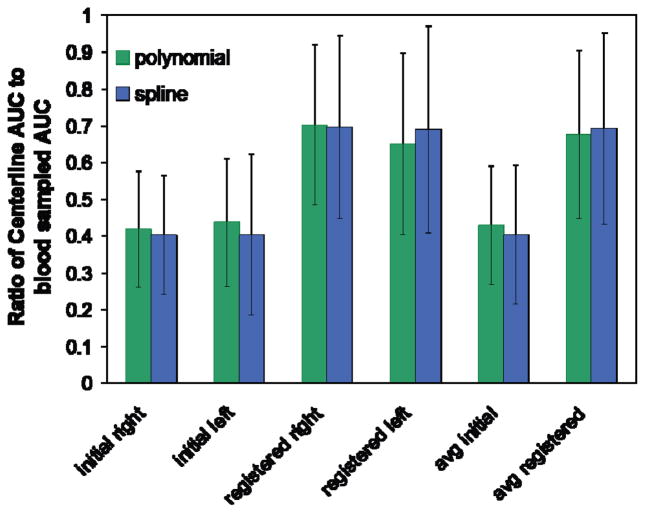
The area under the curve (AUC) was calculated for IDIFs and compared to the blood sampled curves before and after local re-registration for both left and right carotids (Fig. 4). AUC was calculated over the first two minutes post-injection for [15O]water and over the first seven minutes for [11C]MRB. Average AUC ratio improved from 0.40 ± 0.19 for centerlines positioned with initial registration to 0.69 ± 0.26 for centerlines positioned by local re-registration. Left and right carotids AUC values for each subject differed by 0.10 ± 0.09 or about 10% of the blood sampled AUC before re-registration. This value increased to 0.18 ± 0.13 after local re-registration. Higher variability between the left and right carotids after re-registration could indicate unequal accuracy of re-registration for the left and right carotids.
Fig. 4.
Ratio of centerline AUC to blood sampled AUC averaged over all subjects (n = 14) for left and right carotids. Single polynomial of 9th order and 5 control point spline centerline models were used. “Initial” values are derived from centerline positioning using the original brain registration. “Registered” values are derived from centerline positioning using the local re-registration. Far right “avg” values are averaged over left and right carotids.
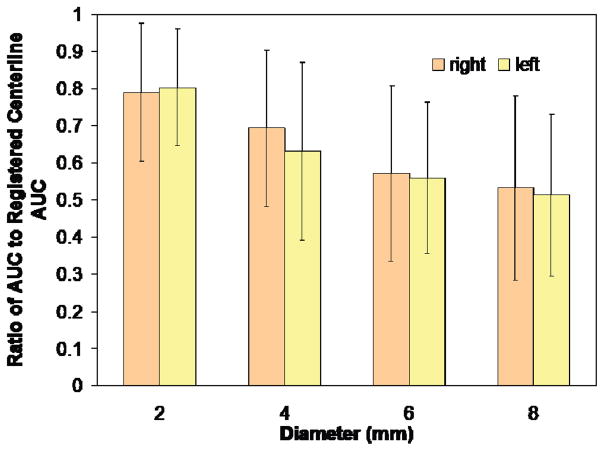
Increasing the carotid ROI diameter produced a steady decline in AUC from the value measured using only the centerline (Fig. 5).
Fig. 5.
Ratio of AUC of expanded carotid ROIs to AUC of centerline. Increasing diameter steadily decreases AUC ratio. Average diameter of the carotid artery is approximately 5 mm.
IV. Discussion
The proposed method successfully characterizes a carotid ROI in PET images utilizing anatomical MR information with minimal user intervention. It is only necessary for the user to specify the general area of the carotids by locating the bounding box. TACs measured by this method were of similar shape to curves measured by continuous blood sampling.
Local re-registration of the MR-based centerline to the PET images improved results demonstrating some misalignment of the carotids when using a transformation based solely on a brain registration. The large differences between carotid positions after registration using only the left or right carotid suggest that independent registration is necessary for accurate alignment. The need for a separate re-registration for left and right carotids was not expected. This difference may indicate a subtle scale distortion between the high resolution MR and PET images. Carotid flexion could also contribute to errors in registration.
Both single polynomial and spline curve models of the centerline produced similarly accurate approximations to the true ROI centerline. However, the spline fitting algorithm proved to be much better computationally. The centerline model easily allows the carotid diameter to be experimentally changed and subsequent TACs analyzed. It could also be expanded into a more complete tubular model which could serve as a framework for incorporating warping or flexing effects.
The smooth reduction in AUC ratio with increasing diameter is indicative of the partial volume effect. With partial volume correction, one would expect to eliminate this dependency on size of the ROI and would also expect better recovery of the peak TAC value. Future work will include a partial volume model to correct for both partial volume and spillover effects.
Local re-registration using both carotids simultaneously did not initially produce results comparable to independent registration. The increase in variability between left and right carotids with re-registration and overall increase in AUC ratio suggest that possibly one of the two carotids in each subject has a much more accurate re-registration. Determining whether the left or right transformation is more accurate for a particular and subject and applying this transformation to both carotids may improve results.
MR angiography utilizes techniques to more clearly image blood vessels for diagnosis. These techniques could potentially improve segmentation of the carotid artery. These methods include the use of gadolinium contrast agents, time-of-flight measurements, and MR acquisition sequences, such as “dark blood”, to highlight the vasculature [11]. Ideally, any adjustment to the MR protocol to highlight the carotids would not come at the expense of high contrast and detail in the brain regions. Furthermore, additional injections or lengthy MR sequences could be a burden to the human subjects. Improvements to the segmentation algorithm may yield a more accurate determination of the carotid diameter along the entire length of the vessel. When registered locally to the PET data through the centerlines, diameter information would aid in subvoxel delineation of the PET images, and would be of great value for the partial volume correction.
The results of this study confirm that MR-derived carotid regions can be applied to PET data with appropriate re-registration for the purposes of IDIF extraction. The higher resolution and anatomical detail possible with MR images could reduce errors related to low SNR when clustering in PET data along [12].
Acknowledgments
We thank Zhongdong Sun for programming support and the staff of the Yale PET Center for the studies which formed the basis of this work.
This work was supported by Grant Number R01NS058360 from the National Institute of Neurological Disorders And Stroke.
Contributor Information
Edward K. Fung, Email: edward.fung@yale.edu, PET center, Yale University, New Haven, CT 06511 USA.
Beata Planeta-Wilson, Email: beata.planeta-wilson@yale.edu, PET center, Yale University, New Haven, CT 06511 USA.
Tim Mulnix, Email: tim.mulnix@yale.edu, PET center, Yale University, New Haven, CT 06511 USA.
Richard E. Carson, Email: richard.e.carson@yale.edu, PET center, Yale University, New Haven, CT 06511 USA.
References
- 1.de Jong H, Knoess C, Lammertsma A, Lenox M, Vollmar S, Casey M, Wienhard K, Heiss WD, Boellaard R. Performance characteristics of the high resolution research tomograph comparison of three prototypes. IEEE Med Imaging Conf Record. 2004;6:3437–3439. [Google Scholar]
- 2.Chen K, Chen X, Renaut R, Alexander GE, Bandy D, Guo H, Reiman EM. Characterization of the image-derived carotid artery input function using independent component analysis for the quantitation of [18F] fluorodeoxyglucose positron emission tomography images. Phys Med Biol. 2007;52:7055–7071. doi: 10.1088/0031-9155/52/23/019. [DOI] [PubMed] [Google Scholar]
- 3.Mourik JEM, Lubberink M, Klumpers UMH, Comans EF, Lammertsma AA, Boellaard R. Partial volume corrected image derived input functions for dynamic PET brain studies. Neuroimage. 2008;39:1041–1050. doi: 10.1016/j.neuroimage.2007.10.022. [DOI] [PubMed] [Google Scholar]
- 4.Ding YS, Lin KS, Garza V, Carter P, Alexoff D, Logan J, Shea C, Xu YW, King P. Evaluation of a new norepinephrine transporter PET ligand in baboons, both in brain and peripheral organs. Synapse. 2003 Dec;50:345–352. doi: 10.1002/syn.10281. [DOI] [PubMed] [Google Scholar]
- 5.Carson RE, Barker WC, Liow J-S, Adler S, Johnson CA. Design of a motion-compensation OSEM List-mode Algorithm for Resolution-Recovery Reconstruction of the HRRT. Proc. IEEE Nuclear Science Symp; Portland, OR. 2003. pp. 3281–3285. [Google Scholar]
- 6.Boellaard R, van Lingen A, van Balen SCM, Hoving BG, Lammertsma AA. Characteristics of a new fully programmable blood sampling device for monitoring blood radioactivity during PET. Eur J Nuc Med. 2001;28:81–89. doi: 10.1007/s002590000405. [DOI] [PubMed] [Google Scholar]
- 7.Sethian JA. Level Set Methods and Fast Marching Methods. 2. Cambridge, UK: Cambridge University Press; 1999. [Google Scholar]
- 8.Chan TF, Vese LA. Active contours without edges. IEEE Trans Image Proc. 2001;10:266–277. doi: 10.1109/83.902291. [DOI] [PubMed] [Google Scholar]
- 9.Biswas S, Lovell BC. Bézier and Splines in Image Processing and Machine Vision. London, UK: Springer-Verlag; 2008. pp. 109–130. [Google Scholar]
- 10.Iida H, Higano S, Tomura N, Shishido F, Kanno I, Miura S, Murakami M, Takahashi K, Sasaki H, Uemura K. Evaluation of regional difference of tracer appearance in time in cerebral tissues using [15O] water and dynamic positron emission tomography. J Cereb Blood Flow Metab. 1988;8:285–288. doi: 10.1038/jcbfm.1988.60. [DOI] [PubMed] [Google Scholar]
- 11.Suri JS, Liu K, Reden L, Laxminarayan S. A review on MR vascular image processing algorithms: acquisition and prefiltering: part I. IEEE Trans on Info Tech in Biomed. 2002 Dec;6:324–337. doi: 10.1109/titb.2002.804139. [DOI] [PubMed] [Google Scholar]
- 12.Naganawa M, Kimura Y, Manabe Y, Chihara K. Practical consideration about cost functions of spatial independent component analysis in medical image processing. Proc IEEE Eng Med Biol Conf. 2005:1120–1122. doi: 10.1109/IEMBS.2005.1616617. [DOI] [PubMed] [Google Scholar]


