Solid-state NMR (SSNMR) spectroscopy is a uniquely effective method for protein structure determination of insoluble protein fibrils or aggregates.1-4 SSNMR spectra of such samples often contain intramolecular and intermolecular correlations with similar intensities, leading to ambiguities in interpretation of data sets obtained from undiluted, uniformly 13C,15N-labeled samples. In order to faithfully reproduce tertiary and quaternary structural features, differential isotopic labeling strategies must be utilized. For example, intensities of intermolecular crosspeaks are attenuated by diluting the labeled sample in natural abundance material. Alternatively, these signals can be accentuated by utilizing regio-specific 15N and 13C labeling, as demonstrated in studies of reassembled thioredoxin,5 or recrystallizing physical mixtures of 15N and 13C labeled proteins, such as Crh.6 With such labeling patterns, heteronuclear distance techniques—such as REDOR,7 TEDOR,8 and NHHC methods6—can be applied to obtain site-specific distance restraints across molecular interfaces.
Here we extend this approach to the full, atomic-resolution structure determination of a quaternary protein assembly in the nanocrystalline state. We utilize 3D Z-filtered TEDOR,9 as recently demonstrated to quantify intramolecular distances in proteins,10 to detect site-resolved intermolecular correlations. The distance restraints are incorporated into simulated annealing calculations, resulting in a specific quaternary arrangement that is independent of the initial condition. For example, if the coordinates from the known trigonal X-ray crystal structure (PDB ID 2QMT)11 are used as the starting point for the calculation, the NMR restraints refine the exact atom positions but do not change the quaternary arrangement; if instead the orthorhombic X-ray lattice coordinates are used (PDB ID 2GI9),12 in the course of the calculation, the relative orientations of neighboring molecules change substantially, transforming into the trigonal form. Finally, calculations initialized with isolated monomers converge to the trigonal form. These results demonstrate that SSNMR methods can fully reproduce not only secondary and tertiary, but also quaternary, structural features at atomic-resolution detail.
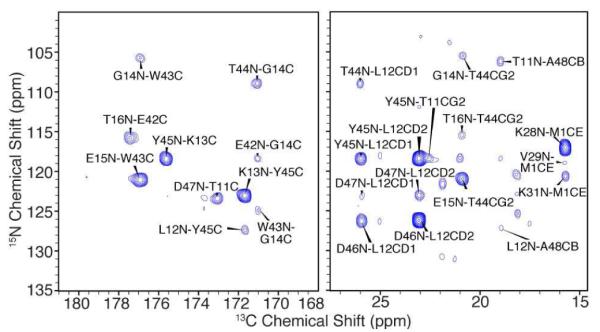
Previously we have collected a range of structural data for GB1 in the nanocrystalline state—including homonuclear distance restraints and vector angles,13 backbone chemical shift tensors,14 and high-precision 15N-13C distance restraints.10 The 3D Z-filtered TEDOR pulse sequence produces hundreds of intramolecular 15N-13C restraints, which are sufficient (with TALOS15 restraints) to define an atomic resolution protein structure (PDB ID 2KQ4).10 Extending this approach to physical mixtures (50:50) of 13C- and 15N-labeled molecules (see Supporting Information (SI) for sample preparation details) results in a rich set of intermolecular restraints. The spectra were collected with a 500 MHz Varian InfinityPlus spectrometer and 3.2-mm Balun™ 1H-13C-15N probe, with ~100 kHz TPPM decoupling16 during the REDOR periods (see SI for complete experimental details). Under these conditions, the 15N and 13C (especially methyl and carbonyl) T2 values are >25 ms, coherence lifetimes that in combination with the sparse labeling pattern (mitigating effects of scalar 13C-13C couplings) enabled the detection of particularly strong TEDOR cross peaks. The peak intensities continue to increase up to mixing times of at least 20 ms (Figure 1, Figure S1). Most of these correlations are intermolecular correlations (natural abundance, intramolecular correlations are observed but are much weaker, and can be readily identified with spectra at short mixing times; see SI). Reverse labeling of the 15N sample with 13C-depleted glucose would further suppress these undesireable peaks, and this strategy would be beneficial for proteins of higher molecular weight and/or greater spectral degeneracy.
Figure 1.

2D 15N-13C plane of 3D ZF-TEDOR spectrum, illustrating intermolecular correlations from a recrystallized physical (50:50) mixture of 1,3-13C-glycerol and 15N-labeled GB1. Data were acquired at 500 MHz (1H) with 21.6 ms 15N-13C mixing, 14.4 ms 15N and 30.7 ms 13C evolution. Total measurement time 26 hrs.
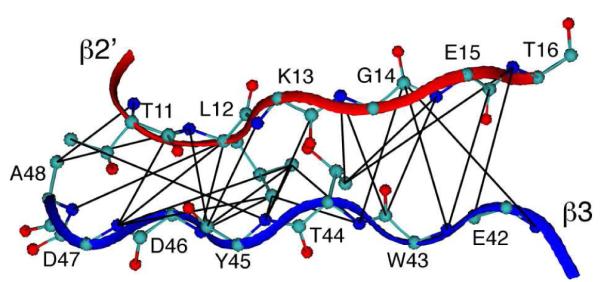
The observed 15N and 13C linewidths were ~0.5 and 0.2-0.3 ppm, respectively, enabling unique (unambiguous) assignment of several intermolecular correlations based on the known GB1 chemical shifts.17 From these assignments, we identified two distinct molecular interfaces: (1) an anti-parallel intermolecular beta-sheet (β2-β3’), defined by long-range correlations with (i+j) = 58 ± 2 (Figure 2) and (2) contacts between helical residues 28-31 and residues 1 and 20-21. A subset of these correlations have been previously reported.10,13,18,19 We obtained a sufficiently large number of unambiguous restraints that structure calculations generally converged well and clarified the assignment of ambiguous restraints (see SI for complete restraint lists).
Figure 2.

Intermolecular 15N-13C distance restraints observed by TEDOR. The β2’-β3 intermolecular interface of GB1 nanocrystals with intermolecular restraints, with maximum distances of 5, 7 and 8 Å, determined by the TEDOR mixing time at which the peaks were first observed (see SI for details).
We first performed XPLOR-NIH20 calculations consisting of one subsection of the crystal lattice: a central GB1 molecule and all other molecules with a 15N within 8 Å of a 13C of the central GB1. The calculation was performed starting with each crystal form, applying identical restraints. Intermolecular restraints were assigned taking into account the inherent ambiguities; for each peak, all 15N and 13C resonance frequencies within half the peak linewidth were deemed possible assignments. The ambiguous restraints were then formalized in XPLOR-NIH lists (provided in the SI). We then performed the calculation with several different initial conditions, to test the reproducibility of the resulting structure, which converged within 5 Å bbRMSD of the trigonal crystal structure (2QMT), but differed by >13 Å from the orthorhombic structure (2GI9).
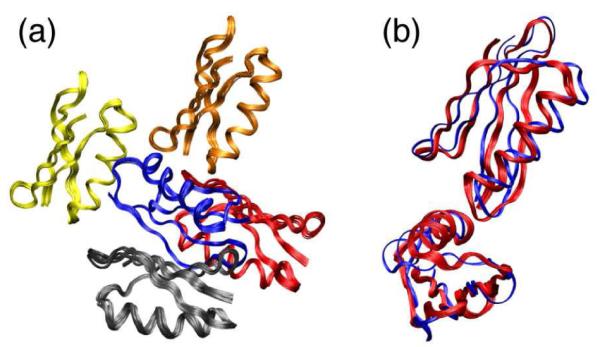
Finally, we performed a calculation starting with five GB1 monomers placed ~20 Å apart (using VMD-XPLOR21) in several, randomly selected orientations. Intermolecular restraints were first applied with internal coordinates of the monomers held constant, allowing the intermolecular TEDOR restraints to dock the peripheral monomers to the central monomer. If docking was successful (as it was in half the cases), the structure was then refined. The resulting quaternary arrangements (Figure 3a) showed high precision (bbRMSD for all 5 monomers of <0.5 Å) and accuracy, based on agreement with trigonal form (Figure 3b). Hence, this is a de novo recreation of the crystal lattice of GB1.
Figure 3.

The crystal packing of GB1 determined by simulated annealing of five GB1 monomers with ambiguous intermolecular TEDOR restraints (pdb ID 2KWD). The bbRMSD of the 10 lowest energy structures (a) is 0.42 ± 0.08 Å. Alignment of the region distinct to the trigonal lattice (b) yields a 2.9 ± 0.1 Å bbRMSD of the ensemble (red) to the 2QMT crystal structure (blue).
In conclusion, we have demonstrated that 3D Z-filtered TEDOR experiments, when performed on mixtures of isotopically labeled protein samples, report on site-specific intermolecular distance restraints. These data sets can be leveraged to perform rigorous structure calculations of the protein interface. In the example demonstrated here, we have determined the packing arrangement of our nanocrystalline GB1 preparation to be consistent with the trigonal form as determined by X-ray diffraction. Therefore this represents an important proof of principle, in a case where the results can be directly compared with other structural information. We envision the application of this approach to determining the registry and quaternary arrangement of protein fibrils, which most often cannot be determined by diffraction methods.
Supplementary Material
ACKNOWLEDGMENT
We thank the National Institues of Health (R01-GM073770, an American Recovery and Reinvestment Act supplement, the Molecular Biophysics Training Program at the University of Illinois) for financial support, Dr. Charles Schwieters for assistance in the application of XPLOR-NIH in multimeric systems, Lindsay Sperling for assistance with recreating crystal lattice coordinates, Damien Mathew for advice in performing VMD scripting, and the School of Chemical Sciences NMR Facility at the University of Illinois.
Footnotes
Supporting Information Available: Materials and Methods, additional spectra, graphical overlays of all structures, calculation statistics, restraint lists. This material is available free of charge via the Internet at http://pubs.acs.org
REFERENCES
- (1).Petkova AT, Leapman RD, Guo ZH, Yau WM, Mattson MP, Tycko R. Science. 2005;307:262. doi: 10.1126/science.1105850. [DOI] [PubMed] [Google Scholar]
- (2).Tycko R. Q. Rev. Biophys. 2006;39:1. doi: 10.1017/S0033583506004173. [DOI] [PubMed] [Google Scholar]
- (3).Helmus JJ, Surewicz K, Nadaud PS, Surewicz WK, Jaroniec CP. Proc. Nat. Acad. Sci. U.S.A. 2008;105:6284. doi: 10.1073/pnas.0711716105. [DOI] [PMC free article] [PubMed] [Google Scholar]
- (4).Wasmer C, Lange A, Van Melckebeke H, Siemer AB, Riek R, Meier BH. Science. 2008;319:1523. doi: 10.1126/science.1151839. [DOI] [PubMed] [Google Scholar]
- (5).Yang J, Tasayco ML, Polenova T. J. Am. Chem. Soc. 2008;130:5798. doi: 10.1021/ja711304e. [DOI] [PubMed] [Google Scholar]
- (6).Etzkorn M, Bockmann A, Lange A, Baldus M. J. Am. Chem. Soc. 2004;126:14746. doi: 10.1021/ja0479181. [DOI] [PubMed] [Google Scholar]
- (7).Gullion T, Schaefer J. J.Magn. Reson. 1989;81:196. [Google Scholar]
- (8).Hing A, Vega S, Schaefer J. J. Magn. Reson. 1992;96:205. [Google Scholar]
- (9).Jaroniec CP, Filip C, Griffin RG. J. Am. Chem. Soc. 2002;124:10728. doi: 10.1021/ja026385y. [DOI] [PubMed] [Google Scholar]
- (10).Nieuwkoop AJ, Wylie BJ, Franks WT, Shah GJ, Rienstra CM. J. Chem. Phys. 2009;131:095101. doi: 10.1063/1.3211103. [DOI] [PMC free article] [PubMed] [Google Scholar]
- (11).Frericks Schmidt HL, Sperling LJ, Gao YG, Wylie BJ, Boettcher JM, Wilson SR, Rienstra CM. J. Phys. Chem. B. 2007;111:14362. doi: 10.1021/jp075531p. [DOI] [PMC free article] [PubMed] [Google Scholar]
- (12).Franks WT, Wylie BJ, Stellfox SA, Rienstra CM. J. Am. Chem. Soc. 2006;128:3154. doi: 10.1021/ja058292x. [DOI] [PubMed] [Google Scholar]
- (13).Franks WT, Wylie BJ, Frericks Schmidt HL, Nieuwkoop AJ, Mayrhofer RM, Shah GJ, Graesser DT, Rienstra CM. Proc. Nat. Acad. Sci. U.S.A. 2008;105:4621. doi: 10.1073/pnas.0712393105. [DOI] [PMC free article] [PubMed] [Google Scholar]
- (14).Wylie BJ, Schwieters CD, Oldfield E, Rienstra CM. J. Am. Chem. Soc. 2009;131:985. doi: 10.1021/ja804041p. [DOI] [PMC free article] [PubMed] [Google Scholar]
- (15).Cornilescu G, Delaglio F, Bax A. J. Biomol. NMR. 1999;13:289. doi: 10.1023/a:1008392405740. [DOI] [PubMed] [Google Scholar]
- (16).Bennett AE, Rienstra CM, Auger M, Lakshmi KV, Griffin RG. J. Chem. Phys. 1995;103:6951. [Google Scholar]
- (17).Franks WT, Zhou DH, Wylie BJ, Money BG, Graesser DT, Frericks HL, Sahota G, Rienstra CM. J. Am. Chem. Soc. 2005;127:12291. doi: 10.1021/ja044497e. [DOI] [PubMed] [Google Scholar]
- (18).Helmus JJ, Nadaud PS, Hofer N, Jaroniec CP. J. Chem. Phys. 2008;128:052314. doi: 10.1063/1.2817638. [DOI] [PubMed] [Google Scholar]
- (19).Peng XH, Libich D, Janik R, Harauz G, Ladizhansky V. J. Am. Chem. Soc. 2008;130:359. doi: 10.1021/ja076658v. [DOI] [PubMed] [Google Scholar]
- (20).Schwieters CD, Kuszewski JJ, Tjandra N, Clore GM. J. Magn. Reson. 2003;160:65. doi: 10.1016/s1090-7807(02)00014-9. [DOI] [PubMed] [Google Scholar]
- (21).Schwieters CD, Clore GM. J. Magn. Reson. 2001;149:239. doi: 10.1006/jmre.2001.2300. [DOI] [PubMed] [Google Scholar]
Associated Data
This section collects any data citations, data availability statements, or supplementary materials included in this article.


