

Abstract
Cell-mediated compaction of the extracellular matrix (ECM) plays a critical role in tissue engineering, wound healing, embryonic development, and many disease states. The ECM is compacted as a result of cellular traction forces. We hypothesize that a cell mechanically remodels the nearby ECM until some target conditions are obtained, and then the cell stops compacting. A key feature of this hypothesis is that ECM compaction primarily occurs in the pericellular region and the properties of the ECM in the pericellular region govern cellular force generation. We developed a mathematical model to describe the amount of macroscopic compaction of cell-populated collagen gels in terms of the initial cell and collagen densities, as well as the final conditions of the pericellular environment (defined as the pericellular volume where the collagen is compacted (V∗) and the mass of collagen within this volume (m∗)). This model qualitatively predicts the effects of varying initial cell and collagen concentrations on the extent of gel compaction, and by fitting V∗ and m∗, provides reasonable quantitative agreement with the extent of gel compaction observed in experiments with endothelial cells and fibroblasts. Microscopic analysis of compacted gels supports the assumption that collagen compaction occurs primarily in the pericellular environment.
Introduction
Cell-mediated compaction of the extracellular matrix (ECM) is a critical component of the wound-healing process (1,2), engineering of tissue equivalents (3,4), embryonic development (5), and fibrotic disease states (6,7). The primary driving force of ECM compaction during wound healing is traction force exerted by fibroblasts and myofibroblasts at the site of injury (2,8–10). The strength of these forces is affected by the presence of local soluble factors, as seen in the changes that occur as wound healing progresses (6). A number of studies have utilized cell-mediated compaction of collagen gels to investigate the mechanisms and mechanics that regulate ECM compaction (7–10).
In a general sense, a cell-populated gel compacts because the gel is not in mechanical equilibrium. If the traction forces exerted by the cells are greater than the elastic forces the ECM mesh can resist, the gel will begin to compact. Gel compaction stops when the cell-derived traction is counterbalanced by the resisting elastic force in the ECM. As the gel is compacted, it is deformed from its initial zero stress state and the elastic modulus of the gel increases. Thus, a reasonable initial hypothesis is that cell traction remains approximately constant, and the resisting elastic force in the ECM increases until it balances the cell traction. However, early quantitative models of cell-mediated compaction of a viscoelastic ECM gel based on these assumptions do not fit the available experimental data (7). It has been proposed that agreement with experimental data could be improved if cell traction decreased as the gels compacted (7), which raises the natural question as to what signal is instructing cells to reduce their traction. Later models have improved agreement with experimental data by introducing terms that decreased traction as cell density increases, a phenomenon dubbed “contact inhibition of force generation” (11).
Here we explore an alternative explanation for the reduction in cell traction. This explanation stems from a conceptually different approach to considering cell-populated gels. Instead of treating the cells as a continuous phase, as done previously by Barocas and Tranquillo (11), we considered the cells as discrete entities. We propose that rather than sensing average properties of the ECM gel, such as regional cellular concentration or ECM density, the cells sense changes in their local pericellular environment. We further propose that when the ECM density within a defined volume around a cell reaches a specific target value, the cell stops compaction of the ECM to maintain this target pericellular condition. We developed a mathematical representation of this conceptual model to predict the gel compaction in terms of the volume of the pericellular environment and the concentration of collagen within this volume given the initial collagen and cell densities. The validity of this model was assessed based on its ability to predict the extent of macroscopic gel compaction by human umbilical vein endothelial cells (HUVECs) and NIH 3T3 fibroblasts, as well as by independent microscopic assessment of the final pericellular conditions. Fibroblasts were selected for these studies based on their prevalence in in vitro studies of cell-mediated collagen compaction and their aforementioned involvement in important in vivo processes. Endothelial cells were selected as an additional cell type because they have been shown to compact collagen gels during microvascular network formation, with the degree of compaction correlating with the extent of network formation (12–15).
Materials and Methods
Information on the processes used for cell culture, collagen gel formation, and macroscopic measurement of gel contraction can be found in the Supporting Material.
Cell death assay
At the end of each experiment, gels were fixed in formalin overnight, dehydrated, embedded in paraffin, cut into 8-μm-thick histological sections, and mounted on glass slides. HUVECs and NIH 3T3 fibroblasts grown on tissue culture-treated plastic and harvested while subconfluent were fixed in formalin overnight and used as a comparison for the cell death assay. The terminal deoxynucleotidyl transferase dUTP nick end labeling (TUNEL) in situ cell death detection kit (Roche Applied Science, Indianapolis, IN) was used as directed for the cell death assay. Eosin was used as a counterstain so that the total number of cells could be counted. The number of TUNEL-positive cells and the total number of cells were quantified and used to calculate the percentage of cell apoptosis. As an alternate method, a trypan blue assay was performed to assess cell death. The protocol of Woodley et al. (16) was used with a modification. Briefly, compacted gels were exposed to 0.05% trypsin-EDTA (Invitrogen) for 10 min at 37°C. Collagenase A (Roche) was suspended in Dulbecco's phosphate-buffered saline (Invitrogen), and 300 μL per 1 mL trypsin-EDTA were added to digest the compacted collagen gel. Isolated cells were centrifuged, washed, mixed 1:1 with trypan blue (Invitrogen), and mounted on a slide for counting.
Calculation of average cell traction from macroscopic compaction data
The anisotropic biphasic theory (ABT) of tissue-equivalent mechanics (11) was used to determine the traction parameter (stress generated per million cells) over time for each experiment. The traction stress was equated with the viscoelastic stress in the collagen gel since the two must balance in a free-floating gel. The resulting equation was solved numerically to determine the traction stress at each time point in the experiment. Details are given in the Appendix.
Confocal microscopy and image analysis of cells and collagen
For microscopic analysis, HUVECs in 2 mg/mL collagen gels with an initial cell concentration of 1 × 10⁶ cells/mL were fixed and stained with TRITC-phalloidin (Invitrogen) and DAPI (Invitrogen). Z-stacks of cells within collagen gels were obtained with a 63X oil objective on a Leica SP5 confocal microscope (Leica Microsystems, Wetzlar, Germany), and collagen fibers were imaged in reflection mode using the 488 nm laser. Because different signal/noise ratios were present in the original images, imaging gain and offset settings were optimized for each condition. Stacks of images were processed and quantified using a script written in MATLAB (The MathWorks, Natick, MA). Phalloidin staining for actin was used to define the cell regions. Specifically, Sobel edge detection was used to identify cell regions within each slice. Border dilation and hole filling were then used to select the cell body from the remainder of the field. Confocal imaging artifacts were removed from the collagen reflection images by subtracting an image of a blank sample. An eight-pixel median filter, corresponding to a 2.26 μm × 2.26 μm region, was applied to each slice to remove noise and smooth the collagen fibers. The range of pixel intensities was then subdivided into seven different intensity levels, represented by different gray tones, to provide a spatial contour map of relative collagen concentrations. Defined cell regions were then overlaid onto the processed collagen images, creating the final composites. Although the image processing does not enable absolute quantitative comparison between different images, it does allow for comparison between regions within each image.
Modeling and statistical analysis
Experimental data were fitted to the model by linear regression in the SPSS statistical package (SPSS, Chicago, IL) with the y-intercept set to zero to obtain values of model parameters for each experiment. SPSS was also used to determine whether there was a significant difference between coefficients of different experiments using a t-test. Statistical significance was defined as p < 0.05.
Results
Initial experiments are presented to highlight the limitations of existing models and the effects of cell concentration and collagen density on compaction. The new conceptual model is then presented to account for these effects, and evaluated by further experiments.
Gel compaction is a function of initial, but not final, cell concentration and collagen density
Preliminary experiments in which we investigated the compaction of a collagen gel by HUVECs indicated that gel contraction occurs in the first 48–96 h, and thereafter additional gel compaction ceases (Fig. 1, A and B). Based on these initial experiments, we chose to run our subsequent HUVEC gel compaction experiments for 48 h. As the initial cell density increased, at constant initial collagen concentration, collagen gel compaction at 48 h at first increased and then asymptotically approached one, a condition corresponding to a gel with zero volume (Fig. 1 C). When the cell number was held constant, gel compaction was inversely related to the initial collagen concentration (Fig. 1 D). We calculated cell traction from the gel compaction time course data using the ABT (11). After the first day, total cell traction decreased monotonically with time, regardless of the initial cell density, and traction decreased to zero after 120 h of culture (Fig. 2 A). A comparison of the calculated traction per cell for gels with different initial cell densities shows that the total cell traction was directly proportional to the number of cells (Fig. 2 B). The time course of the traction per cell (from the slopes in Fig. 2, B and C) follows the same trend as the total cell traction over time.
Figure 1.
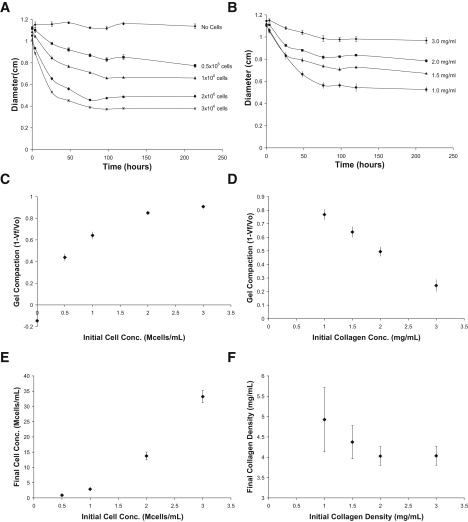
Endothelial cell-mediated compaction of collagen gels. (A) Time course data with constant initial collagen density (1.5 mg/mL) and varying number of HUVECs. (B) Time course data with constant initial HUVEC density (1 million cells/mL) and varying initial collagen density. (C–F) Investigation of compaction trends with data at 48 h. (C) At constant initial collagen density, gel compaction increases linearly, with increasing initial cell density at first, and then approaches one asymptotically. (D) At constant initial cell density, gel compaction is inversely related to initial collagen concentration. (E) Final cell density is directly related to initial cell density when initial collagen density is held constant. (F) Final collagen density is inversely related to initial collagen density when initial cell density is held constant. For all panels, n = 4–6 gels per point.
Figure 2.
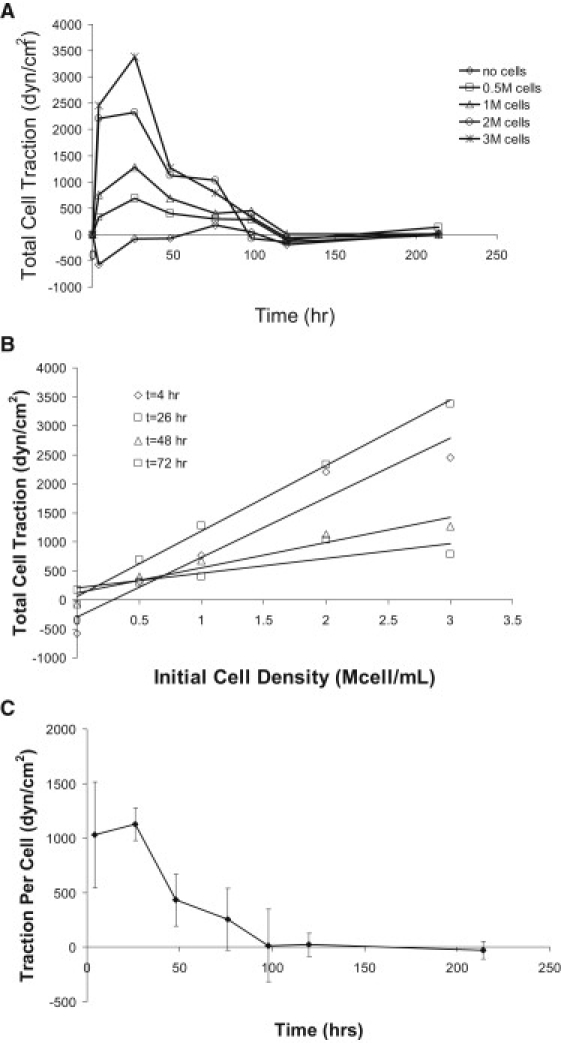
Cell traction time courses. (A) Calculated endothelial cell traction force as a function of time using the time course data from Fig. 1, A and B, and calculated using ABT of tissue-equivalent mechanics. As compaction ends, total cell traction forces are reduced to zero. (B) An increase in cell number yields higher total cell traction while the gel is compacting. (C) Traction force per cell decreases with time and is reduced to zero when compaction is complete.
One possible explanation for this is that the decrease in cell traction with time is due to the death of cells in the collagen gel. Consistent with previous reports (17,18), apoptosis rates measured by the TUNEL assay for cells in collagen gels were relatively low (1.4% ± 0.2% for fibroblasts after 96 h in the gel and 10.4% ± 1.5% for HUVECs after 48 h) but greater than those for the corresponding cells grown on tissue culture-treated plastic (0.09% ± 0.04% and 0.15% ± 0.08% for NIH 3T3 fibroblasts and HUVECs, respectively). The use of a trypan blue assay resulted in slightly increased rates of cell death compared to the TUNEL assay (5.3% ± 0.4% and 17.3% ± 1.4% for NIH 3T3 fibroblasts and HUVECs, respectively). Since both fibroblast- and endothelial cell- populated gels showed dramatically reduced compaction after 96 h, while exhibiting only small (∼1–5%) to modest (∼10–17%) levels of apoptosis for NIH 3T3 fibroblasts and HUVECs, respectively, cell death is unlikely to account for the decrease in cell traction. These viability data suggest that cells down-regulate their traction in response to some signal. This signal is highly unlikely to be a target final cell density, since changing the initial cell density while holding the initial collagen density constant results in a wide range of final cell densities (Fig. 1 E). Similarly, the signal does not appear to be a target bulk collagen density, because the final collagen density varies for gels with a constant initial cell density and varying initial collagen densities (Fig. 1 F). Of interest, there is an inverse relationship between the initial collagen concentration and the final collagen concentration (i.e., the greater the initial collagen concentration, the smaller is the final collagen concentration after the gels stop compacting) when the initial cell concentration is held constant (Fig. 1 F). This counterintuitive relationship between the initial and final collagen concentrations has been observed by others in fibroblast-populated gels (19,20), and is not found in continuum-based models of cell compaction, as highlighted later in the Results.
Model development and analysis
Instead of focusing on the average properties of the gels, we propose that the signal to stop cell-mediated compaction is a target pericellular collagen density within a specific volume around each cell. This assertion is motivated in part by observations that the local collagen density around fibroblasts in compacted gels is greater than the collagen density in a region farther from the cell (12). To gain insight into cell-mediated compaction, we developed a mathematical model of the compaction of a collagen gel. The model assumes the total volume of the collagen gel consists of pericellular volumes that undergo compaction, and the collagen outside of these volumes, which does not get compacted (Fig. 3). The volume occupied by cells is considered negligible in this model. This situation is described by Eq. 1:
| (1) |
where Vf is the total final volume, Vc is the total of the pericellular volumes that are compacted, and Vu is the volume of collagen that is unaffected by the cells.
Figure 3.
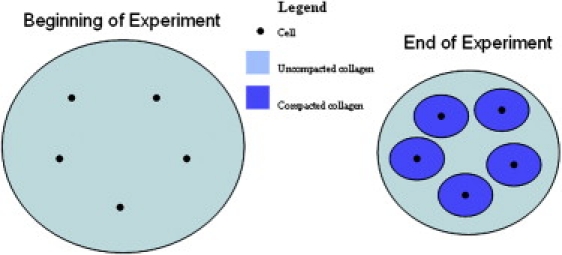
Depiction of collagen compaction on a pericellular level. Only the collagen within a defined volume around each cell is compacted and the remaining collagen is unaffected.
The total pericellular volumes can be represented in terms of the number of cells, N, and the volume of compacted collagen around each cell, V∗. The volume of unaffected collagen can be represented in terms of the original mass of collagen, mo; the number of cells; the mass of collagen that is compacted in the pericellular volumes, m∗; and the initial collagen density, ρo. Substitution of these relationships into Eq. 1 yields Eq. 2:
| (2) |
The initial gel volume, Vo, can be substituted for mo/ρo. Recognizing that co is equivalent to N/Vo and rearranging Eq. 2 yields an equation in which the fraction of the volume compaction, θ, of a collagen gel is a function of m∗ and V∗ (Eq. 3). The fraction of the volume compaction will be between 0 and 1, where 0 signifies the same initial and final volumes (no compaction), and 1 signifies the compaction of the gel to a point where the volume is zero:
| (3) |
Eq. 3 correctly predicts that the extent of gel compaction will linearly increase with increasing initial cell density, with the slope of this relationship equal to m∗/ρo − V∗. The quantity m∗/ρo − V∗ is always positive because m∗/ρo is the volume occupied by m∗ before it is compacted and V∗ is the volume occupied by m∗ after compaction. Eq. 3 also correctly predicts that as ρo increases, the extent of gel compaction will decrease. Experiments presented below will be used to highlight the relationships among co, ρo, and θ that are in Eq. 3. One can imagine a number of other simple models that might correctly predict the dependence of gel compaction on initial cell and collagen concentrations. A more stringent test of the descriptive power of the mathematical model is whether it can correctly predict the counterintuitive relationship observed between the initial and final collagen densities (Fig. 1 F). We note that the final collagen concentration, ρf, is given by
| (4) |
Then, substituting for θ in Eq. 3 and differentiation with respect to ρo gives Eq. 5:
| (5) |
Since the denominator is always positive, the sign of dρf/dρo is negative when (1+V∗co)ρo < 2m∗co. Thus, Eq. 5 predicts that the final concentration of the gel can either increase or decrease with increasing initial collagen density depending on the values of m∗ V∗, co, and ρo. For example, when co or m∗ is small (i.e., there are very few cells or each cell compacts only a negligible amount of collagen), the presence of the cells would have a minimal impact on the collagen gel and the final collagen density would increase with increasing initial collagen density. In contrast, when ρo is small, the effect of a given number of cells that compact a given mass of collagen is greater, thus opening the possibility of decreasing ρo leading to a greater ρf. Although Eq. 5 provides insights into the effects of specific variable and parameter values on the sign of dρf/dρo, with no knowledge of the values of m∗, V∗, co, and ρo, it is not directly evident when examining a single condition (e.g., Fig. 1 F) whether increasing ρo would increase or decrease ρf. Expressing dρf/dρo in terms of θ,
| (6) |
allows for more direct evaluation.
If m∗/ρo >> V∗, then Eq. 3 reduces to θ = m∗co/ρo and Eq. 6 can be expressed explicitly in terms of θ:
| (7) |
This condition is equivalent to ρ∗ >> ρo. Published values indicate that ρ∗ is about five times greater than ρo (12,13), suggesting that Eq. 7 can serve as a reasonable first approximation. Thus, Eq. 7 predicts that dρf/dρo should be negative when θ ≥ ∼0.5 regardless of the specific values of m∗, V∗, co, and ρo. Consistent with this prediction, in the experiment where Δρf/Δρo was negative (Fig. 1 F), θ ranged from ∼0.5 to ∼1.
Experimental assessment of model
To investigate the ability of the model to quantitatively predict the effects of initial cell and collagen concentrations on macroscopic gel compaction, we carried out additional experiments. These experiments focused on values of θ ranging from 0 to ∼0.65, which are lower than those used in the preliminary studies shown in Fig. 1, because this leads to a linear relationship between θ and co (Eq. 3 and Fig. 1 C). Values of co and ρo were chosen based on preliminary data (Fig. 1) to achieve the target range of compaction. As observed in the previous experiments (Fig. 1), gel compaction increased with increasing initial cell number and decreased with increasing initial collagen density, and the final cell density was directly related to the initial cell density (Fig. 4, A–C). For each experiment, the parameters m∗ and V∗ were obtained by multiple linear regression in SPSS with the y-intercept set to zero to reflect the model (Eq. 3).
Figure 4.
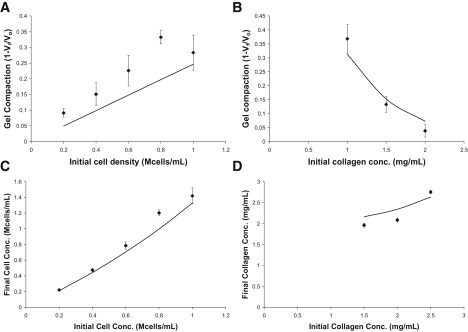
Comparison of HUVEC experimental and model predictions (solid lines). (A) An increase in initial cell density at constant initial collagen density results in increased compaction. (B) An increase in initial collagen density at constant initial cell density results in a decrease in compaction. (C) An increase in initial cell density results in an increase in final cell density at constant initial collagen density. (D) An increase in initial collagen density results in an increase in final collagen density at constant initial cell density. For all panels, n = 4–6. Solid lines are model trends using the fit parameters from Table 1.
The lower ranges of compaction in these experiments also allowed us to explore whether Δρf/Δρo is positive when θ < ∼0.5, as predicted by Eq. 7. In the earlier experiment, particularly for θ > 0.5, increasing initial collagen density resulted in a decrease in final collagen density, i.e., Δρf/Δρo was negative (Fig. 1 F). In contrast, for the lower θ values explored here, an increase in initial collagen density resulted in an increase in final collagen density at constant initial cell density, i.e., Δρf/Δρo was positive (Fig. 4 D). The fact that the observed Δρf/Δρo is positive in Fig. 4 D, where the extent of gel compaction is <0.5, is consistent with the prediction of Eq. 7.
To further explore the predictive power of Eq. 7, values for Δρf/Δρo were obtained for all experiments in which the initial cell density was held constant for two or more initial collagen densities, as detailed in the legend to Fig. 5 (also see Figs. 1 and 6). The calculated values for Δρf/Δρo were compared with the model prediction and the prediction of a continuum-based model outlined in the Supporting Material. Our experimental data follow the trend of positive values for Δρf/Δρo at low θ and negative values for Δρf/Δρo as θ is increased (Fig. 5 A). To further assess the ability of the model to predict experimental results, we converted data from five published studies (14,15,19–21) that investigated compaction of collagen gels with varying initial collagen density and constant initial cell density to θ-values to calculate Δρf/Δρo (Fig. 5 B). In agreement with the experimental data from our studies, the model captures the trend of decreasing Δρf/Δρo as gel compaction increases. Showing an opposite trend, the continuum-based model prediction of Δρf/Δρo increases as gel compaction increases.
Figure 5.
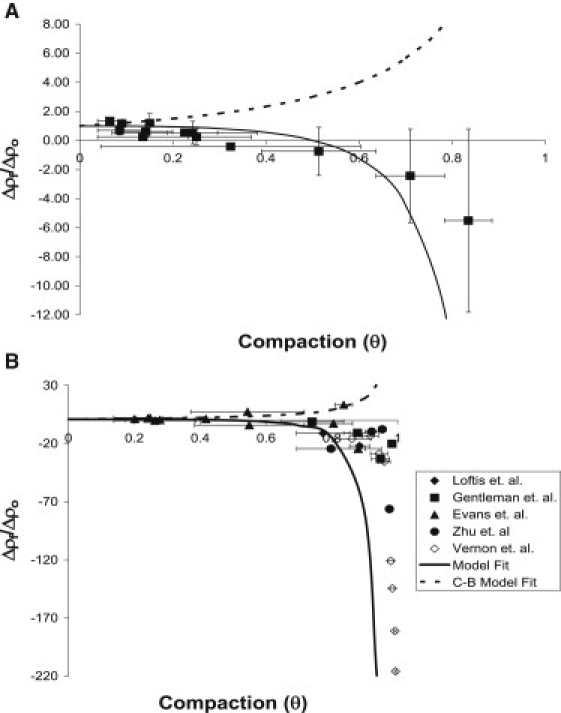
Investigation of the change in Δρf/Δρo as gel compaction varies. (A) Values for Δρf/Δρo were obtained for all experiments shown in Figs. 1 and 4, as well as additional independent experiments summarized in Table 1, where initial cell density was held constant for two or more initial collagen densities. Each experimental condition yields an average final collagen concentration (ρf) for the gel by using the compaction data and Eq. 4. Two conditions with the same initial cell density and different initial collagen densities (ρo) can be used to calculate the average final collagen concentration (ρf) at each condition and thus determine Δρf/Δρo. In cases where more than two initial collagen densities had the same initial cell density, consecutive collagen densities were used (e.g., for three different initial collagen densities, low-medium and medium-high densities were paired to obtain two values for Δρf/Δρo). For each Δρf/Δρo, the average θ of the two experiments was used, with the horizontal error bar representing the range of the two θ values. The vertical Δρf/Δρo error bar was calculated using propagation of error from the ρf of each condition. The ρf of each individual gel was calculated and the average ± standard deviation of all the gels at each condition was used to determine the Δρf/Δρo value and the error bar. The solid line represents the model-predicted values of Δρf/Δρo. The dotted line represents the continuum-based (C-B) model-predicted values of Δρf/Δρo. (B) Data from other groups (14,15,19–21) that investigated compaction of collagen gels compared with the model prediction. The horizontal θ error bar was calculated as before. Since the ρf for each individual gel was not available, vertical error bars for Δρf/Δρo could not be calculated.
Figure 6.
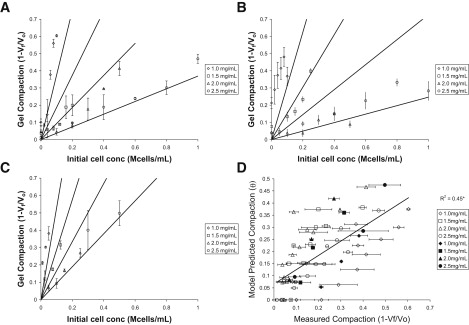
Results of modeling experimental data. Solid lines are model predictions for each of the four initial collagen concentrations used. (A) HUVEC experiment 1 (n = 48), (B) HUVEC experiment 2 (n = 96), and (C) NIH 3T3 fibroblast experiment (n = 24). (D) Analysis of model fit using all three experiments; open symbols are HUVEC, solid symbols are NIH 3T3 fibroblasts, and error bars are the mean ± standard error (n = 168; ∗p < 0.005).
To further explore the applicability and robustness of the model for a wider range of conditions, we conducted two additional experiments with HUVECs and one with NIH 3T3 fibroblasts. Consistent with the prediction of Eq. 3, there was a linear relationship between the initial cell density and the experimentally observed compaction (θ) for multiple experiments (Fig. 6, A–C). Data for the HUVEC and fibroblast experiments are plotted in Fig. 6, A–C, with the solid lines showing the model predictions based on the fitted m∗ and V∗. Fit parameters for this data set are shown in Table 1. The predicted compaction from all three experiments is plotted against the observed compaction for each gel as an overall assessment of the ability of the model to predict the gel compaction (Fig. 6 D). The model consistently underpredicts compaction for 1.0 mg/mL gels and overpredicts compaction for 1.5 and 2.0 mg/mL gels (Fig. 6 D). These over- and underpredictions may be due to the limitations of the model as presented in the Discussion; in particular, neighboring cells may compact collagen differently compared to cells that are far apart.
Table 1.
Compaction model parameters
| Cell line | No. of gels | m∗ (ng/cell) | V∗ (106μm3/cell) | ρ∗ (mg/mL) | R2 |
|---|---|---|---|---|---|
| HUVEC (trial 1) | 48 | 5.63 ± 1.27 | 1.88 ± 0.56 | 2.99 ± 1.12 | 0.82 |
| HUVEC (trial 2) | 96 | 4.80 ± 1.09∗ | 1.67 ± 0.48 | 2.87 ± 1.05 | 0.64 |
| NIH 3T3 fibroblasts | 24 | 7.24 ± 2.89∗ | 1.95 ± 1.28 | 3.71 ± 2.85 | 0.86 |
Calculated parameters from two trials using HUVECs and one trial using NIH 3T3 fibroblasts (± 95% confidence interval; ∗p < 0.05).
Confocal microscopy allowed for visualization of cells and collagen fibers within gels (Fig. 7, A–F). Actin fibers were visualized in an area of the gel with no cells, a single cell, and two cells (Fig. 7, A–C). In cell-free regions of a gel imaged shortly after it was formed, collagen fibers are randomly orientated and evenly distributed across the field of view (Fig. 7 D). After 48 h, the collagen fibers are thinner and shorter than those at the initial time point (Fig. 7 E). These changes in the collagen fibers are cell-dependent and do not occur in cell-free collagen gels (not shown). Of importance, based on visual inspection, the collagen appears to be more concentrated in the pericellular region of compacted gels (Fig. 7, E and F).
Figure 7.
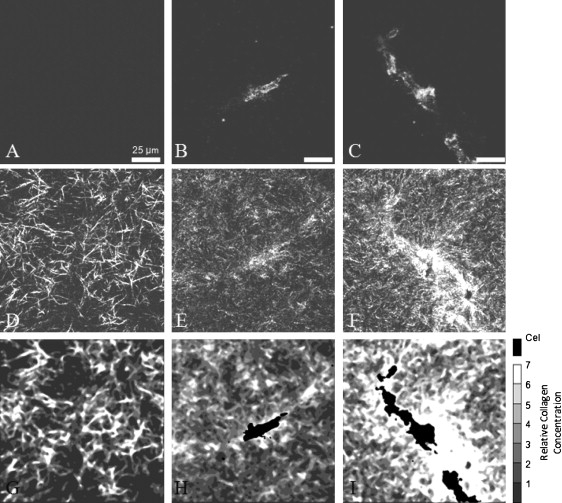
Raw and processed images of 2.0 mg/mL gels seeded with 1 × 10⁶ HUVEC/mL. Each column is the same field of view representing three conditions: no cells (A, D, and G), a single cell (B, E, and H), and two cells (C, F, and I). Processing of fluorescently imaged actin (A–C) and collagen fibers visualized by reflection (D–F) was performed to obtain spatial information about relative collagen concentration (G and I). (G) A typical acellular region shortly after gel formation shows collagen distribution before compaction. (H) Individual cells compacted collagen after 48 h within the pericellular region. Compacted collagen away from identified cell regions can be attributed to vertically distributed cells within the 3D gel. (I) Colocalized cells jointly compacted collagen after 48 h, resulting in high collagen concentrations between cells.
Image analysis was conducted to estimate the relative collagen concentrations. This analysis, based on the observation that image intensity increases with collagen concentration (9,22,23), further confirms that collagen is concentrated in the pericellular region after 48 h (Fig. 7 H). An inspection of confocal planes (in the z-dimension) adjacent to the ones shown in Fig. 7, E and F, reveals the presences of cells close to, but not in, the specific confocal planes shown. These adjacent confocal planes reveal that the band of dense collagen extending from the bottom left to the top right corner is closely associated with cells in the adjacent focal planes. Furthermore, regions of concentrated collagen that are visible in Fig. 7 H but not near the visible cell are associated with the cells seen in the adjacent focal planes that lie in that region. Thus, the regions of concentrated collagen far from the visible cell are likely not due to the far-reaching influence of the visible cell; rather, they are influenced by other cells that are out of the specific plane of view. Multicellular structures often formed, particularly in HUVEC cultures, as revealed by DAPI staining (not shown). When multiple cells were colocalized, they jointly remodeled intersecting pericellular volumes (Fig. 7 I), compacting the shared volume more than neighboring matrix regions that were primarily under the influence of a single cell.
Discussion
A mathematical model was developed to characterize collagen gel compaction based on the following assumptions: 1), collagen is compacted and will increase in concentration within a certain volume around each cell; 2), the collagen concentration will remain constant outside this volume; and 3), once a target pericellular collagen density is reached, gel compaction stops. This model qualitatively predicts the effects of varying initial cell and collagen concentrations on the extent of gel compaction, and, by fitting two free parameters, provides reasonable quantitative agreement with the experimental data. Assumption 1 is well supported by our direct observation of collagen densities around endothelial cells and fibroblasts, as well as earlier microscopic observations of cells in collagen gels (12,24–26). In support of assumption 2 is the microscopic observation that collagen concentration appeared unchanged at a distance greater than scores of microns from fibroblasts cultured within collagen gels (12).
In contrast to assumptions 1 and 2, there is no direct observation supporting assumption 3, but there are several lines of indirect support. The values for cell traction calculated from our time course data using the ABT indicate that cell traction dramatically decreases around the same time that the rate of macroscopic gel compaction decreases. If cell traction does decrease when a target pericellular collagen concentration is achieved, a natural question is, how do the cells sense this target pericellular collagen concentration? Yamato et al. (12) observed that fibroblasts showed increasing pericellular collagen concentrations over time along with a simultaneous decrease in the frequency of pseudopodia formation. They speculated that the high concentrations of collagen adjacent to the cell might promote such strong adhesion forces that further pseudopodia formation would be reduced, leading to decreased cell traction.
Alternatively, cells may not directly sense the collagen concentration, but may respond to a parameter that correlates with collagen density, such as matrix stiffness, pore size, porosity, or diffusivity. For example, increased collagen concentration near cells likely corresponds to increased matrix stiffness. It is unclear, however, whether this increase in matrix stiffness would trigger decreased cell traction, for others have shown that increasing matrix stiffness increases the traction forces exerted by the cells coated on top of 2D surfaces (27) or within collagen gels (28). Increased cell traction in stiffer 3D gels is consistent with our previous observation of more prominent actin stress fibers in HUVECs in stiffer collagen gel (29), although others have reported that traction forces of cells in at least one 3D matrix did not change with matrix stiffness (30). Alternatively, decreased cellular traction may result from decreased transport of soluble molecules due to a change in the diffusivity of the pericellular environment. Consistent with this view, a recent article reported that increasing fibrin concentration fourfold impaired endothelial cell outgrowth while decreasing the diffusion of a protein-sized molecule by two- to threefold (31). Increasing the bulk concentration of collagen gels from 1 to 3 mg/mL decreases the diffusion of a 70 kDa protein by <30% (32). It is unclear whether this relatively small change in diffusion could cause cells to decrease force generation.
An alternative possibility is that assumption 3 as stated above is incorrect. It is possible that the cells continue to generate significant forces throughout the duration of the culture period. This continuous cell traction would be in contradiction to our simulation results obtained using the ABT (Fig. 2). It should be noted, however, that the ABT treats both the cells and collagen concentration as continuous, purely macroscopic variables; thus, the theory contains no mechanism to consider an elevated pericellular collagen concentration. An untested possibility is that as the cells concentrate collagen in the pericellular volume and thereby increase the local matrix stiffness, their ability to transmit forces to collagen outside of the compacted volume is impaired. Regardless of whether the reduced cell traction is real, as speculated by Yamato et al. (12), or is the result of the stiffer pericellular matrix blocking force transmission to the uncompacted volume, in either case the effective cell traction on the matrix farther away from the cells decreases dramatically.
Although the mathematical model both qualitatively and quantitatively describes the experimental data, it is not without limitations. First, it is based on a very simple conceptual model (Fig. 3) that neglects many aspects of the real system. For example, the conceptual model divides the gel into two homogeneous volumes of compacted and uncompacted collagen without attempting to consider the gradient of collagen density observed microscopically in the pericellular compacted region (Fig. 7). In addition, the model ignores any effects due to preferential fiber alignment, which were also observed microscopically. There is also no accounting for local synthesis, degradation, or cross-linking of the collagen, which could be significant very close to the cell even if negligible on the macroscopic scale.
A second major limitation of the model is that each cell is in isolation and has access to enough collagen to accumulate m∗ in the pericellular region. This condition is not met when ρo/co < m∗, which makes the first term of Eq. 3 greater than one and permits θ > 1, corresponding to a physically impossible negative final volume. To avoid this unrealistic result, we chose to conduct experiments in which there was ample collagen for each cell to compact as much collagen as desired (ρo/co >> m∗). This condition also corresponded to lower values of compaction (i.e., θ ≤ 0.65) where the relationship between θ and co is linear (e.g., Fig. 6, A–C). An alternative approach, not explored here, would be to develop an understanding of how a region of collagen gel is redistributed when two or more cells are competing for it. Such an understanding would enable the development of more realistic conceptual and mathematical models to describe gels experiencing greater compaction. It should be noted that even in cases where cells are competing for a region of collagen (e.g., the aligned collagen fibers between the cells in Fig. 7, F and I), there are still regions near the cells with increased collagen density and regions farther from the cells that appear to have changed little compared to the initial collagen concentration, which is consistent with the underlying assumptions of our conceptual model. Also, the degree of compaction shown in Fig. 7 appears to be many-fold, in contrast to our values for ρ∗, which are ∼20–350% greater than ρo. This may be because the boundary of compacted collagen is not sharp and our values of V∗ may be overestimated, resulting in an average ρ∗ that is smaller than what is observed near a cell. This may be true, since assuming a spherical area of compaction around a cell would result in a radius of ∼75 μm for the region of compaction. This area in Fig. 7, E and F, would result in a circle that lies just outside of the pictures shown, which may on average include a larger area than is actually compacted.
Despite the fact that this initial model contains simplifying assumptions (e.g., gradients in the collagen concentration are ignored), which likely limits the accuracy of the quantitative predictions, this model accurately captures qualitative behaviors (e.g., the negative correlation between initial and final collagen concentrations) that are not captured by other more complex models, including the ABT. Thus, the conceptual model presented here, which treats cells as discrete entities that respond to their pericellular environment, offers an attractive starting point for the development of more sophisticated mathematical models that will be able to address some of the features it does not consider.
Appendix: Calculation of Cell Traction
For the analysis, we make certain simplifications of the full ABT (11) in light of the experimental conditions:
Resistance to interstitial flow is neglected because of the relatively small size of the sample. For collagen gels, the relevant dimensionless parameter is h2σ0ϕ0 / Gμ, where σ0 is a representative cell traction stress (∼1000 dyn/cm2), ϕ0 is the interstitial drag coefficient (∼6.4 × 10⁶ dyn · s/cm4 (33),), G and μ are the viscoelastic constants for the gel (11,850 dyn/cm2 and 1.24 × 10⁸ dyn · s/cm2 (33)), and h is the gel thickness (1/16″ = 0.16 cm). For our system, then, h2σ0ϕ0 / Gμ ∼10−4, a very small value.
Motivated by the previous assumption, the initial homogeneity and anisotropy of the construct, and the absence of external constraints, compaction is assumed to be homogeneous and uniform.
Under these assumptions, the viscoelastic stress in the collagen network must be exactly balanced by the cell traction stress, so the traction stress can be estimated by calculating the viscoelastic stress in the network. We assume that throughout the compaction, the gel remains an axisymmetric disc, with a constant ratio of height to radius, and that the velocity field is assumed as
where R(t) is the radius of the sample, is its time derivative, and r and z are the directional coordinates. For the compressible upper-convected Maxwell fluid model, which was previously demonstrated to be applicable to collagen gels (7), the constitutive equation is
For homogeneous compaction, we expect the stress tensor σ to take the form σ(t) = σI, where I is the identity tensor. Substituting this, together with the assumed form of the velocity field given above, into the constitutive law yields
Rearranging gives
At this point, the equations are discretized using backward differences for the derivatives of R and σ, and midpoint (trapezoid rule) approximations for the values of R and σ, leading to the following expression,
where i = 0,1, 2…., ti = i Δt (where Δt is the time step), and Ri = R(ti), etc. The above can be rearranged to give
This allows us to compute the stress in the gel at any time during the compaction, given knowledge of the initial stress (σ(0)), the radius of the gel (R(t)), and the parameters G, μ (both given above), and ν = 0.2 (7). The time steps used were dependent on the time points for which data were available (Fig. 1, A and B), i.e., 0, 4 26, 48, 76, 98, 120, and 214 h.
Supporting Material
Methods and materials are available at http://www.biophysj.org/biophysj/supplemental/S0006-3495(10)00374-7.
Supporting Material
Acknowledgments
This work was supported in part by a National Institutes of Health grant (EB005813) to V.B., an American Heart Association grant (0655323B) and National Science Foundation grant (CMMI-0928739) to K.J.G., and a Major Research Instrumentation grant for confocal microscopy (0619373) to A.L.S.
References
- 1.Abercrombie M., Flint M.H., James D.W. Wound contraction in relation to collagen formation in scorbutic guinea-pigs. J. Embryol. Exp. Morphol. 1956;4:167–175. [Google Scholar]
- 2.Gabbiani G., Hirschel B.J., Majno G. Granulation tissue as a contractile organ. A study of structure and function. J. Exp. Med. 1972;135:719–734. doi: 10.1084/jem.135.4.719. [DOI] [PMC free article] [PubMed] [Google Scholar]
- 3.Weinberg C.B., Bell E. A blood vessel model constructed from collagen and cultured vascular cells. Science. 1986;231:397–400. doi: 10.1126/science.2934816. [DOI] [PubMed] [Google Scholar]
- 4.Bell E., Ehrlich H.P., Nakatsuji T. Living tissue formed in vitro and accepted as skin-equivalent tissue of full thickness. Science. 1981;211:1052–1054. doi: 10.1126/science.7008197. [DOI] [PubMed] [Google Scholar]
- 5.Doljanski F. The sculpturing role of fibroblast-like cells in morphogenesis. Perspect. Biol. Med. 2004;47:339–356. doi: 10.1353/pbm.2004.0048. [DOI] [PubMed] [Google Scholar]
- 6.Enever P.A.J., Shreiber D.I., Tranquillo R.T. A novel implantable collagen gel assay for fibroblast traction and proliferation during wound healing. J. Surg. Res. 2002;105:160–172. doi: 10.1006/jsre.2002.6372. [DOI] [PubMed] [Google Scholar]
- 7.Barocas V.H., Moon A.G., Tranquillo R.T. The fibroblast-populated collagen microsphere assay of cell traction force—Part 2: Measurement of the cell traction parameter. J. Biomech. Eng. 1995;117:161–170. doi: 10.1115/1.2795998. [DOI] [PubMed] [Google Scholar]
- 8.Zaleskas J.M., Kinner B., Spector M. Contractile forces generated by articular chondrocytes in collagen-glycosaminoglycan matrices. Biomaterials. 2004;25:1299–1308. doi: 10.1016/j.biomaterials.2003.08.005. [DOI] [PubMed] [Google Scholar]
- 9.Kim A., Lakshman N., Petroll W.M. Quantitative assessment of local collagen matrix remodeling in 3-D culture: the role of Rho kinase. Exp. Cell Res. 2006;312:3683–3692. doi: 10.1016/j.yexcr.2006.08.009. [DOI] [PMC free article] [PubMed] [Google Scholar]
- 10.Harley B.A., Freyman T.M., Gibson L.J. A new technique for calculating individual dermal fibroblast contractile forces generated within collagen-GAG scaffolds. Biophys. J. 2007;93:2911–2922. doi: 10.1529/biophysj.106.095471. [DOI] [PMC free article] [PubMed] [Google Scholar]
- 11.Barocas V.H., Tranquillo R.T. An anisotropic biphasic theory of tissue-equivalent mechanics: the interplay among cell traction, fibrillar network deformation, fibril alignment, and cell contact guidance. J. Biomech. Eng. 1997;119:137–145. doi: 10.1115/1.2796072. [DOI] [PubMed] [Google Scholar]
- 12.Yamato M., Adachi E., Hayashi T. Condensation of collagen fibrils to the direct vicinity of fibroblasts as a cause of gel contraction. J. Biochem. 1995;117:940–946. doi: 10.1093/oxfordjournals.jbchem.a124824. [DOI] [PubMed] [Google Scholar]
- 13.Lee P.F., Yeh A.T., Bayless K.J. Nonlinear optical microscopy reveals invading endothelial cells anisotropically alter three-dimensional collagen matrices. Exp. Cell Res. 2009;315:396–410. doi: 10.1016/j.yexcr.2008.10.040. [DOI] [PubMed] [Google Scholar]
- 14.Loftis M.J., Sexton D., Carver W. Effects of collagen density on cardiac fibroblast behavior and gene expression. J. Cell. Physiol. 2003;196:504–511. doi: 10.1002/jcp.10330. [DOI] [PubMed] [Google Scholar]
- 15.Gentleman E., Dee K.C., Nauman E.A. Operating curves to characterize the contraction of fibroblast-seeded collagen gel/collagen fiber composite biomaterials: effect of fiber mass. Plast. Reconstr. Surg. 2007;119:508–516. doi: 10.1097/01.prs.0000246316.87802.b4. [DOI] [PubMed] [Google Scholar]
- 16.Woodley D.T., Yamauchi M., Briggaman R.A. Collagen telopeptides (cross-linking sites) play a role in collagen gel lattice contraction. J. Invest. Dermatol. 1991;97:580–585. doi: 10.1111/1523-1747.ep12481920. [DOI] [PubMed] [Google Scholar]
- 17.Sieminski A.L., Hebbel R.P., Gooch K.J. Improved microvascular network in vitro by human blood outgrowth endothelial cells relative to vessel-derived endothelial cells. Tissue Eng. 2005;11:1332–1345. doi: 10.1089/ten.2005.11.1332. [DOI] [PubMed] [Google Scholar]
- 18.Wang Y.-H., Chiu W.-T., Tang M.-J. Deregulation of AP-1 proteins in collagen gel-induced epithelial cell apoptosis mediated by low substratum rigidity. J. Biol. Chem. 2007;282:752–763. doi: 10.1074/jbc.M604801200. [DOI] [PubMed] [Google Scholar]
- 19.Zhu Y.K., Umino T., Rennard S.I. Contraction of fibroblast-containing collagen gels: initial collagen concentration regulates the degree of contraction and cell survival. In Vitro Cell. Dev. Biol. Anim. 2001;37:10–16. doi: 10.1290/1071-2690(2001)037<0010:COFCCG>2.0.CO;2. [DOI] [PubMed] [Google Scholar]
- 20.Evans M.C., Barocas V.H. The modulus of fibroblast-populated collagen gels is not determined by final collagen and cell concentration: experiments and an inclusion-based model. J. Biomech. Eng. 2009;131:101014. doi: 10.1115/1.4000064. [DOI] [PubMed] [Google Scholar]
- 21.Vernon R.B., Sage E.H. Contraction of fibrillar type I collagen by endothelial cells: a study in vitro. J. Cell. Biochem. 1996;60:185–197. doi: 10.1002/(sici)1097-4644(19960201)60:2<185::aid-jcb3>3.0.co;2-t. [DOI] [PubMed] [Google Scholar]
- 22.Pang Y., Ucuzian A.A., Greisler H.P. The temporal and spatial dynamics of microscale collagen scaffold remodeling by smooth muscle cells. Biomaterials. 2009;30:2023–2031. doi: 10.1016/j.biomaterials.2008.12.064. [DOI] [PMC free article] [PubMed] [Google Scholar]
- 23.Brightman A.O., Rajwa B.P., Voytik-Harbin S.L. Time-lapse confocal reflection microscopy of collagen fibrillogenesis and extracellular matrix assembly in vitro. Biopolymers. 2000;54:222–234. doi: 10.1002/1097-0282(200009)54:3<222::AID-BIP80>3.0.CO;2-K. [DOI] [PubMed] [Google Scholar]
- 24.Bell E., Ivarsson B., Merrill C. Production of a tissue-like structure by contraction of collagen lattices by human fibroblasts of different proliferative potential in vitro. Proc. Natl. Acad. Sci. USA. 1979;76:1274–1278. doi: 10.1073/pnas.76.3.1274. [DOI] [PMC free article] [PubMed] [Google Scholar]
- 25.Harris A.K., Stopak D., Wild P. Fibroblast traction as a mechanism for collagen morphogenesis. Nature. 1981;290:249–251. doi: 10.1038/290249a0. [DOI] [PubMed] [Google Scholar]
- 26.Pizzo A.M., Kokini K., Voytik-Harbin S.L. Extracellular matrix (ECM) microstructural composition regulates local cell-ECM biomechanics and fundamental fibroblast behavior: a multidimensional perspective. J. Appl. Physiol. 2005;98:1909–1921. doi: 10.1152/japplphysiol.01137.2004. [DOI] [PubMed] [Google Scholar]
- 27.Paszek M.J., Zahir N., Weaver V.M. Tensional homeostasis and the malignant phenotype. Cancer Cell. 2005;8:241–254. doi: 10.1016/j.ccr.2005.08.010. [DOI] [PubMed] [Google Scholar]
- 28.Legant W.R., Pathak A., Chen C.S. Microfabricated tissue gauges to measure and manipulate forces from 3D microtissues. Proc. Natl. Acad. Sci. USA. 2009;106:10097–10102. doi: 10.1073/pnas.0900174106. [DOI] [PMC free article] [PubMed] [Google Scholar]
- 29.Byfield F.J., Reen R.K., Gooch K.J. Endothelial actin and cell stiffness is modulated by substrate stiffness in 2D and 3D. J. Biomech. 2009;42:1114–1119. doi: 10.1016/j.jbiomech.2009.02.012. [DOI] [PMC free article] [PubMed] [Google Scholar]
- 30.Freyman T.M., Yannas I.V., Gibson L.J. Fibroblast contractile force is independent of the stiffness which resists the contraction. Exp. Cell Res. 2002;272:153–162. doi: 10.1006/excr.2001.5408. [DOI] [PubMed] [Google Scholar]
- 31.Ghajar C.M., Chen X., George S.C. The effect of matrix density on the regulation of 3-D capillary morphogenesis. Biophys. J. 2008;94:1930–1941. doi: 10.1529/biophysj.107.120774. [DOI] [PMC free article] [PubMed] [Google Scholar]
- 32.Ramanujan S., Pluen A., Jain R.K. Diffusion and convection in collagen gels: implications for transport in the tumor interstitium. Biophys. J. 2002;83:1650–1660. doi: 10.1016/S0006-3495(02)73933-7. [DOI] [PMC free article] [PubMed] [Google Scholar]
- 33.Knapp D.M., Barocas V.H., Tranquillo R.T. Rheology of reconstituted type I collagen gel in confined compression. J. Rheol. 1997;41:971–993. [Google Scholar]
Associated Data
This section collects any data citations, data availability statements, or supplementary materials included in this article.