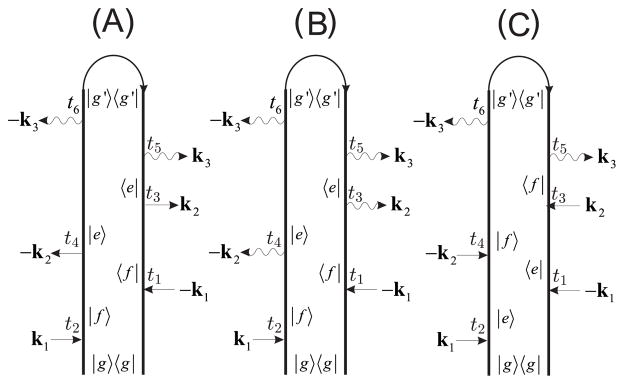
Abstract
In response to quantum optical fields, pairs of molecules generate coherent nonlinear spectroscopy signals. Homodyne signals are given by sums over terms each being a product of Liouville space pathways of the pair of molecules times the corresponding optical field correlation function. For classical fields all field correlation functions may be factorized and become identical products of field amplitudes. The signal is then given by the absolute square of a susceptibility which in turn is a sum over pathways of a single molecule. The molecular pathways of different molecules in the pair are uncorrelated in this case (each path of a given molecule can be accompanied by any path of the other). However, entangled photons create an entanglement between the molecular pathways. We use the superoperator nonequlibrium Green’s functions formalism to demonstrate the signatures of this pathway-entanglement in the difference frequency generation signal. Comparison is made with an analogous incoherent two-photon fluorescence signal.
1. Introduction
Recent progress in developing novel sources of entangled photons [1, 2, 4] had raised considerable interest in using them as a spectroscopic tool. It was predicted [5, 6] and experimentally verified [3, 7, 4] that sum-frequency generation (SFG) and two-photon fluorescence(TPF) signal intensities obtained with entangled photon pairs scale linearly rather than quadratically with the incoming field intensity [3]. The entangled photon pairs thus act as a single particle (bi-photon). For example, experiments proposed by Teich et. al., use twin entangled photons (k1, k2) generated by parametric-down-conversion (PDC) [8, 9, 7, 10]. The SFG [11, 12, 10, 13] signal generated with continuous-wave degenerate entangled photon pairs reveals certain off-resonant molecular energy levels (virtual-state transitions). Spectroscopic information on material optical transitions is contained in the entangled-photon absorption cross section when measured over a range of entanglement (Te) and delay times τ between the entangled photons for |τ| < Te. The entanglement time window is controlled by the PDC crystal length and photon group velocities within the crystal. The spectrum was calculated as the Fourier transform of the transition rate with respect to the controlled-time delay τ between photons.
We have recently calculated resonant frequency-domain incoherent heterodyne detected nonlinear optical signals induced by entangled photons. In an incoherent process each molecule independently interacts with the optical fields and the signal scales linearly with the number of molecules N in the active region. Nonlinear optical signals induced by classical optical fields or quantum fields in a coherent state [15] are determined by susceptibilities χ(n)(−ωs; ±ωn,…, ±ω1) which represent the causal response of the molecule to the field (the field is unaffected by the molecule). However, for a general state of the quantum optical field, the field and matter mutually affect each other and the signal may no longer be interpreted in terms of a causal response of the molecule to the field. Entangled photons are highly nonclassical. The coupled matter/field system and energy redistribution between the optical modes must be described by superoperator nonequilibrium Green’s functions (SNGF) [14, 15] rather than causal response functions. The signal is given by a sum of terms each being a product of material Liouville pathways and a corresponding optical field correlation function [16, 17]. Each of the terms can be represented by a close-time-path-loop (CTPL) diagram.
Application of this formalism to self-heterodyne-detected (pump-probe, PP) signals [18] showed how entangled photons separate quantum pathways which scale linearly with the pump field intensity from ordinary paths which scale quadratically. At low field intensity the latter may be neglected and the spectrum is considerably simplified.
In this paper we employ the same formalism to compute homodyne detected coherent signals [15]. Such cooperative signals are given by sums of contributions of pairs of molecules and therefore scale as the number of molecular pairs N(N − 1). Incoherent signals (such as PP) reveal the entanglement of a single molecule with the optical modes, whereas coherent signals can entangle two molecules with the field.
We consider difference-frequency generation [14] carried out with entangled modes. These are generated by a PDC process and further mixed by Mach-Zehender interferometer (MZI) which controls the degree of entanglement [19]. All degrees of freedom: the PDC/MZI generated entangled modes, the spontaneously emitted k3 mode (initially in the vacuum state), and the molecular pairs are treated as coupled quantum mechanical systems. The signal generated in the k3 = k1 − k2 mode is given by a sum of products of the Liouville pathways for each molecule of the pair, multiplied by a corresponding correlation function of the field.
The signals will be displayed as (ω1,ω2) correlation plots with the frequencies varying across the material optical transitions. When the k1 and k2 fields are classical, all relevant field correlation functions are identical and the signal is given by the absolute square of the susceptibility of a single molecule. The pathways of different molecules are not correlated in this case. However, at low pump intensity the DFG signal induced by an entangled photon pair differs from the classical one due to the path entanglement of molecules in each pair. The signal is given by a sum of products of the pathways in the pair, each multiplied by a corresponding entangled photon correlation functions. The signal can no longer be recast as the square of single molecule amplitudes (susceptibility). The Liouville pathways of the two molecules in the pair are correlated. This correlation is controlled by the degree of entanglement between the photons. We compare this coherent signal with its incoherent counterpart, two-photon fluorescence (TPF) [18].
2. SNGF Expressions for DFG
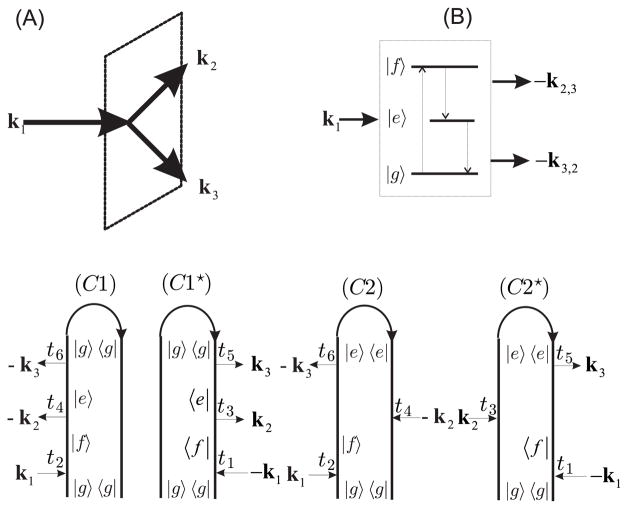
We consider an assembly of N three-level molecules |g〉, |e〉, |f〉 interacting with two incoming modes k1, k2 to generate a coherent signal at k3 = k1 − k2. The molecules are initially in the ground state |g〉. Modes k1, k2 and k3 are resonant with the transitions ωfg,ωfe, and ωeg respectively (Fig. 1 panels (A) and (B)). Modes k1 and k2 can be either classical or in an entangled quantum state. Mode k3 is initially in the vacuum state and is generated by spontaneous emission.
Fig. 1.
DFG: (A) wave-vector configuration of the optical fields corresponding to the phase matching k3 = k1 − k2. (B) molecular level scheme. (C) Liouville space pathways for the pair of molecules contributing to the signal molecule a (C1,C2) and b (C1*,C2*)
The light/matter interaction in the rotating-wave-approximation is:
| (1) |
Here the raising (positive frequency) dipole operator
| (2) |
is written in the interaction picture where the time dependence is with respect to the molecular Hamiltonian H0. The optical transition dipole moments of a molecule located at Rj are projected on the optical mode |〉α. For simplicity all the molecules are assumed identical, have fixed positions and orientations and the transition dipole moments are real.
The positive-frequency component of the optical field is:
| (3) |
where aα is the photon-annihilation operator and Ω is the mode quantization volume.
We shall calculate the time-averaged photon flux in the spontaneously generated k3 mode using the SNGF formalism[15, 14, 20]. We first expand it to first order in interaction superoperator Hamiltonian w(H3)− with mode k3 in eq.(1):
| (4) |
where 〈〉a and 〈〉b denote averages with respect to two molecules a (located at Ra) and b (located at Rb); 〈〉F denotes averaging over the the k1 and k2 field modes. VR(VL) are the superoperators corresponding the the dipole operator (2). In the left/right (L, R) representation superoperators are defined by their actions from the left ALX = AX and from the right ARX = XA on an ordinary operator. The +, − superoperator representation is defined by the transformation .
We next expand each of the material SNGF 〈VL(r6, t6)〉a and in eq. (4) to first order in the interaction superoperator (H1)− (mode k1) and in (H2)− (mode k2):
 |
(5) |
The factor
is characteristic to coherent phase-matched processes [15]. Each term in the above equation is given by a product of three SNGF factors corresponding respectively to molecule a, molecule b and the optical field modes k1, k2. The signal mode k3 has been taken care of by our perturbative expansion (4) and need not be considered explicitly any further. This is why we have a four point rather then six point field correlation function. The operator  maintains bookkeeping of the possible time orderings of the interactions.
The material SNGF’s of each term in eq. (5) can be represented by the closed time path loop diagrams (CTPL) shown in Fig. 1(C). The diagram rules are given in ref.[15].
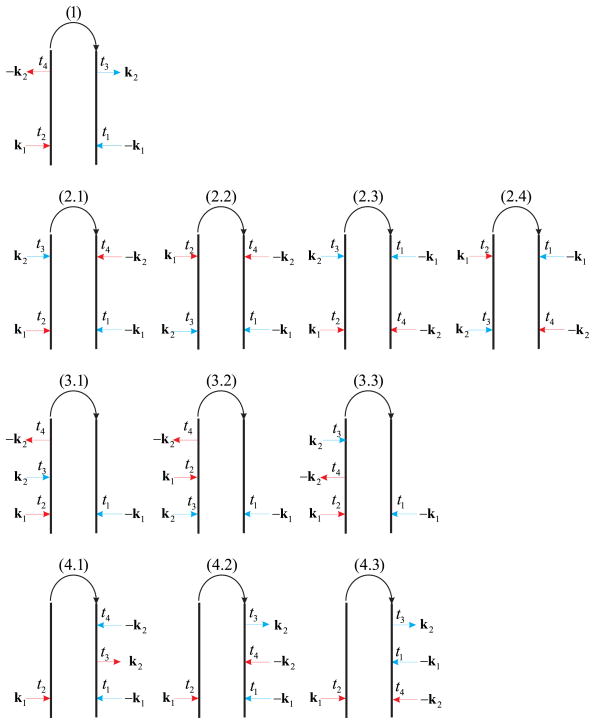
The corresponding SNGF’s for the optical field are represented by the CTPL diagrams in Fig. 2. These will be calculated below for classical and entangled states of the k1 and k2 modes.
Fig. 2.
Optical field SNGF which contribute to the DFG process. Interactions with molecule a occur at times t4, t2 (red arrows), and with molecule b at times t3, t1(blue arrows). Hilbert Space expressions for the signal are obtained by proceeding clockwise along the loop, starting at the bottom left.
3. DFG with classical optical modes
Assuming that modes k1 and k2 are classical continuous-waves Eα(t) = ℰα exp(−iωαt), all optical SNGF in eq. (5) can be factorized into an identical product of amplitudes:
| (6) |
Substituting eq. (6) into (5) and performing the time integrations we obtain the standard frequency-domain expression for the DFG signal[20]:
| (7) |
where is the second order susceptibility. In the L, R representation we have:
| (8) |
The susceptibility is defined by the Fourier transform of the material SNGF’s:
 |
(9) |
where νj = L, R (or +, −). The Heaviside step functions guarantee that τ3 is chronologically the last interaction time.
The superoperator notation used in eq. (8) provides a compact bookkeeping device for various time orderings in the signal (7). At the end, calculations are performed by switching to Hilbert space where each material SNGF becomes a combination of ordinary time ordered correlation functions:
| (10) |
Hereafter we assume that all optical fields are linearly polarized and parallel. For our model is given by a sum of two pathways (8). Substituting (10) into (7) we obtain the LLL pathway (diagram (C1) in Fig. 1) contribution:
| (11) |
Here we have introduced the retarded Green’s function for the forward in time propagation on the left branch of the loop:
| (12) |
where γ is the dephasing rate, and ν, ν′ = {g, e, f}.
For the LLR pathway (Fig. 1(C2)) we similarly obtain:
| (13) |
The pathways and are the complex conjugates of and respectively (Fig. 1, panels (C1★), (C2★)).
Equation (7) is given by a product of the susceptibilities of pairs of molecules. The pathways of molecules a and b are not correlated, i.e. each pathway of molecule a can be accompanied by any pathway of molecule b and the response can be obtained by computing the susceptibility of a single molecule. The only signature of cooperatively in eq. (7) is the N(N −1) pre-factor. One factor represents molecule a and its complex conjugate represents molecule b. Note that eq. (5) may not be generally recast as a square of a transition amplitude. This is only possible when the fields are classical.
4. DFG with entangled optical modes
To derive a formal expression for the DFG signal when both k1 and k2 are quantum modes we recast eq. (5) in the form:
| (14) |
were S1, S2, S3 and S4 represent the four terms of eq. (5) respectively.
Proceeding along the loop clockwise (Fig. 1 (C1,C1★), Fig. 2(1)) we obtain for the first term:
| (15) |
The first factor is the pathway of molecule a (Fig. 1(C1)) and the second (its complex conjugate) is the pathway of molecule b (Fig. 1(C1★)); the third factor is the field correlation function deduced from diagram (1) Fig. 2. Interactions with molecule a(b) are given on the left(right) branch of diagram (1) in Fig. 2 and are marked by red (blue) arrows.
The field SNGF in the second term in eq. (14) is similarly given by the four terms corresponding to diagrams (2.1–2.4):
| (16) |
Interactions from the left (right) now occur with both molecules, hence the various possible time orderings within each branch must be considered. Molecules a and b follow conjugate pathways.
In S3 the molecules do not follow conjugate pathways. Time ordering within each branch results in three optical SNGF for diagrams (3.1–3.3):
| (17) |
Finally S4 is represented by diagrams (4.1–4.3):
| (18) |
To compute the optical field correlation functions in eq. (15–18) we must specify the initial state of the k1 and k2 modes.
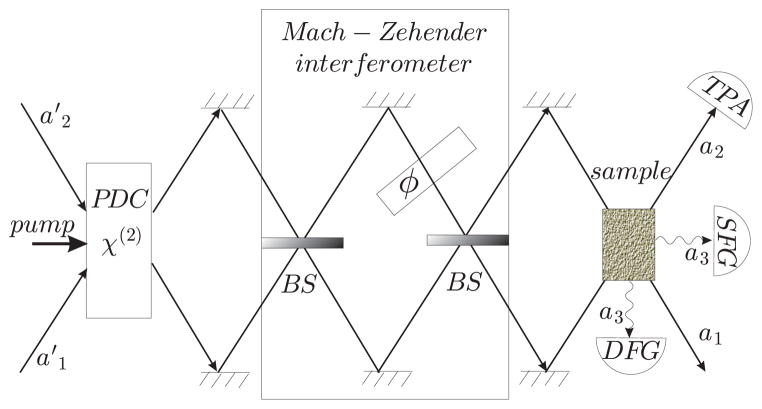
We shall assume entangled photon pairs created by PDC of a single pump beam from gaining in a birefringent crystal[14]. The two beams then pass through the Mach-Zehender interferometer made of two beam-splitters which mix the radiation modes (Fig. 3). The phase shift φ in one of the interferometer arms controls the degree of entanglement. The PDC/MZI apparatus setup generates new modes a1, a2 which are related to the original (canonical) modes a′1, a′2 by the non-unitary transformation[19]:
| (19) |
Fig. 3.
Nonlinear spectroscopy with entangled photons. A non-linear parametric down conversion χ (2) crystal PDC is used to obtain entangled photon pairs from the classical pump beam by parametric down conversion. BS are balanced 50 : 50 beam splitters. φ is a phase shift in one of the interferometer arms. The sample is a collection of N three-level molecules. a′1, a′2 are annihilation operators for the incoming non-entangled (canonical) modes and a1, a2 represent the entangled modes.
Here V = −isinh ν, U = cosh ν. The parameter ν~ χ(2) ℰpL is determined by the crystal non-linearity χ(2), the pump electric field ℰp and the interaction path length L.
The output field of the PDC/MZI setup is given by a product of two vacuum states in the original canonical basis |0′〉 = |0′〉1|0′〉2. This serves as the input for the homodyne-detected DFG experiment. We only retain the terms that scale as |ℰp|2. S1(−ω3; −ω2,ω1) given by eq. (15) scales with ~ |ℰp|4 (diagram (1) in Fig. 2) and is omitted.
Pathways (1), (3.3), (4.1) in Fig. 2 contain the field correlation functions . Proceeding clockwise we have a sequence of photon absorption, emission, absorption, emission in all paths. By computing these expectation values with respect to the input state |0′〉 using the transformation (19) we find that they are all identical:
| (20) |
The field correlation functions for all other pathways are absorption, absorption, emission, emission type: and can be calculated similarly:
| (21) |
For a maximally-entangled state (φ = 0) and at sufficiently low pump intensity (|V|2 ≪ 1) the signal is given by S2 + S3 + S4 (eq. (16), (17), (18)) with pathways ((2.1–2.4), (3.1), (3.2), (4.2), (4.3)) in Fig. 3 :
| (22) |
| (23) |
| (24) |
All of these pathways contain the same field factor (eq.(21)).
Substituting eq. (22), (23), (24) into (14) and noting that we obtain the DFG signal induced by entangled photons at low pumping intensity:
| (25) |
Unlike the classical field expression (7), entangled photons create entanglement between pathways of pairs of molecules. Photon absorption (emission) by molecule a is followed by emission (absorption) by molecule b along the loop (diagrams (2.1–2.4), (3.1), (3.2), (4.2), (4.3) in Fig. 3). This constraints the pathways of the molecules in the pair. And the signal is not given by the square of a transition amplitude.
For comparison, in Appendix A, we calculate the signal assuming that both modes k1 and k2 are in a coherent state (CS). For strong fields we recover the classical result in eq. (7). When |ℰ2|2 ≪ |ℰ1|2, only pathways (1), (3.3), (4.1) in Fig. 3 contribute to the signal. From eq. (32), (33) and (34) we obtain for the signal:
| (26) |
The signals (26) and (25) are both different from the classical signal. The first term (non-conjugate molecular pathways) in these expressions is identical, and difference comes from the second term where the molecules of the pair follow their conjugate pathways.
The following simulation illustrates the signatures of pathway entanglement. In our model the single exciton manifold |e〉 has three states ωeg = {0.5, 0.53, 0.56} in dimensionless units. The doubly-excited manifold |f 〉 has two levels ωfg = {0.93, 1.0}. All transition dipole moments μge, μef, μfg are the same. The same dephasing rate γ = 0.033 was assumed for all transitions.
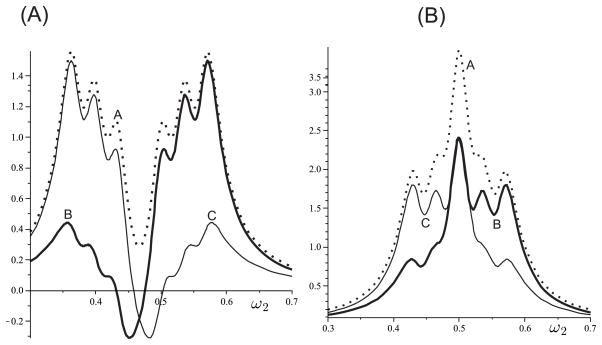
Panel (A) in Fig. 4 shows the DFG signal (7) for classical k1, k2 modes. The three peaks at ω2 < 0.5 are determined by the S1 term. Molecules a and b interact with optical fields along the pathway and its conjugate pathway respectively. The resonances are observed at ω1 − ω2 ≈ ωeg, ω1 ≈ ωgf.
Fig. 4.
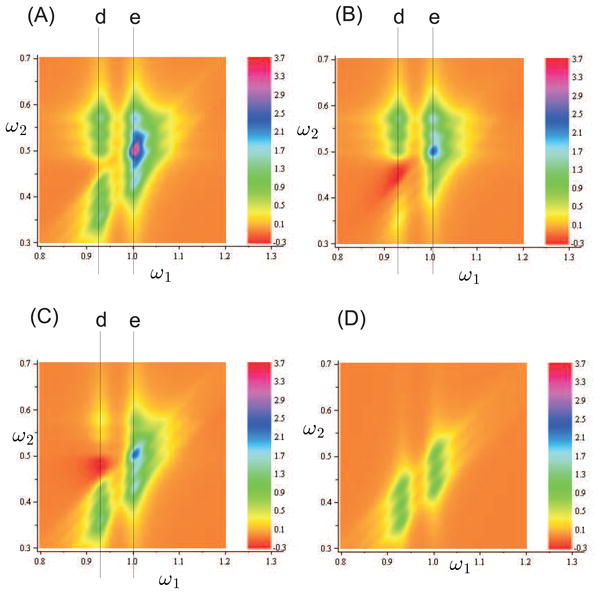
Panels (A–C) are 2D spectra of coherent DFG signals. (A) generated by classical fields, (B) generated by maximally entangled photons (PDC/MZI) in the low pump intensity limit. (C) generated by fields in a coherent state of low intensity. (D) the incoherent TPEF signal with classical k1, k2 modes.
The resonances at ω2 > 0.5 are given by the S2 term, which describes the coherent evolution of two molecules along the two conjugate pathways . This gives resonances at ω2 ≈ ωeg, ω1 ≈ ωgf. The S3 and S4 contribution is around ω2 ≈ 0.5 as expected by the product of non-conjugate pathway’s and .
When the DFG signal is generated by maximally entangled photons (PDC/MZI) at low pump intensity the contribution from S1 term and the corresponding peaks are suppressed as shown in Fig. 4(B). Similarly S2 is suppressed if modes k1 and k2 are weak intensity coherent states (Fig. 4(C)). The suppressed cross-peaks are the signature of the entanglement between the pathways of the molecular pair (See Fig. 5). However, as we show in the next section, the DFG signal (14) with CS becomes a coherent analog of two photon fluorescence (scales as ~ N(N − 1) rather then as ~ N). They both show the same resonances in the spectral region of interest ω2 < 0.5, ω1 < 1, where the contribution from the conjugate molecular pathways is dominating (See Fig. 4(C) and (D)).
Fig. 5.
(A) 1D section of the 2D DFG spectra along of Fig. 4 the line (d) in panels (A, dotted curve), (B, solid thick curve), (C, solid thin curve). (B) same as panel (A) but for a different section (the line (e)) in Fig. 4.
5. Two-photon fluorescence
We now compare the coherent DFG signals (7), (25), (26) with an analogous incoherent two-photon fluorescence signal where photons are spontaneously emitted in mode k3 which is initially in the vacuum state and populated by interaction with classical or quantum modes k1, k2.
The incoherent signal can be expanded to first order in (H3)−:
 |
(27) |
This equation is analogous to (4), but with all interactions now occurring with the same molecule a. Both positive and negative frequency components of modes k1 and k2 contribute to the signal. Equation (27) can be expanded to second order in (H1)−, and (H2)−. By setting ω1 ≈ ωfg we obtain the incoherent phase-insensitive TPF signal:
 |
(28) |
Comparing with eq. (5) we note that both signals are given by the product of a four-point optical and a six-point molecular SNGF’s. Recall that, for the coherent signal in eq. (5) the latter can be factorized into a product of two three-point SNGF’s corresponding to the molecular pairs.
A single loop diagram (Fig. 6(A)) now describes both material and optical SNGF, compared to four molecular and eleven optical pathways required for coherent DFG. The TPF signal is:
| (29) |
Fig. 6.
(A) The incoherent TPF pathway contributing at ω3 ≈ ω1 − ω2 resonance. Mode k3 is spontaneously generated by classical modes k1, k2. (B) CTPL diagram for conventional incoherent two-photon emitted fluorescence (TPEF) signal, when mode k3, k2 are spontaneously generated by the classical mode k1; (C) the loop diagram for two-photon induced fluorescence (TPIF) with classical k1, k2 modes; maximum of the signal corresponds to ω3 ≈ ω1 + ω2.
Expansion in the molecular eigenstates yields:
| (30) |
The signal amplitude A depends on initial state of the modes k1 and k2. When all modes are classical, the optical SNGF is given by eq. (6), and A = |ℰ1|2|ℰ2|2. When k1 and k2 are the entangled modes created by the PDC/MZI (19) we have A = |ℰp|4. In this case the signal (29) scales quadratically with the pump intensity, as in the pathway Fig. 6(A). Absorption of a photon is followed by an emission on the loop. Owing to this factor the contribution to TPF from the entangled photons may be neglected and the spectrum only reveals the coherent DFG part of the signal (shown in panels (B) of Fig. 4).
Using a coherent optical mode k1, and low intensity coherent mode k2, we obtain the conventional two-photon-emitted fluorescence (TPEF)[18]. This signal (29) is also described by CTPL shown in Fig. 6(B), but it now scales linearly with the intensity of k1 mode A = |ℰ1|2.
Equation (30) shows that TPF signals have resonances at ω1 − ω2 ≈ ωeg, ω1 ≈ ωgf as shown in panel (D) of Fig. 4. These resonances coincide with the coherent signal (7) and only scale with the number of molecules ~ N. The coherent ~ N and incoherent ~ N(N − 1) signals have compatible magnitude only when N is small. In this case they may not be spectrally separated by neither classical nor coherent optical fields.
6. Conclusions
We have used the superoperator nonequlibrium Green’s functions formalism to recast the coherent DFG in terms of products of quantum pathways for pairs of molecules and optical field correlation functions. The DFG signal is given by the homodyne-detected time averaged photon flux in the spontaneously generated mode. When the signal is generated by classical optical fields the molecules follow independent Liouville pathways. However entangled fields can entangle the pathways of both molecules. At low field intensity, coherent optical fields and MZI/PDC entangled photons produce complimentary signals with signatures of induced entanglement between the molecular pathways. We further compared the coherent signal with its incoherent analogue: two-photon fluorescence (TPF). The latter is given by single molecule Liouville space pathways multiplied by optical correlation functions. For classical optical fields the coherent and incoherent signals overlap spectrally and provide the same spectroscopic information about the matter. Non-classical optical fields may be used to spectrally separate the two contributions. Entangled photon-pairs can spectrally separate the coherent and incoherent signals. Photon entanglement further induces entanglement between the molecular pathways. It allows to study collective effects in the molecular response for systems with a small number of optically active molecules. However, not all coherent signals generated by entangled photons show the induced entanglement between the molecular pathways. For instance in the homodyne detected sum-frequency generation technique each molecule of the pair follow mutually conjugated pathways so that the pair pathway is fully determined by a single molecule path (See Appendix B). Note that eq. (5) may not be generally recast as the modulus square of a transition amplitude. This is only true either for classical fields (7) or for techniques which involve a single pathway for each molecule (such as SFG). The latter signal generated by a pair of entangled photons may be calculated by means of standard perturbation theory for the transition amplitude [13] and the SNGF formalism is not necessary in this case.
A. DFG with coherent optical modes
The quantum states of the radiation field in modes k1, k2 that most closely resemble classical field are coherent states |β1〉, |β2〉 given by eigenstates of the photon annihilation operators: a1|β1〉 = β1|β1〉,a2|β2〉 = β2|β2〉. The optical correlation functions we shall calculate with respect to this initial coherent state |t = −∞〉 = |β〉1|β〉2.
Using this state the first contribution to the signal (14) becomes:
| (31) |
The complex field amplitude is given by . The optical field factor in (31) when substituted into (14) contains both linear |ℰ1|2 and quadratic terms |ℰ2|2 in the field intensities.
The second term in the signal eq.(14) scales with the product of intensities:
| (32) |
The remaining two contributions to this signal are:
| (33) |
| (34) |
For strong fields (|β| ≫ 1) the linear terms may be neglected and from (14) we recover the classical result (7). When |ℰ2|2 ≪ |ℰ1|2 the signal (14) becomes a coherent analog of TPF (which scales with N(N − 1) rather then N).
B. Homodyne-detected SFG
Two-photon induced fluorescence (TPIF) is the incoherent analogue of the coherent SFG signal. When generated by classical fields, both coherent and incoherent processes spontaneously emit at ω3 ≈ ω1 + ω2. The coherent SFG signal is given by and scales with the signal amplitude A = |ℰp|2 for the entangled photon-pairs or with A = |ℰ1|2|ℰ2|2 for the classical fields. It is given by a single pathway of molecule a and the conjugate pathway of the molecule b.
Modes k1, k2 also generate an incoherent TPF signal as can be seen from the CTPL shown in Fig. 6(C):
| (35) |
This has the same signal amplitudes as for the SFG but with different material SNGF:
For a small number of the molecules, incoherent TPF and coherent SFG signals show the same resonances and may have compatible magnitudes. It is not possible to separate them spectrally by manipulating the quantum optical fields since each molecule in a pair can undergo a single pathway.
Acknowledgments
This work was supported by the National Science Foundation Grant CHE-0745892 and with the National Institutes of Health Grant GM59230.
Contributor Information
Oleksiy Roslyak, Email: oroslyak@uci.edu.
Shaul Mukamel, Email: smukamel@uci.edu.
References and links
- 1.Turchette QA, Wood CS, King BE, Myatt CJ, Leibfried D, Itano WM, Monroe C, Wineland DJ. Deterministic Entanglement of Two Trapped Ions. Phys Rev Lett. 1998;81:3631. [Google Scholar]
- 2.Walther P, Pan J, Aspelmeyer M, Ursin R, Gasparoni S, Zeilinger A. De Broglie wavelength of a nonlocal four-photon state. Nature. 2004;429:158. doi: 10.1038/nature02552. [DOI] [PubMed] [Google Scholar]
- 3.Javanainen J, Gould P. Linear intensity dependence of a two-photon transition rate. Phys Rev A. 1990;41:5088. doi: 10.1103/physreva.41.5088. [DOI] [PubMed] [Google Scholar]
- 4.Dayan B. Theory of two-photon interactions with broadband down-converted light and entangled photons. Phys Rev A. 2007;76:43813. [Google Scholar]
- 5.Lee D, Goodson T. Entangled Photon Absorption in an Organic Porphyrin Dendrimer. J Phys Chem B. 2006;110:25582. doi: 10.1021/jp066767g. [DOI] [PubMed] [Google Scholar]
- 6.Pe’er A, Dayan B, Friesem AA, Silberberg Y. Temporal Shaping of Entangled Photons. Phys Rev Lett. 2005;94:073601. doi: 10.1103/PhysRevLett.94.073601. [DOI] [PubMed] [Google Scholar]
- 7.Hong CK, Mandel L. Theory of parametric frequency down conversion of light. Phys Rev A. 1985;31:2409. doi: 10.1103/physreva.31.2409. [DOI] [PubMed] [Google Scholar]
- 8.Mandel L, Wolf E. Optical Coherence and Quantum Optics. Cambridge University Press; 1995. [Google Scholar]
- 9.Gerry C, Knight P. Introductory Quantum Optics. Cambridge University Press; 2005. [Google Scholar]
- 10.Fei H, Jost B, Popescu S, Saleh B, Teich M. Entanglement-Induced Two-Photon Transparency. Phys Rev Lett. 1997;78:1679–1682. [Google Scholar]
- 11.Lissandrin F, Saleh BEA, Sergienko AV, Teich MC. Quantum theory of entangled-photon photoemission. Phys Rev B. 2004;69:165317. [Google Scholar]
- 12.Teich M, Saleh B. Entangled-photon microscopy, spectroscopy, and display. 5, 796,477 US Patent. 1998
- 13.Saleh B, Jost B, Fei H, Teich M. Entangled-Photon Virtual-State Spectroscopy. Phys Rev Lett. 1998;80:3483. [Google Scholar]
- 14.Roslyak O, Marx C, Mukamel S. A unified description of sum frequency generation, parametric down conversion and two photon fluorescence. J Mol Phys. 2008 doi: 10.1080/00268970902824250. (submitted) [DOI] [PMC free article] [PubMed] [Google Scholar]
- 15.Marx C, Harbola U, Mukamel S. Nonlinear optical spectroscopy of single, few, and many molecules: Nonequilibrium Green’s function QED approach. Phys Rev A. 2008;77:22110. doi: 10.1103/PhysRevA.77.022110. [DOI] [PMC free article] [PubMed] [Google Scholar]
- 16.Glauber R. The photon theory of optical coherence. Phys Rev. 1963;130:2529. [Google Scholar]
- 17.Glauber R. Quantum Theory of Optical Coherence: Selected Papers and Lectures. Wiley-VCH; 2007. [Google Scholar]
- 18.Roslyak O, Marx C, Mukamel S. Manipulating quantum pathways of matter with entangled photons. Phys Rev B. 2008 doi: 10.1103/PhysRevA.79.033832. (submitted) [DOI] [PMC free article] [PubMed] [Google Scholar]
- 19.Nagasako EM, Bentley SJ, Boyd RW, Agarwal GS. Nonclassical two-photon interferometry and lithography with high-gain parametric amplifiers. Phys Rev A. 2001;64:043802. [Google Scholar]
- 20.Mukamel S. Principles of nonlinear optical spectroscopy. Oxford University Press; New York: 1995. [Google Scholar]


