

Abstract
The human intestinal proton-coupled peptide transporter, hPEPT1 (SLC15A1), has been identified as an absorptive transporter for both drug substances and prodrugs. An understanding of the prerequisites for transport has so far been obtained from models based on competition experiments. These models have limited value for predicting substrate translocation via hPEPT1. The aim of the present study was to investigate the requirements for translocation via hPEPT1. A set of 55 tripeptides was selected from a principal component analysis based on VolSurf descriptors using a statistical design. The majority of theses tripeptides have not previously been investigated. Translocation of the tripeptides via hPEPT1 was determined in a MDCK/hPEPT1 cell-based translocation assay measuring substrate-induced changes in fluorescence of a membrane potential-sensitive probe. Affinities for hPEPT1 of relevant tripeptides were determined by competition studies with [14C]Gly-Sar in MDCK/hPEPT1 cells. Forty tripeptides were found to be substrates for hPEPT1, having Kmapp values in the range 0.4–28 mM. Eight tripeptides were not able to cause a substrate-induced change in fluorescence in the translocation assay and seven tripeptides interacted with the probe itself. The conformationally restricted tripeptide Met-Pro-Pro was identified as a novel high-affinity inhibitor of hPEPT1. We also discovered the first tripeptide (Asp-Ile-Arg) that was neither a substrate nor an inhibitor of hPEPT1. To rationalise the requirements for transport, a quantitative structure–activity relationship model correlating Kmapp values with VolSurf descriptors was constructed. This is, to our knowledge, the first predictive model for the translocation of tripeptides via hPEPT1.
Key words: FLIPR membrane potential assay, PEPT1 (SLC15A1), QSAR, translocation, tripeptides
INTRODUCTION
The human proton-coupled peptide transporter hPEPT1 is located in the apical membrane of the small intestine where its physiological function is transport of di- and tripeptides (1–3). Several β-lactam antibiotics and antiviral prodrugs are also transported by hPEPT1 (4–8), and therefore, hPEPT1 has attracted considerable interest in drug delivery as an absorptive transport pathway (9,10). Low permeability of a drug candidate may slow or stop further development. Rational design of drug or pro-drug candidates, i.e. by making them substrates for hPEPT1, might be one strategy to overcome this problem (11). An example of the successful application of this strategy is the antiviral prodrug valganciclovir; the parent compound ganciclovir is not a substrate for hPEPT1 and has an absorption fraction of 6%, whereas the absorption fraction of the hPEPT1 substrate valganciclovir is 60% (8,12). Accordingly, robust and predictive models of the structural determinants for substrate translocation via hPEPT1 would be a useful tool in the design of new (pro-)drugs.
Ligand binding to PEPT1 has previously been modelled. Bailey et al. reported a template for PEPT1 substrates, which identified four key binding regions in the PEPT1 binding site (13). Gebauer et al. created a quantitative structure–activity relationship (QSAR) model on dipeptides, tripeptides and β-lactam antibiotics employing CoMSIA descriptors (14,15). A QSAR model that correlates the binding of tripeptides to hPEPT1 with the alignment independent VolSurf descriptors was reported in 2006 (16). Recently, Larsen et al. published a model using hierarchical projections to latent structures by means of partial least square (PLS) modelling and several alignment independent descriptors (17). All previously published QSAR models have been based on affinity data, obtained in competition experiments with stable, radiolabelled dipeptides, thus basically modelling the ligand binding. However, it has become evident that ligand binding to hPEPT1 does not necessarily correlate with ligand translocation via the transporter. Several inhibitors of hPEPT1 have been identified including l-Glu(trans-2-thymidine-1-yl-tetrahydrofuran-3-yl ester)-Sar, l-Glu(acyclothymidine)-Sar, Glu(acyclovir)-Sar, Lys[Z(NO2)]-Pro and 4-aminomethylbencoic acid (18–21). The relationship between affinity and translocation via hPEPT1 of a large number of dipeptides has been reported, but no structure–translocation relationship by means of a QSAR model has been made (22).
The aim of the present study was to create a structure–translocation relationship for tripeptide translocation via hPEPT1 using Kmapp values as a measure. A representative selection of tripeptides was selected, and the translocation via hPEPT1 was determined in MDCK/hPEPT1 cell using a membrane potential-sensitive fluorescence probe. This enabled us to successfully construct the first quantitative structure–translocation relationship for hPEPT1.
MATERIAL AND METHODS
Materials
Dulbecco’s modified Eagle medium, penicillin/streptomycin, l-glutamine, non-essential amino acids, Hanks’ balanced salt solution (HBSS) and geneticin were from Invitrogen (Taastrup, Denmark). Foetal bovine serum was purchased from Biotech line (Slangerup, Denmark). Ninety-six well black and clear bottom tissue-culture treated polystyrene plates were from BD Falcon (Franklin Lakes, NJ, USA). Gly-Pro, Gly-Sar, 2-[N-morpholino]ethanesulfonic acid (MES), 4-(2-hydroxyethyl)-1-piperazineethanesulfonic acid (HEPES), Triton X-100 and bovine serum albumin (BSA) were from Sigma-Aldrich (Brøndby, Denmark). [14C]Gly-Sar (specific activity 56 mCi/mmol) was from GE-Healthcare (Freiburg, Germany). [3H]mannitol (specific activity 17 Ci/mmol) and Ultima Gold scintillation fluid were from Perkin Elmer Life and Analytical Sciences (Boston, MA, USA). The FLIPR® membrane potential assay kit was purchased from Molecular Devices (Berkshire, UK). Ala-Asn-Ser (purity 100%), Ala-Asp-Tyr (purity 99%), Ala-Ile-Asp (purity 95%), Ala-Lys-Asn (purity 100%), Arg-His-Asp (purity 100%), Arg-Ile-Gln (purity 100%), Arg-Ile-Thr (purity 99%), Arg-Phe-Gln (purity 100%), Arg-Pro-Ser (purity 100%), Arg-Ser-Ser (purity 97%), Asn-Arg-Leu (purity 99%), Asn-Gly-His (purity 100%), Asn-His-Trp (purity 97%), Asp-Arg-Arg (purity 98%), Asp-Cys-Asp (purity 100%), Asp-Ile-Arg (purity 100%), Asp-Tyr-Thr (purity 98%), Cys-Asn-Met (purity 95%), Cys-Leu-Tyr (purity 97%), Gln-Glu-Ile (purity 97%), Gln-Thr-Asn (purity 100%), Glu-Glu-Glu (purity 100%), Glu-Glu-Ser (purity 99%), Glu-Ser-Met (purity 98%), Gly-Gly-Leu (purity 99%), Gly-Pro-Lys (purity 99%), Gly-Trp-Val (purity 98%), Gly-Tyr-Trp (purity 100%), His-Thr-Asn (purity 98%), Ile-Leu-Met (purity 100%), Leu-Asp-Trp (purity 99%), Leu-Leu-Asp (purity 96%), Lys-Lys-Glu (purity 99%), Lys-Val-Pro (purity 96%), Met-Glu-Tyr (purity 99%), Met-Leu-Asn (purity 100%), Met-Pro-Pro (purity 98%), Phe-Gly-Val (purity 100%), Phe-His-Lys (purity 100%), Phe-Leu-Ala (purity 96%), Pro-Glu-Leu (purity 99%), Pro-Gly-Asn (purity 99%), Pro-Trp-Ile (purity 95%), Ser-Asn-Asn (purity 99%), Ser-Cys-Glu (purity 100%), Ser-Gln-Phe (purity 98%), Ser-Leu-Ala (purity 99%), Ser-Ser-Ser (purity 99%), Thr-Met-Phe (purity 95%), Trp-Glu-Asp (purity 100%), Trp-Pro-Tyr (purity 100%), Trp-Trp-Trp (purity 100%), Tyr-Lys-Thr (purity 97%) and Val-Ser-Thr (purity 99%) were custom-synthesised at Caslo Laboratory (Lyngby, Denmark) and separated as trifluoroacetate salts. Purities were measured with HPLC-UV and identity was determined with mass spectrometry. Ala-Ala-Ala, Ala-Pro-Ala, Gly-Ala-Asp, Gly-Ala-Phe, Gly-Glu-Gly, Gly-Gly-Gly, Gly-Leu-Tyr, Gly-Val-Phe, Met-Phe-Gly and Ser-Gly-Gly were purchased from Bachem (Weil am Rhein, Germany) and had a purity of at least 95% (determined by TLC or HPLC analysis).
Methods
Biological Investigations
Cell Culture
MDCK cells stably expressing hPEPT1 (MDCK/hPEPT1 cells) or transfected with the empty pcDNA3.1 vector (MDCK/Mock cells) were kindly donated by Bristol-Meyers Squibb Company (New Brunswick, NJ, USA) (23). Cells were seeded in culture flasks and passaged in Dulbecco’s modified Eagle’s medium with 10% foetal bovine serum, penicillin (100 U/ml), streptomycin (100 µg/ml), 1% l-glutamine, 1% non-essential amino acids and geneticin (0.3 µg/ml). The cells were grown in an atmosphere of 5% CO2 and 95% O2 at 37°C. Growth media were replaced every second or third day. Fore experiments, cells were seeded at a density of 1 × 10⁵ cells/well in 24-well plates or 4 × 10⁴ cells/well in 96-well plates in Dulbecco’s modified Eagle’s medium with 10% foetal bovine serum, penicillin (100 U/ml), streptomycin (100 µg/ml), 1% l-glutamine and 1% non-essential amino acids. All experiments were conducted three days post-seeding. MDCK/hPEPT1 cells were used in passages 25–35, and the MDCK/Mock cells were in passage 20–31.
Estimation of Substrate Translocation by Fluorescence-Based Measurements of Changes in Membrane Potential
The growth media were aspirated from the cells and replaced with 50 μl of FLIPR® membrane potential assay kit dye stock solution reconstituted in HBSS buffer pH 6.0 (HBSS supplemented with 10 mM MES and 0.05% BSA). The cells were incubated for 30 min at 37°C to ensure dye equilibrium across the cell membrane. The assays were carried out at 37°C and were initiated by addition of 50 μl test solution in HBSS buffer pH 6.0 with FLIPR® membrane potential assay kit dye. Sample-induced changes in fluorescence (indicative of changes in membrane potential) were measured on a NOVOstar platereader (BMG LabTech, Offenburg, Germany). The probe was excited at 544 nm and emission light was collected at 590 nm. The fluorescence was recorded over a period of 72 s. Nine concentrations were tested (0.1, 0.25, 0.5, 0.8, 1, 2, 5, 10 and 20 mM). Due to limited solubility, it was not possible to test all tripeptides in the highest concentrations. The maximum tested concentration of these tripeptides were as follows: Pro-Trp-Ile (5 mM), Ser-Gln-Phe (10 mM), Gly-Trp-Val (5 mM), Phe-Leu-Ala (10 mM), Trp-Trp-Trp (1.25 mM), Gly-Tyr-Trp (0.6 mM), Gly-Val-Phe (1.25 mM) and Met-Phe-Gly (2.5 mM). For interpretation of the results, see “Data Analysis” section.
[14C]Gly-Sar Uptake Studies
Interaction of test substances with hPEPT1 was determined in concentration-dependent competition studies measuring [14C]Gly-Sar uptake. [3H]mannitol was added as a marker for extracellular volume. MDCK/hPEPT1 cells grown in 24-well plates were pre-incubated with HBSS, pH 7.4 (HBSS supplemented with 10 mM HEPES and 0.05% BSA) for 20 min. After aspirating the HBSS, the experiment was initiated by addition of 400 µl HBSS pH 6.0 containing 17.9 µM [14C]Gly-Sar, [3H]mannitol and varying amount of test compound (0–10 mM). During incubation, the cells were continuously shaken at 37°C on a Heidolph Unimax 2010 orbital shaker (Kelheim, Germany). After 5 min, the solutions were removed and the cells were washed three times with ice-cold HBSS buffer. The cells were detached by adding 400 µl of 0.1% Triton-X 100 in H2O and incubating at 37°C for at least 30 min. The cell homogenate was transferred to a scintillation vial, and 2 ml scintillation fluid was added. The radioactivity was counted by liquid scintillation spectrometry in a Packard TriCarb 2100TR liquid scintillation counter (Meriden, CT, USA). The tripeptides were tested in seven concentrations in the range 0.05–10 mM except for Trp-Trp-Trp where the maximum concentration tested was 2.5 mM.
Computational Procedures
Preparation of Structures
Molecular structures were built in the programme SYBYL (v.7.2, Tripos Associates Inc., St. Louis, MO, USA). Chemical groups were modelled in their dominating charge state at physiological pH. The MMFF94 force field was used for short energy relaxations (dielectric constant set to ε = 4, maximum iterations = 100). All calculations were run on a personal computer.
Molecular Descriptors
The VolSurf descriptors were calculated using the VolSurf software v.4.1.4.1 from Molecular Discovery Ltd. (Middlesex, UK). The principle behind the VolSurf descriptors has been described in details by Cruciani at al. (24,25). In brief, the 3D MIFs of a molecule are used to calculate volume and surface descriptors (size and shape as well as hydrophilic and hydrophobic regions and the balance between them). A grid spacing of 0.5 Å and eight energy levels were used in combination with the water (OH2), hydrophobic (DRY), carbonyl oxygen (O) and amide (N1) probes (definitions can be found in the VolSurf software manual) (26). In addition, six GRID-independent descriptors were included, resulting in a total of 110 descriptors.
PCA Modelling of Tripeptides and Selection of Test Compounds
Translocation properties of a large number of dipeptides had already been tested by Vig et al. (22). Therefore, it was decided to base the compound selection on tripeptides in the present study. Pilot experiments indicated that peptides with a positive charge of two or three interacted directly with the FLIPR® membrane potential-sensitive fluorescent probe. Tripeptides with two or three positive charges were therefore excluded. The side chain of histidine was regarded as having no net charge. Principal component analysis (PCA) of the remaining 7,800 tripeptides was created using the generated VolSurf descriptors and default settings in the SIMCA-P+ software (v. 11.5.0.0, Umetrics AB, Umeå, Sweden).
Statistical Design of Experiment
The training set was selected using the default settings in the software programme MODDE (v. 8.0.2, Umetrics AB, Umeå, Sweden). A D-optimal onion design of four layers was applied to the PCA model resulting in the selection of 55 tripeptides for the training set. In D-optimal onion design, the data set is partitioned into layers, and a D-optimal design is applied to each layer.
QSAR Modelling of Tripeptide Translocation via hPEPT1
3A QSAR model describing the VolSurf descriptors influence on the Kmapp values (modelled as −log Kmapp) was created using projections to latent structures (PLS) analysis in the SIMCA-P+ software (v. 11.5.0.0, Umetrics AB, Umeå, Sweden). Default settings were used and the variables were centred and scaled to unit variance. A seven-round cross-validation was performed to test the predictive power of the model (Q2). The model was further validated with response permutation testing and an external test set. The external test set was randomly selected from the in-house stock of tripeptides.
Data Analysis
Determination of Kmapp for Substrate Translocation via hPEPT1
The fluorescence signal was normalised according to the initial fluorescence signal, to account for unequal loading of the monolayers or seeding of cells. The MDCK/Mock cells served as a qualitative control.
The area under curve (AUC) of the normalised fluorescence signal was subtracted the AUC caused by addition of a sample with HBSS, pH 6.0. The AUC values were then expressed as a percentage of the AUC caused by the addition of 20 mM Gly-Sar (later referred to as response), to account for passage and day-to-day variation.
Data were fitted to a Michaelis–Menten type equation (Eq. 1).
 |
1 |
V is the percentage response of a given tripeptide at a given concentration, as compared to the response obtained with 20 mM Gly-Sar, Vmax is the maximal uptake rate of a given tripeptide in percent of the 20 mM Gly-Sar response, Kmapp is the apparent Michaelis–Menten constant (mM) and [S] is the substrate concentration (mM).
AUC describes both the initial change in fluorescence and the equilibrium response. Comparative studies in MDCK/hPEPT1 cells between [14C]Gly-Sar uptake and translocation of Gly-Sar in the MDCK/hPEPT1 FLIPR® membrane potential assay have shown that the AUC correlates well with the flux obtained in the [14C]Gly-Sar uptake studies. Results are given as the fitted Kmapp value ± standard error (Eq. 1) based on the results from nine concentrations (n = 3).
Studies of Inhibition of Gly-Sar Induced Changes in Fluorescence
The data treatment was performed as described under translocation studies with the exception that data were fitted to a four-parameter logistic equation Eq. 2.
Affinity Determinations
IC50 values for the inhibition of Gly-Sar fluxes were obtained by fitting the data to a four-parameter logistic equation (Eq. 2):
 |
2 |
U is percent inhibition of the Gly-Sar flux at inhibitor concentration (millimolars), I, Umax is the initial flux value of Gly-Sar ([I] = 0 mM) ∼100% and Umin is the lowest measured flux value of Gly-Sar at maximum inhibitor concentration.
Inhibition constants (Kiapp) were calculated from the IC50 values using the method derived by Cheng and Prusoff (27) (Eq. 3).
 |
3 |
Kiapp is the affinity constant, S is the concentration of Gly-Sar (mM) and Kmapp is the Michaelis–Menten constant for Gly-Sar (mM). Results are given as the fitted Kiapp value ± SE (Eqs. 2 and 3) based on results from seven concentrations (n = 3). Statistical analysis and data fitting were performed using GraphPad Prism (version. 4.01, GraphPad Software Inc., San Diego, CA, USA).
RESULTS
Principal Component Analysis Modelling of Tripeptides and Selection of Test Compounds
PCA of the 7,800 proteogenic tripeptides (tripeptides with a net charge of +2 or +3 excluded, cf. “Methods” section) resulted in a model of ten components with R2 = 0.85 and Q2 = 0.80. In Fig. 1, the first two components of the PCA model are displayed. Tripeptides and VolSurf descriptors that are situated in the same area of the score and loading plot, respectively, are related. If a tripeptide is situated in the top right corner (e.g., Trp-Trp-Trp) of the score plot, then the descriptors in the top right corner of the loading plot are prevailing for that particular tripeptide. Comparing the two plots reveals that lipophilic tripeptides with high molecular weight are localised in the top right corner indicated by the molecular descriptors log P, molecular weight (MW) and hydrophobic regions (D). The small tripeptides are located at the bottom of the plot, opposite the MW descriptor and at the same side as the diffusivity descriptor. Polar and charged tripeptides are located on the left-hand side, in the same region as descriptors for hydrophilic regions (W) and capacity factors (Cw), i.e. the ratio between hydrophilic regions and the surface area of the molecule.
Fig. 1.

a PCA score plot of 7,800 tripeptides displaying the first two components t[1] and t[2] explaining 31% and 19%, respectively, of the variance in the model. The tripeptides selected from the D-optimal onion design are shown with large dots and tested in the translocation assay. b Loading plot for the first two dimensions
To select as structurally diverse peptides as possible, a D-optimal onion design was used to pick 55 tripeptides out of the 7,800 tripeptides included in the PCA model. The selected test substrates are shown in Fig. 1.
Estimation of Substrate Translocation via hPEPT1
Concentration-dependent changes in fluorescence were measured using a MDCK/hPEPT1 FLIPR® membrane potential assay. Due to the electrogenic nature of hPEPT1-mediated substrate translocation, changes in fluorescence were used as a surrogate marker for substrate transport. Forty of the tripeptides yielded a dose-dependent increase in fluorescence as compared to the mock cells, indicative of hPEPT1-mediated substrate-induced depolarisation. Fluorescence data were fitted to the Michaelis–Menten equation Eq. 1 to obtain Kmapp and Vmax values. The Kmapp values were found to be in the range of 0.4–28 mM (Table I) whereas Vmax varied between 51% and 142% of the response caused by 20 mM Gly-Sar.
Table I.
Structure and K m app Values of Tripeptides Investigated Using a MDCK/hPEPT1 FLIPR® Membrane Potential Assay
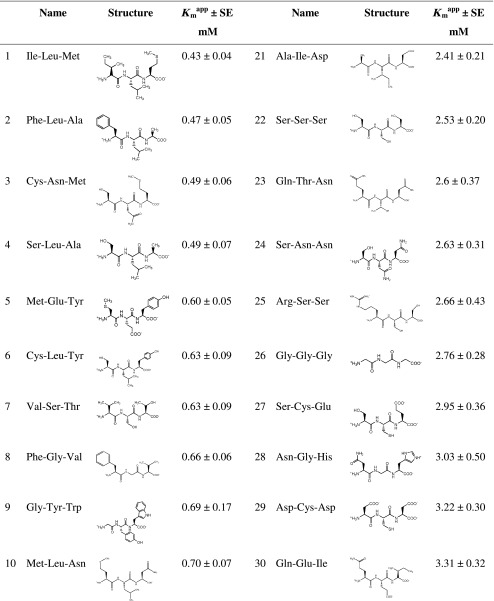
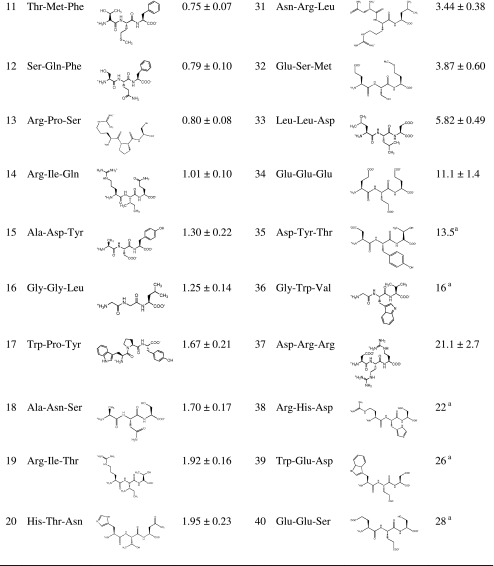
As described in the “MATERIAL AND METHODS” section, K m app values are given as mean ± SE
SE standard error
a V max constrained to 100%
Eight tripeptides (Asp-Ile-Arg, Gly-Pro-Lys, Leu-Asp-Trp, Met-Pro-Pro, Pro-Glu-Leu, Pro-Gly-Asn, Pro-Trp-Ile and Trp-Trp-Trp) were not able to cause changes in fluorescence in the MDCK/hPEPT1 FLIPR® membrane potential assay and were therefore not likely to be substrates for hPEPT1, at least not in the concentration range tested (0.1–20 mM). Due to solubility limitations, Trp-Trp-Trp was analysed in the concentration range 0.03–1.25 mM and Pro-Trp-Ile in the range 0.03–5 mM.
Seven of the tested tripeptides did not display Michaelis–Menten kinetics Eq. 1. Six of these (Ala-Lys-Asn, Arg-Phe-Gln, Asn-His-Trp, Lys-Lys-Glu, Lys-Val-Pro and Tyr-Lys-Thr) had an increase in fluorescence at low concentration, but this was followed by a decrease at higher concentrations, making it impossible to determine a Kmapp value. Phe-His-Lys caused a decline in fluorescence at all concentrations as compared to HBSS.
Tripeptides with Trp in the amino- or carboxy-terminus were translocated when no charged amino acids were present (Gly-Tyr-Trp and Trp-Pro-Tyr). The translocation was drastically reduced or completely abolished when Trp was positioned in the middle of the tripeptide (Gly-Trp-Val and Pro-Trp-Ile). In a study by Vig et al., it was noted that Trp in the C-terminal position either resulted in a reduced or a complete lack of translocation of dipeptides (22), which is in agreement with our results.
The cyclic nature of Pro limits the flexibility of Pro-containing peptides (28), which could affect the substrate translocation via hPEPT1. Two of the tripeptides with Pro in the middle position (Arg-Pro-Ser and Trp-Pro-Tyr) were translocated whereas two others were not (Met-Pro-Pro and Gly-Pro-Lys). Three tripeptides with a Pro residue in the N-terminal position were included in the training set (Pro-Gly-Asn, Pro-Trp-Ile and Pro-Glu-Leu), and all three were not substrates for hPEPT1. This might be due to a hindrance of interactions between residues in the hPEPT1 binding site and the N-terminal of Pro-Xaa-Xaa (Xaa representing any proteogenic amino acid).
hPEPT1 is assumed only to translocate dipeptides in their trans-conformation (28), and the presence of Pro in a dipeptide shifts the cis–trans equilibrium in the direction of increased cis-conformation. This might also explain why Pro containing tripeptides are poor transportates (i.e. molecules translocated). Brandsch et al. investigated the effect of Pro position in dipeptides and found that Xaa-Pro dipeptides generally have higher affinity than Pro-Xaa dipeptides (28), which corresponds well with our findings.
hPEPT1 seems to favour substrates with a positive charge (represented either by Arg or Lys) in position one, as compared to position three. Arg-Pro-Ser, Arg-Ile-Gln and Arg-Ile-Thr had Kmapp constants between 0.8 and 1.9 mM, whereas Gly-Pro-Lys and Asp-Ile-Arg were not transported by hPEPT1 and Asp-Arg-Arg had a very high Kmapp value. The favourable effect of positively charged residues in N-terminal position may be due to the presence of negative side chains in the binding site. Pedretti et al. have created a homology model of hPEPT1 which proposes that the two amino acids Glu23 and Glu26 interact with the ligands N-terminal amino group (29). These two amino acids might also favour the binding of positively charge amino acid residues in the N-terminal position.
Estimation of hPEPT1 Ligand Affinity
Affinity constants of the presumed non-substrates were determined as ability of the compounds to inhibit hPEPT1-mediated uptake of [14C]Gly-Sar in MDCK/hPEPT1 cells. Met-Pro-Pro and Trp-Trp-Trp were found to inhibit [14C]Gly-Sar uptake with high affinities having Kiapp values of 0.02 and 0.08 mM, respectively. On the contrary, Asp-Ile-Arg did not seem to affect [14C]Gly-Sar uptake. Pro-Gly-Asn had only a very weak inhibition, in the concentration range tested (0.1–10 mM). The remaining non-substrates had Kiapp values between 1.8 and 8.0 mM (Table II).
Table II.
Structures and K i app Values of Tripeptides Investigated by [14C]Gly-Sar Uptake Competition in MDCK/hPEPT1 Cells for the Non-substrates
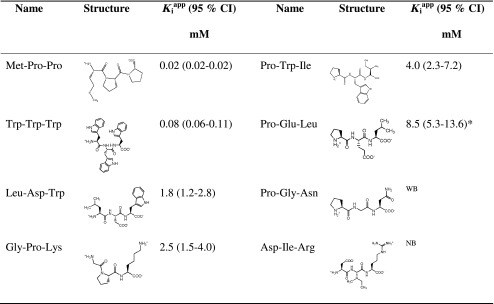
As described in the “MATERIAL AND METHODS” section, K m app values are given as mean and 95% CI
CI confidence interval
a U min (Eq. 2) constrained to 5.6%, which was the uptake of Gly-Sar not inhibited by 20 mM Gly-Pro
bWeak binding to hPEPT1, K i app not possible to determine in the concentration range tested
cNo binding to hPEPT1 in concentration range tested (0.05–10 mM)
To investigate whether Met-Pro-Pro and Trp-Trp-Trp were competitive inhibitors of hPEPT1, their ability to inhibit the Gly-Sar induced signal in the MDCK/hPEPT1 FLIPR® membrane potential assay were investigated. As is evident from Fig. 2, Met-Pro-Pro and Trp-Trp-Trp shifted the dose–response curve for Gly-Sar to the right, confirming that a competitive inhibition is taking place.
Fig. 2.

a Changes in fluorescence measured in the MDCK/hPEPT1 FLIPR® membrane potential translocation assay after addition of increasing concentrations of Gly-Sar (square) or Gly-Sar in combination with 1 mM Met-Pro-Pro (inverted triangle). b Changes in fluorescence measured in the MDCK/hPEPT1 translocation assay after addition of increasing concentrations of Gly-Sar (square) or Gly-Sar in combination with 1.25 mM Trp-Trp-Trp (triangle). The results are mean ± SD of three cell monolayers
Modelling of the Structure–Translocation Relationship of Tripeptides for hPEPT1
A PLS model was created using the VolSurf descriptors as the predictor variables and −log Kmapp as the response variable (Fig. 3). Five of the tripeptides (Asp-Tyr-Thr, Gly-Trp-Val, Arg-His-Asp, Trp-Glu-Asp and Glu-Glu-Ser) had either a low solubility or very high Kmapp. These data were not used in the modelling, due to the uncertainties by which the Kmapp values for these tripeptides were obtained. To further simplify the model, descriptors with an importance less than 1.0 according to the variable importance plot were removed in the modelling process. The final PLS model was subsequently built on 35 tripeptides and 49 descriptors, giving a model with one principal component and R2 and Q2 values of 0.62 and 0.58, respectively.
Fig. 3.

Plot of the PLS coefficients. On the x-axis, the VolSurf descriptors included in the PLS model are shown and the y-axis represents the PLS coefficients. A positive PLS coefficient indicates that a higher value of that VolSurf descriptor has a favourable effect on the −log K m app value, whereas the opposite is true for negative coefficients. The equation for the QSAR model is as follows: −log K m app = 0.15 log P + 0.13 R-OH2 + 0.12 Iw7-OH2 + 0.12 Iw5-OH2 + 0.12 Iw4-OH2 + 0.12 Iw6-OH2 + 0.12 D1-DRY + 0.11 Iw3-OH2 + 0.11 Iw2-OH2 − 0.10 BV12-OH2 − 0.11 EEFR − 0.11 HB2-N1 − 0.12 BV32-OH2 − 0.12 HB6-N1 − 0.12W8-N1 − 0.13 Cw1-OH2 − 0.13W1-OH2 − 0.13 BV22-OH2 − 0.13 HB8-O − 0.13 Cw8-OH2 − 0.14 Cw2-OH2 − 0.14 HB7-N1 − 0.14 Cw3-OH2 − 0.15 HB8-N1 − 0.15W2-N1 − 0.15 HB2-O − 0.15 Cw5-OH2 − 0.15 HB7-O − 0.15 Cw6-OH2 − 0.15 Cw4-OH2 − 0.15W8-OH2 − 0.15W6-N1 − 0.15 Cw7-OH2 − 0.15W5-N1 − 0.15W3-N1 − 0.16W4-N1 − 0.16 HB3-O − 0.16W7-N1 − 0.16W2-OH2 − 0.17W7-OH2 − 0.17W3-OH2 − 0.17 HB4-O − 0.17W5-OH2 − 0.17 HB5-O − 0.17 HB6-O − 0.18W6-OH2 − 0.18W4-OH2 − 0.18 HB1-N1
The VolSurf descriptors integy moment (IW2-7), volume/surface ratio (R), hydrophobic regions (D1) and log P all had positive effects on the −log Kmapp value (Fig. 3). The IWx descriptors measure the unbalance between the centre of mass of a molecule and the position of hydrophilic regions around it. The number (x = 2–7) corresponds to the energy level (−0.5, −1, −2.0, −3.0, −4.0, −5.0 kcal/mol) at which the descriptor was calculated (26). The volume/surface ratio descriptor is a measure of volume-to-surface ratio (that is, the more wrinkled the surface the higher value). The D1 descriptor describes hydrophobic regions and is in this case calculated at the −0.2 kcal/mol energy level.
The majority of the VolSurf descriptors had negative effects on translocation, i.e. the hydrogen bonding descriptors (HB), hydrophilic region descriptors (W), capacity factor descriptors and best volume descriptors (BV). Overall, hydrophilic and hydrogen bonding regions seem to be unfavourable for the translocation process. In Fig. 4, the two tripeptides Ile-Leu-Met (Kmapp = 0.43 mM) and Glu-Glu-Ser (Kmapp = 28 mM) are displayed with their respective hydrophilic molecular interaction fields (MIF) at −4.0 kcal/mol (W6-OH2 descriptor). The volume of the hydrophilic region is inversely correlated with hPEPT1-mediated transport, and the good substrate Ile-Leu-Met thus has a smaller volume compared to the poor substrate Glu-Glu-Ser.
Fig. 4.

Two tripeptides, Ile-Leu-Met (good substrate, K m app = 0.43 mM; left) and Glu-Glu-Ser (poor substrate, K m app = 28 mM; right), shown with their hydrophilic MIFs at −4.0 kcal/mol. The volume of the hydrophilic region is inversely correlated with hPEPT1-mediated transport (cf. W6-OH2; Fig. 3)
To validate the generated PLS model, a response permutation test was performed (Fig. 5a). In response permutation testing, the predictor variables are left intact (i.e. the VolSurf descriptors), while the response variables are randomised (−log Kmapp) in a number of new PLS models. The R2 and Q2 values of these new models were plotted against the correlation coefficient between the original and permutated Kmapp values. The intercept of the R2 and Q2 regression lines were −0.003 and −0.148, respectively. These were well below the limits of 0.3 and 0.05 proposed for valid models (30). An external validation was also performed. The ability of the model to predict the Kmapp values of nine tripeptides, not included in the training set, were investigated (i.e. Ala-Ala-Ala, Ala-Pro-Ala, Gly-Ala-Asp, Gly-Ala-Phe, Gly-Glu-Gly, Ser-Gly-Gly, Gly-Leu-Tyr, Gly-Val-Phe and Met-Phe-Gly). The observed vs. predicted Kmapp values are displayed in Fig. 5b, giving a regression coefficient (r2) of 0.90 and a root-mean-square error of the prediction of 0.29. The root-mean-square error of the prediction value corresponds well with the equivalent one obtained for the training set (0.25), which indicates that the model is not overfitted.
Fig. 5.

a Response permutation testing plot. R 2 and Q 2 were calculated for 50 randomised models, i.e. the descriptors were left intact whereas the −log K m app values were randomised. R 2 (circles) and Q 2 (boxes) are displayed as a function of the correlation coefficient between original and permutated −log K m app values. The intercepts of the regression lines of R 2 and Q 2 were −0.003 and −0.148, respectively. b External validation plot. Measured vs. predicted −log K m app values of nine tripeptides not included in the training set. The straight line indicates Y = X, and the dotted lines denote deviations of 1 logarithmic unit. The r 2 of data was 0.90
DISCUSSION
In the present study, we have tested 55 tripeptides diversely selected from 7,800 tripeptides. Forty of the tripeptides were found to be substrates for hPEPT1, and Kmapp values were obtained. This enabled us to successfully create the first QSAR model that correlates the alignment-independent VolSurf descriptors with Kmapp values for hPEPT1. We also obtained affinity data for a selection of the tripeptides and thereby identified Met-Pro-Pro as a high-affinity inhibitor of hPEPT1 (Kiapp = 20 µM) and Asp-Ile-Arg as neither being a substrate nor an inhibitor of hPEPT1.
Substrates and Inhibitors of hPEPT1
We have obtained translocation and affinity data for a large set of tripeptides, doubling the number of tripeptides already investigated (31). The stability of the tripeptides under the assay conditions might theoretically pose a problem. In the MDCK/hPEPT1 FLIPR® membrane potential assay, the tripeptides were in contact with the cells for only 72 s, and hence, it was assumed that the degradation of the tripeptides to dipeptides was negligible. When determining Kiapp values of the non-substrates, the tripeptides were in contact with the MDCK/hPEPT1 cells for 5 min. We cannot rule out that a small fraction of dipeptides might have influenced the precision by which the Kiapp values were determined.
Eight tripeptides (Met-Pro-Pro, Trp-Trp-Trp, Leu-Asp-Trp, Gly-Pro-Lys, Pro-Trp-Ile, Pro-Glu-Leu, Pro-Gly-Asn and Asp-Ile-Arg) were identified as non-substrates, adding to the growing list of di- and tripeptides that are not being transported by hPEPT1. We found that Trp-Trp-Trp was an inhibitor of hPEPT1 which is in agreement with a previous study (32). Previously, Lys-Arg, Lys-Lys, Lys-Trp, Pro-Arg, Pro-Asp, Pro-Glu, Pro-Gly, Pro-Lys, Pro-Phe, Pro-Ser, Pro-Tyr, Trp-Tyr and Trp-Trp have also been identified as not being substrates for hPEPT1 (22,32). One could speculate that Lys-Arg and Lys-Lys, both having a net positive charge of +2, may have interacted with the assay system, as their method was similar to ours (22). Comparing our data set with the set of dipeptides reported by Vig et al., it becomes clear that dipeptides generally have lower Km values than tripeptides, indicating that translocation of the third positioned amino acid in the tripeptides is energetically less favourable.
hPEPT1 was not capable of transporting the tripeptide Met-Pro-Pro with Pro in both the middle and carboxy-terminal position. Interestingly, the binding of Met-Pro-Pro to hPEPT1 was very strong (Kiapp = 0.02 mM), having one of the highest affinities ever reported for di- and tripeptides. This implies that the conformation adapted by the semi-rigid Met-Pro-Pro molecule was favourable for binding to hPEPT1 but unfavourable for translocation. Biegel et al. have shown that Ile-Pro-Pro and Val-Pro-Pro have affinity constants of 0.28 and 0.06 mM, respectively (14), which was in accordance with Xaa-Pro-Pro binding to hPEPT1 with high affinity. Whether these two tripeptides were transported by hPEPT1 was, however, not reported (14).
A different pattern is observed for Asp-Ile-Arg, which was found to be neither a substrate nor an inhibitor of hPEPT1. This is, to our knowledge, the first report of a proteogenic tripeptide that does not bind to hPEPT1. It is worth noticing that the peptide Asp-Arg-Arg was translocated by hPEPT1, although with a very high Kmapp value (21.1 mM). One can only speculate why this difference in translocation between Asp-Ile-Arg and Asp-Arg-Arg was observed. One suggestion could be that the energy cost for Asp-Arg-Arg to go from the solvated to the hPEPT1-bound form was more favourable due to the position of two neighbouring positive side chains.
The maximum transport rate of the tripeptides varied between 51% and 141% of the response of 20 mM Gly-Sar. At saturating substrate concentrations, the rate-limiting step of translocation is proposed to be reorientation of the empty carrier from the intracellular to the extracellular facing state (33). As different Vmax values were obtained for different tripeptides, additional processes may affect the rate of substrate transport.
To separate, groups have identified peptide transporters in MDCK cells. Brandsch et al. identified PEPT1 at the functional level whereas Terada et al. found a peptide transporter at the basolateral membrane that appeared to be distinct from both PEPT1 and PEPT2 (34,35). In the experimental setting used in the present study, no significant changes in fluorescence were observed in the MDCK/Mock cell line when 20 mM of the tripeptides was added. Either our cell cultivation does not promote the expression of the endogenous peptide transporters or the expression levels are too low to measure in the experimental settings used.
Modelling of Structure–Translocation Relationship of Tripeptides for hPEPT1
The ability of a QSAR model to predict the selected effect parameter is largely defined by the structural diversity of the training set on which the model is build (36). A statistical design of experiment approach was used to ensure that the tripeptides were selected from the entire chemical space spanned by VolSurf descriptors. Surprisingly, not all of the selected tripeptides were translocated by hPEPT1 and others interacted with the assay components, as described in “Methods” section. The structural diversity of the final QSAR model was therefore not as diverse as intended. In spite of this, our model was valid and capable of predicting the translocation of nine tripeptides not included in the training set.
VolSurf descriptors have been specially developed to describe pharmacokinetic properties of drugs, and the descriptors are mainly based on physiochemical information such as the hydrophilic MIF illustrated in Fig. 4 (24,25). Using the fast and simple VolSurf approach provides an overall characterisation of the molecules that are good transportates for hPEPT1. However, it does not identify specific molecular interactions between the protein and ligand, in the way a pharmacophore model would have. A pharmacophore is a static picture of the binding between a protein and a ligand. However, the entire process of translocation of a substrate via PEPT1 is, as indicated by the seven-steep kinetic model proposed by Sala-Rabanal et al., a dynamic process (33). In addition, the binding of substrates to hPEPT1 is much weaker than ligand–receptor interactions, which are often in the nanomolar range (37). Therefore, it seems reasonable that the physiochemical surface parameters calculated by the VolSurf descriptors were useful for prediction of the translocation process through hPEPT1.
Hydrophilic and hydrogen bonding regions were found to be unfavourable for translocation through hPEPT1. The hPEPT1 binding site has been proposed to be rich in apolar amino acid residues which might explain the observed pattern (29). In addition, the desolvation process for tripeptides with strong hydrophilic and hydrogen bonding regions might be less energetically favourable than the more apolar tripeptides.
With the aid of VolSurf descriptors, it has been possible to model the relationship between binding and structure of hPEPT1 ligands (16,17). The present study is the first evidence for the VolSurf descriptors being descriptive of the more complicated process of translocation via hPEPT1.
Comparing the present model with the QSAR model developed by Andersen et al. employing VolSurf descriptors and with the VolSurf part of the model created by Larsen et al., the overall picture is similar (16,17). Binding is a prerequisite for transport which the resemblance between the affinity and translocation models support. A few differences between the three QSAR models were, however, observed. The present model and Larsen et al. found a positive influence from the integy moments whereas the opposite was true for the model proposed by Andersen et al. Both studies found a positive effect of the hydrogen bonding capabilities of the hydrogen bond donor probe (N1) which was in contrast to our model. Whether this observed difference is due to the different effect parameters (i.e. binding versus translocation) was not possible to elucidate from the studies. It could also have been a consequence of the models being built on different training sets. If the purpose of the model is to predict translocation, it is important to build the model from molecules that are actually substrates; this is emphasised by the discovery of eight new inhibitors of hPEPT1.
The tripeptide Lys-Pro-Val has anti-inflammatory properties and a reported Km of 0.7 mM for hPEPT1 (38). The QSAR model presented here predicts the Kmapp of Lys-Pro-Val to be 1.5 mM. hPEPT1 expression is upregulated in inflammatory colon cells; therefore, Lys-Pro-Val might have potential as a new therapeutic for inflammatory bowel disease (38). Our model is thus predictive of the hPEPT1-mediated permeability of what might become a drug substance. As the model presented in this study was based on tripeptides, the next feasible step would be to test and include other classes of hPEPT1 substrates to the model such as β-lactam antibiotics, antiviral drugs, back-bone modified and/or side-chain modified di- and tripeptides as well as dipeptides.
CONCLUSION
We present here the first report on a QSAR model based on hPEPT1 substrate translocation data, a model able to predict the Kmapp for the translocation of tripeptides via hPEPT1. The model may support future design efforts of tripeptidomimetic drug candidates, assisting in the pursuit of an acceptable absorption profile for the compound in question. Seven new proteogenic tripeptides that are not substrates for the proton-coupled peptide transporter were identified. Interestingly, we identified the conformationally restricted tripeptide Met-Pro-Pro as a high-affinity inhibitor of hPEPT1 and Asp-Ile-Arg as the first natural tripeptide that does not bind to hPEPT1.
Acknowledgement
This project was funded by grants from The Novo Nordisk PhD plus Prize and the Carlsberg Foundation. The excellent technical support of Bettina Dinitzen, Birgitte Eltong and Maria D. Læssøe Pedersen is highly appreciated.
References
- 1.Adibi SA. Intestinal transport of dipeptides in man: relative importance of hydrolysis and intact absorption. J Clin Invest. 1971;50:2266–2275. doi: 10.1172/JCI106724. [DOI] [PMC free article] [PubMed] [Google Scholar]
- 2.Fei YJ, Kanai Y, Nussberger S, Ganapathy V, Leibach FH, Romero MF, Singh SK, Boron WF, Hediger MA. Expression cloning of a mammalian proton-coupled oligopeptide transporter. Nature. 1994;368:563–566. doi: 10.1038/368563a0. [DOI] [PubMed] [Google Scholar]
- 3.Ogihara H, Saito H, Shin BC, Terado T, Takenoshita S, Nagamachi Y, Inui K, Takata K. Immuno-localization of H+/peptide cotransporter in rat digestive tract. Biochem Biophys Res Commun. 1996;220:848–852. doi: 10.1006/bbrc.1996.0493. [DOI] [PubMed] [Google Scholar]
- 4.Addison JM, Burston D, Dalrymple JA, Matthews DM, Payne JW, Sleisenger MH, Wilkinson S. A common mechanism for transport of di- and tri-peptides by hamster jejunum in vitro. Clin Sci Mol Med. 1975;49:313–322. doi: 10.1042/cs0490313. [DOI] [PubMed] [Google Scholar]
- 5.Balimane PV, Tamai I, Guo A, Nakanishi T, Kitada H, Leibach FH, Tsuji A, Sinko PJ. Direct evidence for peptide transporter (PepT1)-mediated uptake of a nonpeptide prodrug, valacyclovir. Biochem Biophys Res Commun. 1998;250:246–251. doi: 10.1006/bbrc.1998.9298. [DOI] [PubMed] [Google Scholar]
- 6.de Vrueh RL, Smith PL, Lee CP. Transport of L-valine-acyclovir via the oligopeptide transporter in the human intestinal cell line, Caco-2. J Pharmacol Exp Ther. 1998;286:1166–1170. [PubMed] [Google Scholar]
- 7.Nakashima E, Tsuji A, Mizuo H, Yamana T. Kinetics and mechanism of in vitro uptake of amino-beta-lactam antibiotics by rat small intestine and relation to the intact-peptide transport system. Biochem Pharmacol. 1984;33:3345–3352. doi: 10.1016/0006-2952(84)90104-7. [DOI] [PubMed] [Google Scholar]
- 8.Sugawara M, Huang W, Fei YJ, Leibach FH, Ganapathy V, Ganapathy ME. Transport of valganciclovir, a ganciclovir prodrug, via peptide transporters PEPT1 and PEPT2. J Pharm Sci. 2000;89:781–789. doi: 10.1002/(SICI)1520-6017(200006)89:6<781::AID-JPS10>3.0.CO;2-7. [DOI] [PubMed] [Google Scholar]
- 9.Nielsen CU, Brodin B, Jorgensen FS, Frokjaer S, Steffansen B. Human peptide transporters: therapeutic applications. Expert Opin Ther Pat. 2002;12:1329–1350. doi: 10.1517/13543776.12.9.1329. [DOI] [Google Scholar]
- 10.Nielsen CU, Vabeno J, Andersen R, Brodin B, Steffansen B. Recent advances in therapeutic applications of human peptide transporters. Expert Opin Ther Pat. 2005;15:153–166. doi: 10.1517/13543776.15.2.153. [DOI] [Google Scholar]
- 11.Nielsen CU, Andersen R, Brodin B, Frokjaer S, Taub ME, Steffansen B. Dipeptide model prodrugs for the intestinal oligopeptide transporter. Affinity for and transport via hPepT1 in the human intestinal Caco-2 cell line. J Control Release. 2001;76:129–138. doi: 10.1016/S0168-3659(01)00427-8. [DOI] [PubMed] [Google Scholar]
- 12.Jung D, Dorr A. Single-dose pharmacokinetics of valganciclovir in HIV- and CMV-seropositive subjects. J Clin Pharmacol. 1999;39:800–804. doi: 10.1177/00912709922008452. [DOI] [PubMed] [Google Scholar]
- 13.Bailey PD, Boyd CA, Collier ID, George JP, Kellett GL, Meredith D, Morgan KM, Pettecrew R, Price RA. Affinity prediction for substrates of the peptide transporter PepT1. Chem Commun (Cambridge, UK) 2006;323–5 [DOI] [PubMed]
- 14.Biegel A, Gebauer S, Hartrodt B, Brandsch M, Neubert K, Thondorf I. Three-dimensional quantitative structure-activity relationship analyses of beta-lactam antibiotics and tripeptides as substrates of the mammalian H+/peptide cotransporter PEPT1. J Med Chem. 2005;48:4410–4419. doi: 10.1021/jm048982w. [DOI] [PubMed] [Google Scholar]
- 15.Gebauer S, Knutter I, Hartrodt B, Brandsch M, Neubert K, Thondorf I. Three-dimensional quantitative structure–activity relationship analyses of peptide substrates of the mammalian H+/peptide cotransporter PEPT1. J Med Chem. 2003;46:5725–5734. doi: 10.1021/jm030976x. [DOI] [PubMed] [Google Scholar]
- 16.Andersen R, Jorgensen FS, Olsen L, Vabeno J, Thorn K, Nielsen CU, Steffansen B. Development of a QSAR model for binding of tripeptides and tripeptidomimetics to the human intestinal di-/tripeptide transporter hPEPT1. Pharm Res. 2006;23:483–492. doi: 10.1007/s11095-006-9462-y. [DOI] [PubMed] [Google Scholar]
- 17.Larsen SB, Jorgensen FS, Olsen L. QSAR models for the human H(+)/peptide symporter, hPEPT1: affinity prediction using alignment-independent descriptors. J Chem Inf Model. 2008;48:233–241. doi: 10.1021/ci700346y. [DOI] [PubMed] [Google Scholar]
- 18.Meredith D, Boyd CA, Bronk JR, Bailey PD, Morgan KM, Collier ID, Temple CS. 4-Aminomethylbenzoic acid is a non-translocated competitive inhibitor of the epithelial peptide transporter PepT1. J Physiol. 1998;512(Pt 3):629–634. doi: 10.1111/j.1469-7793.1998.629bd.x. [DOI] [PMC free article] [PubMed] [Google Scholar]
- 19.Eriksson AH, Elm PL, Begtrup M, Brodin B, Nielsen R, Steffansen B. Pyrimidine and nucleoside gamma-esters of L-Glu-Sar: synthesis, stability and interaction with hPEPT1. Eur J Pharm Sci. 2005;25:145–154. doi: 10.1016/j.ejps.2005.02.007. [DOI] [PubMed] [Google Scholar]
- 20.Thomsen AE, Christensen MS, Bagger MA, Steffansen B. Acyclovir prodrug for the intestinal di/tri-peptide transporter PEPT1: comparison of in vivo bioavailability in rats and transport in Caco-2 cells. Eur J Pharm Sci. 2004;23:319–325. doi: 10.1016/j.ejps.2004.08.005. [DOI] [PubMed] [Google Scholar]
- 21.Knutter I, Theis S, Hartrodt B, Born I, Brandsch M, Daniel H, Neubert K. A novel inhibitor of the mammalian peptide transporter PEPT1. Biochemistry. 2001;40:4454–4458. doi: 10.1021/bi0026371. [DOI] [PubMed] [Google Scholar]
- 22.Vig BS, Stouch TR, Timoszyk JK, Quan Y, Wall DA, Smith RL, Faria TN. Human PEPT1 pharmacophore distinguishes between dipeptide transport and binding. J Med Chem. 2006;49:3636–3644. doi: 10.1021/jm0511029. [DOI] [PubMed] [Google Scholar]
- 23.Herrera-Ruiz D, Faria TN, Bhardwaj RK, Timoszyk J, Gudmundsson OS, Moench P, Wall DA, Smith RL, Knipp GT. A novel hPepT1 stably transfected cell line: establishing a correlation between expression and function. Mol Pharm. 2004;1:136–144. doi: 10.1021/mp034011l. [DOI] [PubMed] [Google Scholar]
- 24.Cruciani G, Pastor M, Guba W. VolSurf: a new tool for the pharmacokinetic optimization of lead compounds. Eur J Pharm Sci. 2000;11(Suppl 2):S29–S39. doi: 10.1016/S0928-0987(00)00162-7. [DOI] [PubMed] [Google Scholar]
- 25.Cruciani G, Crivori P, Carrupt P-A, Testa B. Molecular fields in quantitative structure–permeation relationships: the VolSurf approach. J Mol Struct Theochem. 2000;503:17–30. doi: 10.1016/S0166-1280(99)00360-7. [DOI] [Google Scholar]
- 26.Volsurf manual (VolSurf 4.1.4) (2008) In Molecular Discovery Ltd, Pinner
- 27.Cheng Y, Prusoff WH. Relationship between the inhibition constant (K1) and the concentration of inhibitor which causes 50 per cent inhibition (I50) of an enzymatic reaction. Biochem Pharmacol. 1973;22:3099–3108. doi: 10.1016/0006-2952(73)90196-2. [DOI] [PubMed] [Google Scholar]
- 28.Brandsch M, Knutter I, Thunecke F, Hartrodt B, Born I, Borner V, Hirche F, Fischer G, Neubert K. Decisive structural determinants for the interaction of proline derivatives with the intestinal H+/peptide symporter. Eur J Biochem. 1999;266:502–508. doi: 10.1046/j.1432-1327.1999.00885.x. [DOI] [PubMed] [Google Scholar]
- 29.Pedretti A, De LL, Marconi C, Negrisoli G, Aldini G, Vistoli G. Modeling of the intestinal peptide transporter hPepT1 and analysis of its transport capacities by docking and pharmacophore mapping. ChemMedChem. 2008;3:1913–1921. doi: 10.1002/cmdc.200800184. [DOI] [PubMed] [Google Scholar]
- 30.Eriksson L, Johansson E, Kettaneh-Wold N, Trygg J, Wikström C, Wold S. Multi- and megavariate data analysis, part I. Umeå: Umetrics; 2006. [Google Scholar]
- 31.Brandsch M. Transport of drugs by proton-coupled peptide transporters: pearls and pitfalls. Expert Opin Drug Metab Toxicol. 2009;5:887–905. doi: 10.1517/17425250903042292. [DOI] [PubMed] [Google Scholar]
- 32.Biegel A, Knutter I, Hartrodt B, Gebauer S, Theis S, Luckner P, Kottra G, Rastetter M, Zebisch K, Thondorf I, Daniel H, Neubert K, Brandsch M. The renal type H+/peptide symporter PEPT2: structure–affinity relationships. Amino Acids. 2006;31:137–156. doi: 10.1007/s00726-006-0331-0. [DOI] [PubMed] [Google Scholar]
- 33.Sala-Rabanal M, Loo DD, Hirayama BA, Turk E, Wright EM. Molecular interactions between dipeptides, drugs and the human intestinal H+-oligopeptide cotransporter hPEPT1. J Physiol. 2006;574:149–166. doi: 10.1113/jphysiol.2006.107904. [DOI] [PMC free article] [PubMed] [Google Scholar]
- 34.Brandsch M, Ganapathy V, Leibach FH. H(+)-peptide cotransport in Madin–Darby canine kidney cells: expression and calmodulin-dependent regulation. Am J Physiol Ren Physiol. 1995;268:F391–F397. doi: 10.1152/ajprenal.1995.268.3.F391. [DOI] [PubMed] [Google Scholar]
- 35.Terada T, Sawada K, Ito T, Saito H, Hashimoto Y, Inui KI. Functional expression of novel peptide transporter in renal basolateral membranes. Am J Physiol Ren Physiol. 2000;279:F851–F857. doi: 10.1152/ajprenal.2000.279.5.F851. [DOI] [PubMed] [Google Scholar]
- 36.Eriksson L, Johansson E, Kettaneh-Wold N, Trygg J, Wikström C, Wold S. Multi- and megavariate data analysis, part II. Umeå: Umetrics; 2006. [Google Scholar]
- 37.Krogsgaard-Larsen P, Liljefors T, Madsen U. Textbook of drug design and discovery. London: Taylor & Francis; 2002. [Google Scholar]
- 38.Dalmasso G, Charrier-Hisamuddin L, Thu Nguyen HT, Yan Y, Sitaraman S, Merlin D. PepT1-mediated tripeptide KPV uptake reduces intestinal inflammation. Gastroenterology. 2008;134:166–178. doi: 10.1053/j.gastro.2007.10.026. [DOI] [PMC free article] [PubMed] [Google Scholar]