

Abstract
Hepatic cirrhosis is a life-threatening disease arising from different chronic liver disorders. One major cause for hepatic cirrhosis is chronic hepatitis C. Chronic hepatitis C is characterized by a highly variable clinical course, with at least 20% developing liver cirrhosis within 40 years. Only liver biopsy allows a reliable evaluation of the course of hepatitis C by grading inflammation and staging fibrosis, and thus serum biomarkers for hepatic fibrosis with high sensitivity and specificity are needed. To identify new candidate biomarkers for hepatic fibrosis, we performed a proteomic approach of microdissected cirrhotic septa and liver parenchyma cells. In cirrhotic septa, we detected an increasing expression of cell structure associated proteins, including actin, prolyl 4-hydroxylase, tropomyosin, calponin, transgelin, and human microfibril–associated protein 4 (MFAP-4). Tropomyosin, calponin, and transgelin reflect a contribution of activated stellate cells/myofibroblasts to chronic liver injury. The expression of tropomyosin, transgelin, and MFAP-4, an extracellular matrix associated protein, were further evaluated by immunohistochemistry. Tropomyosin and MFAP-4 demonstrated high serum levels in patients with hepatic cirrhosis of different causes.
Conclusion
A quantitative analysis of MFAP-4 serum levels in a large number of patients showed MFAP-4 as novel candidate biomarker with high diagnostic accuracy for prediction of nondiseased liver versus cirrhosis [area under receiver operating characteristic curve (AUC) = 0.97, P < 0.0001] as well as stage 0 versus stage 4 fibrosis (AUC = 0.84, P < 0.0001), and stages 0 to 3 versus stage 4 fibrosis (AUC = 0.76, P < 0.0001).
Hepatic cirrhosis is among the most common causes of death worldwide.1 It is characterized by an increase in components of the extracellular matrix, histological rearrangement, and alterations in the structural microenvironment. Parenchymal cell injury and the subsequent inflammatory reaction induce trans-differentiation of vitamin A–storing hepatic stellate cells into myofibroblasts, which synthesize collagen, matrix proteins, and a broad range of inflammatory and anti-inflammatory cytokines, chemokines, and growth factors.2 Two of the main causes of hepatic fibrosis are viral hepatitis and alcohol abuse.3 Approximately 170 million people are chronically infected with hepatitis C virus (HCV), similar to the incidence of alcohol-induced liver cirrhosis.4,5 Although asymptomatic initially in most cases, HCV infection becomes chronic in an estimated 70% or more of infected patients. The course of chronic hepatitis C infection is highly variable: progression to hepatic cirrhosis can be diagnosed in 10% to 20% of cases; hepatocellular carcinoma occurs in 1% to 4% of these cases.6,7 In many cases, the diagnosis of hepatitis C is made after discovery of transaminase elevations in an advanced stage of the disease, when complications already become apparent. Therapy with pegylated-interferon alpha and ribavirin achieves sustained viral eradication in 40% to 55% of patients with HCV genotype 1 and up to 80% in genotypes 2 and 3.8 Therefore, the number of unsuccessfully treated patients is steadily increasing. Chronic HCV infection is associated with typical histological features that include hepatocellular necrosis and inflammation (referred to as activity or stage of disease) and fibrosis (referred to as stage of disease).9 Currently, only sequential liver biopsies enable evaluation of fibrosis progression. Noninvasive biomarkers of hepatic fibrosis have been introduced10–12 but are far from optimal,13 underscoring the need for more feasible markers of progression risk in hepatitis C.
To address this need, we chose chronic hepatitis C as a model for fibrosis and applied a tissue-based proteomic approach to identify new molecular markers that might improve diagnosis and therapy of hepatic fibrosis. This proteomic approach enabled us to analyze relevant cell types involved in the pathological processes after micro-dissection. Using fluorescence dye protein saturation labeling of the fluorescence two-dimensional difference gel electrophoresis (DIGE) technique, we were able to analyze a small number of microdissected cells. This saturation labeling technique is based on covalent attachment of fluorescence dyes to proteins’ cysteines with increased sensitivity by a factor of 50 to 100, followed by protein separation using two-dimensional gel electrophoresis.14 Our findings have revealed a large number of induced proteins, among which microfibril-associated protein 4 (MFAP-4) is a particularly promising candidate biomarker.
Patients and Methods
Manual Microdissection and Protein Labeling
After permission from the local ethics committee and acquisition of informed consent, cirrhotic liver tissue samples were obtained from seven patients (four men, three women; ages 38–65 years; see Supporting Information) with end-stage liver disease and a liver biopsy specimen consistent with chronic hepatitis C (infection genotype 1) associated liver cirrhosis (METAVIR stage F4, read by the local pathologist within the last 36 months) undergoing liver transplantation at the Department of General Surgery and Transplantation, University Hospital, Essen, Germany. Serum HCV RNA was detected by polymerase chain reaction or branched DNA assay. A positive test for hepatitis B surface antigen or human immunodeficiency virus infection was exclusion criteria. Only patients were included without indication of a hepatocellular carcinoma (sonography, magnetic resonance tomography, α-fetoprotein level of <100 ng/mL). For detailed protocol of the tissue specimen sample preparation via micro-dissection, see Supporting Information.
Two-Dimensional Gel Electrophoresis and Protein Identification Using Liquid Chromatography/Electro-spray Ionization–Mass Spectrometry
Carrier ampholyte-based isoelectric focusing was performed in a self-made isoelectric focusing chamber using tube gels (20 cm × 1.5 mm) as described in the Supporting Information.18 After gel scanning, silver post-staining was performed using a mass spectrometry (MS)-compatible protocol.19 In-gel digestion of proteins was performed with trypsin, and obtained peptides were subjected to further separation and tandem MS analyses.
Tandem MS (MS/MS) analyses were performed on a Bruker Daltonics HCT plus Ion Trap (Bremen, Germany) system. Online reversed-phase capillary high-pressure liquid chromatography (HPLC) separations were performed with Dionex LC Packings HPLC systems (Dionex LC Packings, Idstein, Germany) as described previously by Schäfer et al.20
For protein identification, uninterpreted peptide MS/MS spectra were correlated with the human IPI database (Version v3.15) using the Mascot (Matrix Science, London, UK) algorithms21 within ProteinScape (Bruker). For detailed description, see Supporting Information.
Immunohistochemistry for Transgelin, Tropomyosin, and MFAP-4 in Normal and Cirrhotic Liver
For the immunostaining of transgelin, tropomyosin, and MFAP-4, seven cirrhotic liver samples also considered within the proteomic study, and five histological normal liver samples obtained from resected specimens of liver metastases from colorectal carcinomas, were used. All patients signed an informed consent according to a protocol approved by the ethics committee of the University Hospitals, Kiel (permission number 110/99) and University of Bochum (permission number 2497). Samples were snap frozen in a mixture of isopentane and dry ice and stored at −80°C. Mouse anti-tropomyosin ascites fluid (Sigma, T2780, 1:3000) goat polyclonal anti-transgelin antibody (Abcam, ab 10135, 0.5 μg/mL), and a mouse anti–MFAP-4 (produced by Prof. Dr. Uffe Holmskov, dilution 1:600) were applied as primary antibodies. For negative control, the primary antibodies were omitted. For detailed description, see Supporting Information.
Serum Collection
All patients signed an informed consent form according to a protocol approved by the ethics committee of the University Hospital Bochum (permission number 2497). Serum samples were taken from HCV patients with cirrhotic liver disease, patients with hepatitis B–related cirrhosis, patients with alcoholic liver disease (ALD), and nondiseased control patients using serum sample tubes (Sarstedt AG & Co, Nümbrecht, Germany). Twenty-milliliter blood samples were collected and allowed to clot at room temperature for 40 minutes. Serum was separated by centrifugation at 1500g for 15 minutes. One-milliliter aliquots of serum were taken and stored at −80°C until ready for use. The time from collection to frozen storage was not more than 60 minutes. The samples were collected blind to the investigators participating in the study and contained no identifying features that would make it possible to identify the subjects.
For the analysis of MFAP-4 along the fibrogenesis, we considered serum samples from the German network of Excellence for Viral Hepatitis (Hep-Net, http://ww-w.kompetenznetz-hepatitis.de/) collected at different sites using a standardized protocol for uniform diagnostic, thus reducing artificial results by biased sample pretreatment.
Western Blot Analysis
Aliquots of 100 μg serum proteins were run under denaturing conditions on 4% to 20% gradient polyacrylamide gels. Proteins were electro-transferred onto polyvinylidene fluoride membranes and subsequently incubated for 1 hour at room temperature with tropomyosin (Sigma, T2780 dilution 1:1,000) or MFAP-4 (produced by Prof. Dr. Uffe Holmskov, dilution 1:300) antibody. Horseradish peroxidase–labeled sheep anti-mouse immunoglobulin was used at a dilution of 1:7500 for the detection of bound primary antibody by enhanced chemiluminescence (GE Healthcare Munich, Germany). For visualization, membranes were exposed to Hyperfilm (GE Healthcare, Munich, Germany). For a detailed description, see Supporting Information.
Quantification of MFAP-4 Serum Concentration
Measurement of serum MFAP-4 concentrations was performed using an enzyme-linked immunosorbent assay (ELISA). Quality controls made from culture supernatant diluted to 625 mU/mL and 150 mU/mL, respectively, were included on each plate. All sera were tested in duplicates diluted 1:100 and if out of range retested in appropriate dilution. For a detailed description, see Supporting Information.
Statistical Analysis of MFAP-4 ELISA
The analysis of the ELISA data was carried out by the STATISTICA for Windows 8.0 software suite (StatSoft, Hamburg, Germany). After testing for normal distribution applying the Shapiro-Wilks W-test, the data were analyzed using analysis of variance statistics. To determine significant differences between the groups, a Tukey’s-honestly significant differences (HSD) post hoc test was used.
Plotting receiver operating characteristic (ROC) curves and calculating the area under the curve (AUC) and other attributes were performed using the OriginPro 8G SR1 (OriginLab, Northampton, MA) software suite. An AUC of 0.5 implies that there is no predictive value of the index.
Results
Identification of Candidate Biomarkers for Hepatic Cirrhosis
To identify novel candidate biomarkers for hepatic cirrhosis, we analyzed transplantation specimens from patients with chronic HCV infection. We compared proteomic patterns using two-dimensional (2D) DIGE saturation labeling technique of cirrhotic septa and liver parenchyma cells obtained by manual microdissection (Fig. 1A, B). Tissue specimens from seven cirrhotic livers were sufficient to show a reproducible proteome pattern with approximately 2800 proteins of cirrhotic septa and liver parenchyma (Fig. 1C). Image analysis revealed 35 differentially abundant proteins (Student t test: P < 0.05 and fold change > 3.0). Altogether 24 proteins were more abundant in cirrhotic septa, whereas 11 proteins showed a lower abundance (Supporting Table 1). For protein identification, differentially abundant proteins were isolated from the 2D gel and analyzed by MS after in-gel digestion. Among these proteins we found a striking number of cell structure–associated proteins (Table 1). The expression of tropomyosin was significantly higher (52.4-fold increase) in cirrhotic septa (Fig. 1C). For transgelin, a 15-fold change was detected. Additionally a 46.7-fold increase in the extracellular matrix protein MFAP-4 was induced in cirrhotic tissue (Fig. 1C). Because the activation of hepatic stellate cells from a quiescent phenotype to a highly proliferative “myofibroblast-like” type is associated with marked induction of myogenic proteins, we further analyzed the expression of tropomyosin, transgelin, and MFAP-4 by immunohisto-chemistry, western blot analysis, and ELISA, because these were most likely to reflect hepatic stellate cell responses to chronic injury.
Fig. 1.

Proteome pattern of microdissected cirrhotic septa and liver parenchyma cells revealed by the means of 2D-DIGE. For protein analysis, proteins were Cy3 labeled and separated in the first dimension using carrier ampholyte–based isoelectric focusing, and subsequently, in the second dimension, by sodium dodecyl sulfate polyacrylamide gel electrophoresis. Protein patterns were acquired using a confocal fluorescence scanner. Significantly changed proteins are indicated by arrows and respective spot number. (A) 2D gel of cirrhotic septa; (B) 2D gel of liver parenchyma cells from cirrhotic liver; cirrhotic septa. (C) Section of 2D-DIGE image showing reproducible difference of two candidate proteins after microdissection; Tropomyosin (circle) and MFAP-4 (ellipse) were found significantly highly abundant in seven patients suffering from hepatitis C–associated liver cirrhosis using manual microdissection combined with saturation labeling DIGE technique.
Table 1.
List of Cell Structure–Associated Proteins Highly Abundant in Hepatic Cirrhosis
| Spot Number | Accession | Identified Protein | P Value | Fold Change |
|---|---|---|---|---|
| 716 | IPI00418471.5 | Vimentin | 1.50E-06 | 5.6 |
| 1351 | IPI00021428.1 | Actin alpha 1 | 3.40E-05 | 6.5 |
| 1820 | IPI00010779.4 | Tropomyosin alpha 4 | 1.40E-05 | 12.7 |
| 2385 | IPI00216138.5 | Transgelin | 0.00011 | 15.0 |
| 2364 | IPI00021264.1 | Calponin 1, | 0.00034 | 21.1 |
| 1694 | IPI00014581.1 | Tropomyosin alpha | 4.80E-06 | 28.7 |
| 1413 | IPI00022792.3 | Microfibril-associated glycoprotein 4 | 4.80E-10 | 46.7 |
| 1519 | IPI00220709.3 | Tropomyosin, beta | 2.40E-08 | 52.4 |
| 1580 | IPI00455050.1 | Tropomyosin alpha | 6.60E-07 | 87.1 |
The proteins were identified comparing the proteome of cirrhotic septa and liver parenchyma cells from seven patients suffering from HCV-induced hepatics cirrhosis by a proteome approach using manual microdissection 2D-DIGE and mass spectrometry. The international protein index (IPI, http://www.ebi.ac.uk/IPI/) database accession numbers of identified spots are given in the table as well as the t test P values for significant different spot volumes (fold change) from gel image analysis between the two analyzed groups (cirrhotic versus noncirrhotic tissue). The table of all identified proteins is given in Supporting Table 2.
Immunostaining for Tropomyosin, Transgelin, and MFAP-4 in Normal and Cirrhotic Liver
In histologically normal livers, immunohistochemistry revealed expression of tropomyosin, transgelin, and MFAP-4 in the wall of blood vessels in portal areas. Some fibroblasts were also stained in portal areas (Fig. 2A, C, E). Epithelial cells in bile ducts and hepatocytes were devoid of tropomyosin, transgelin, and MFAP-4. In contrast, the broad cirrhotic septa of all seven cirrhotic livers showed intense staining for all three proteins. The staining pattern suggested not only that the strong signal was attributable to an increase in the number of mesenchymal cells but also that the staining intensity was enhanced in individual hepatic stellate cells and surrounding extracellular matrix (Fig. 2B, D, F).
Fig. 2.
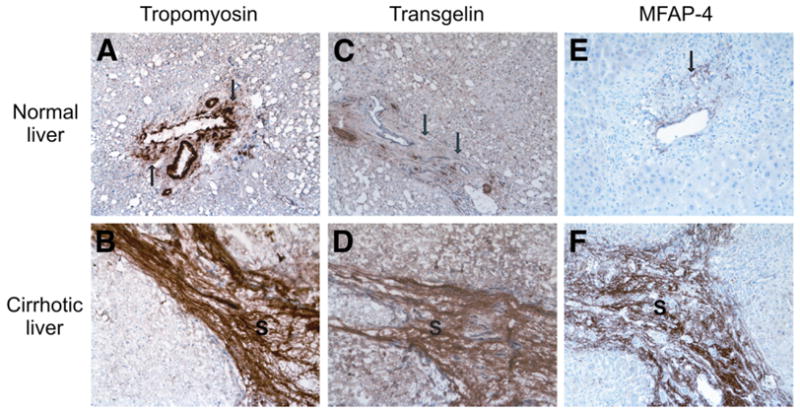
Immunohistochemical stain of tropomyosin, transgelin, and MFAP-4 in normal and cirrhotic liver. (A) Tropomyosin expression in the wall of blood vessels in a portal area of histologically normal liver. Some fibroblasts also show moderate tropomyosin expression (arrows). (B) Tropomyosin expression in the cirrhotic septum (S) of cirrhotic liver. Note the intense staining in the mesenchymal cells and in extracellular matrix. (C) Transgelin in some mesenchymal cells (arrow) in a portal area. (D) Strong expression of transgelin in mesenchymal cells as well as in extracellular matrix of cirrhotic septa (S) in cirrhotic liver. (E) MFAP-4 expression in normal liver. (F) Strong expression of MFAP-4 in cirrhotic cells (original magnification, × 200).
Analysis of Tropomyosin and MFAP-4 Abundance in Sera from Patients with Liver Cirrhosis of Different Etiology Using Western Blot Analysis
From the three selected candidate proteins, only antibodies for tropomyosin and MFAP-4 were suitable for Western blot analysis. In sera from patients (Supporting Table 3) with HCV-associated liver cirrhosis (n = 5), alcohol-induced liver cirrhosis (n = 5), and hepatitis B–associated liver cirrhosis (n = 1), release of tropomyosin and MFAP-4 into the bloodstream during hepatic cirrhosis was detected. In contrast, sera from nondiseased controls (n = 7) showed tropomyosin and MFAP-4 abundance at or below the detection limit (Fig. 3A, B).
Fig. 3.
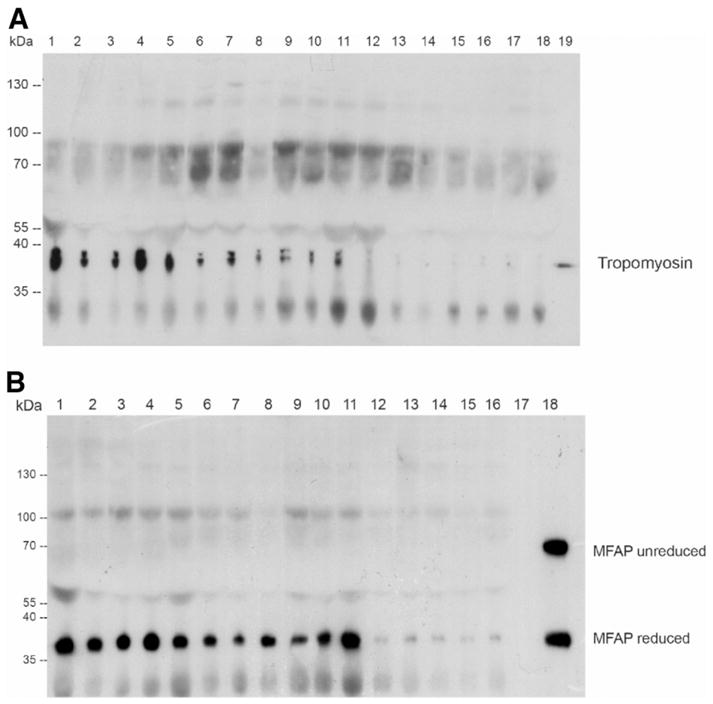
Abundance of tropomyosin and MFAP-4 in sera of patients with hepatic cirrhosis of different origins. Different sera of patients with HCV-associated liver cirrhosis (1–5), hepatitis B–associated liver cirrhosis (6), and alcohol-induced liver cirrhosis (7–11) in comparison with healthy controls (12–18 for tropomyosin, 12–17 for MFAP-4) were analyzed by means of Western blot. Outer lanes (A 19 and B 18, respectively) show the appropriate positive control.
Quantification of MFAP-4 Concentration in Sera from Patients with Liver Cirrhosis of Different Origins Using ELISA
For the quantification of candidate biomarkers in serum in an extended number of patient samples, we used a recently established MFAP-4 ELISA. First, we investigated serum MFAP-4 concentrations in different cohorts of patients (Supporting Table 3): 12 patients with HCV-associated liver cirrhosis (HCV) (fibrosis stage 4), 16 patients with alcoholic liver disease (ALD) (fibrosis stage 4), and 23 nondiseased control individuals. We determined mean MFAP-4 concentrations of 42.4 U/mL ± 18.7 U/mL for HCV samples, 43.8 U/mL ± 36 U/mL for ALD samples and 17 ± 5.2 U/mL for control samples. Analysis of variance showed significant difference between these groups (P < 0.0001). A Tukey post-hoc test confirmed that MFAP-4 concentrations in HCV (P = 0.007) and ALD (P = 0.002) patients were significantly increased (Fig. 4). For different causes (HCV and ALD), we assessed the ability to discriminate between liver cirrhosis patients (fibrosis stage 4) and nondiseased control individuals by performing ROC analysis. When HCV patients with hepatic fibrosis (n = 12) were compared with nondiseased control individuals (n = 23), area under ROC curves (AUC) was 0.97 (P < 0.0001). ROC curve analysis for ALD patients (n = 16) resulted in AUC = 0.82 (P < 0.001). Using an MFAP-4 concentration of 24 U/mL as decision threshold, patients with liver fibrosis on HCV infection (fibrosis stage 4) could be detected with 91.6% sensitivity, and nondiseased patients could be excluded with 95.6% specificity (Fig. 5). For ALD patients, specificity and sensitivity was 95.6% and 75%, respectively, considering the same decision threshold (Fig. 5)
Fig. 4.

Box plot and scatter plot of MFAP-4 sera concentration in patients with hepatic cirrhosis of different origins. The small black circle and the horizontal line mark the mean values and median of the single measurements (triangles) of MFAP-4 serum concentration for HCV-associated and ALD-associated hepatic cirrhosis, respectively; the large boxes constitute 50% of the measurements, whereas the error bars mark the standard deviation.
Fig. 5.
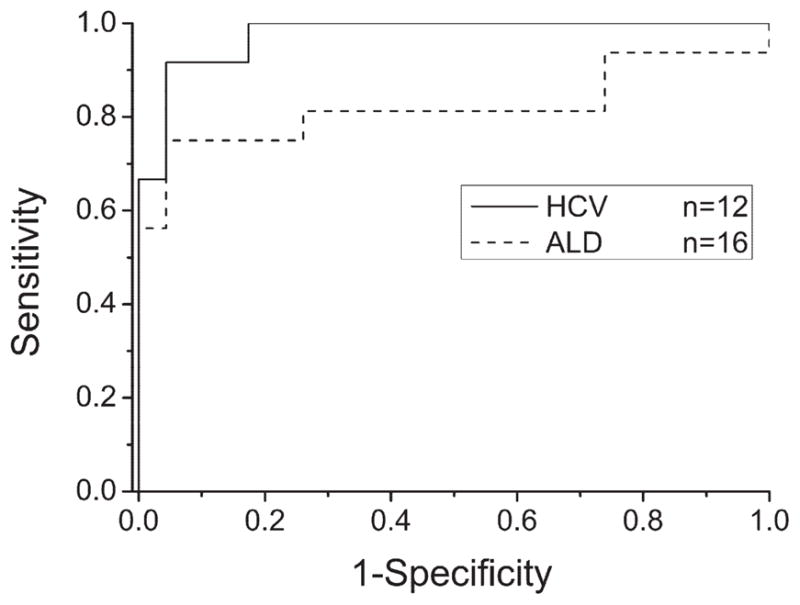
Receiver operating characteristics curves based on MFAP-4 sera concentrations in patients with hepatic cirrhosis of different causes. ROC analyses show high diagnostic accuracies of MFAP-4 serum concentration for HCV-associated and ALD-associated hepatic cirrhosis (AUC = 0.97, P < 0.0001 and 0.82, P < 0.0019, respectively).
Next, we examined whether MFAP-4 serum concentration correlated with stage of fibrosis in HCV patients. To do so, we analyzed sera of 139 patients (Supporting Table 4) collected within the German Hep-Net consortia representing progressive fibrosis stages (stages 0–4). For all 139 patients, results from liver biopsy diagnosis, assessed by two independent pathologists, were available.
By ELISA, MFAP-4 concentrations in serum were of 20.4 U/mL ± 11.3 U/mL for 32 hepatitis C patients without fibrosis (stage 0), 17.5 U/mL ± 7.4 U/mL (stage 1, n = 28), 28.4 U/mL ± 21 U/mL (stage 2, n = 29), 29.9 U/mL ± 15.2 U/mL (stage 3, n = 21) and 41.5 U/mL ± 19.6 U/mL (stage 4, n = 29) (Fig. 6). Analysis of variance statistics showed a highly significant difference between analyzed groups, and a Tukey post-hoc test confirmed an increase of MFAP-4 concentration with progressive stages of fibrogenesis: P < 0.0001 (stage 0 compared with stage 4), P < 0.0001 (stage 1 compared with stage 4), P = 0.01 (stage 2 compared with stage 4). ROC curve analysis of different fibrosis stages indicated that MFAP-4 serum concentration predicts early fibrosis stages and cirrhosis (Fig. 7). MFAP-4 serum levels showed high diagnostic accuracy for the prediction of stage 0 and stage 4 fibrosis (AUC = 0.84, P < 0.0001) as well as stage 1 and stage 4 fibrosis (AUC = 0.89, P < 0.0001). Fibrosis stages 2, 3, and 4 revealed less diagnostic accuracy (AUC = 0.72 or 0.69, P < 0.05). Whereas the comparison of stages 0+1 and stage 2–4 (AUC = 0.75, P < 0.0001) and stages 0 through 3 and stage 4 (AUC = 0.76, P < 0.001) benefits from the combination of fibrosis stages.
Fig. 6.

Box plot and scatter plot of MFAP-4 sera concentration of patients with different hepatic fibrosis stages on HCV infection. The small black circle and the horizontal line mark the mean values and median of the single measurements (triangles) of the different fibrosis stages (F0–F4), respectively; the large boxes constitute 50% of the measurements, whereas the error bars mark the standard deviation.
Fig. 7.
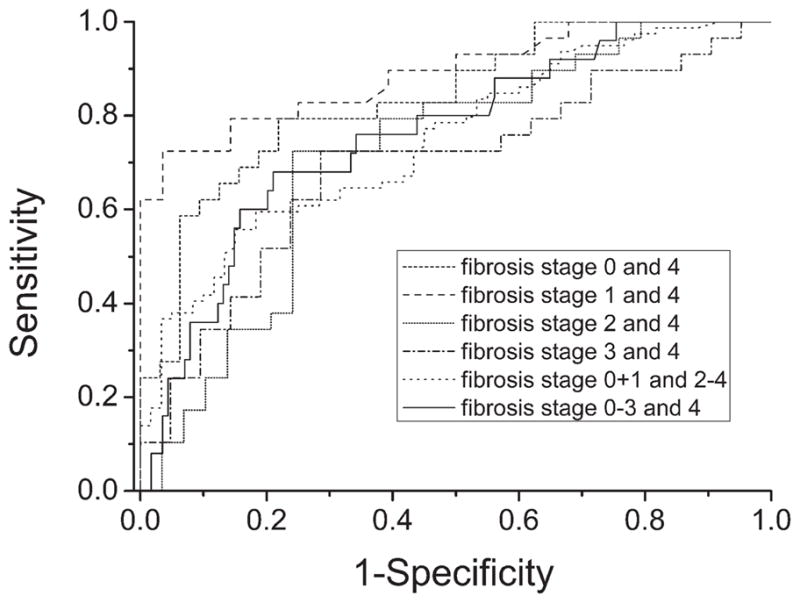
Receiver operating characteristics curves based on MFAP-4 sera concentrations in patients with different fibrosis stages. ROC analyses show high diagnostic accuracies of MFAP-4 serum concentration for early (F0 and F1) and late fibrosis stages (F4).
Discussion
Currently, lack of robust biomarkers still limits evaluation of hepatic fibrosis stages and progression in chronic diseases, especially in HCV infection.12 Liver biopsy remains the gold standard for assessment of hepatic fibrosis, and the METAVIR,17 the Ishak,16 and the Desmet/Scheuer15 staging systems are most commonly used. In all three systems, interobserver variability is described as low, but Abdi et al.23 performed several postmortem biopsies and demonstrated that a valid diagnosis of cirrhosis can be obtained from one specimen in only 80% of cases. Bedossa et al.24 demonstrated that sampling variation of liver fibrosis is an important limitation in assessment of fibrosis by means of liver biopsy. In the past, no significant progress was made in the development of noninvasive biomarkers for clinical trials and to guide clinical usage. Consequently, a key requirement for future diagnostics must be the discovery of valid biomarkers for hepatic fibrosis.
For this purpose, we analyzed human cirrhotic liver tissue by a proteomic approach. In contrast to Poon et al.,25 who profiled serum samples by the means of surface-enhanced laser desorption/ionization mass spectrometry to create a noninvasive model of fibrosis in hepatitis B, we focused on identification of candidate biomarkers using a tissue-based proteomic approach using microdissection. This approach would not only allow us to discriminate between different fibrosis stages but also help us to elucidate the pathological processes of fibrosis. Therefore, we combined 2D electrophoresis analysis with protein fluorescence dye saturation labeling to successfully analyze 2500 to 3500 microdissected cells. Kawada et al.26 demonstrated a predominant localization and number of hepatic stellate cells along the cirrhotic septa during extracellular matrix production. Activated hepatic stellate cells are involved in the development of liver fibrosis, based on their production of extracellular matrix in liver injury.27,28 During liver injury, hepatic stellate cells undergo a process of activation from quiescent “fatstoring” phenotype to a highly proliferative “myofibroblast-like” phenotype. The mechanisms of hepatic stellate cell activation are largely similar between different causes of chronic liver diseases, all of which ultimately lead to cirrhosis.
We applied a subtractive proteomic approach to identify proteins as potential candidate biomarkers that are highly abundant in cirrhotic septa and in low abundance in hepatic parenchymal cells. Manual microdissection offered the advantage of isolating cirrhotic (with numerous activated hepatic stellate cells) and noncirrhotic liver tissue (few, more quiescent hepatic stellate cells). Consequently, only cells in areas of healthy liver parenchyma and along the cirrhotic septa were collected, but other cell material (like eg vessels and fibers) were mainly excluded.
The combination of manual microdissection and 2D-DIGE saturation labeling allowed reliable and reproducible proteome analysis. The protein pattern demonstrates a disturbed cellular homeostasis, impaired mitochondrial and metabolic enzymes, reduced cellular synthesis, and increased expression of cell structure proteins associated with apoptosis in cirrhotic liver cells. In addition to alpha-smooth muscle actin, which is a commonly known protein of hepatic fibrogenesis, novel candidate biomarkers were identified.
Increased Expression of Proteins Involved in Extra-cellular Matrix Synthesis in Cirrhotic Cells
Several tropomyosin isoforms, which are probably synthesized by “myofibroblast-like” activated hepatic stellate cells, were expressed in cirrhotic septa at highest levels ascertained in this study (maximum fold change: 83.1). Tropomyosin isoforms are ubiquitous proteins of 35 to 45 kDa associated with actin filaments of myofibrils and stress fibers. The alpha and beta isoforms of tropomyosin form an alphahelical dimer, bind head to tail, and lie in the major groove of filamentous actin, with each tropomyosin molecule binding to seven actin molecules. Interestingly, Yokoyama et al.29 recently described a decreased expression of tropomyosin in their proteomic analysis of hepatocellular carcinoma, which correlated with progression of hepatocarcinogenesis, leading them to hypothesize that cancer tissues may destroy hepatic cords during metastatic spreading.
Calponin, a basic 34-kDa protein, normally is also specifically expressed in smooth muscle cells and binds calmodulin, actin, and tropomyosin. Again reflecting the “myofibroblast-like” phenotype of activated hepatic stellate cells, calponin was more abundant in cirrhotic septa in this proteomic analysis (18.5-fold change) as well as in cultured human hepatic stellate cells stimulated with transforming growth factor beta, as reported by Ueki et al.30 in 1998.
Another likely protein product of hepatic stellate cells is transgelin (fold change of 15.0), also referred to as transgelin-alpha, a 22-kDa protein with structural similarity to the vertebrate thin filament myofibrillar regulatory protein calponin. Increased gene expression of transgelin in the phase of acute cellular remodelling and activation of hepatic stellate cells with progression of hepatic fibrosis has been demonstrated in vitro31 but not yet in vivo.
Among the induced proteins, human microfibril-associated glycoprotein 4 (41.7-fold change) was especially abundant. MFAP-4 is a ubiquitous protein playing a potential role in extracellular matrix (ECM) turnover during fibrogenesis.32 It contains fibrinogen-like domains and an arg-gly-asp sequence in the N-terminus that serves as the ligand motif for the cell receptor integrin.33,34 An interaction with actin-regulating proteins such as tropomyosin, calponin, and transgelin has not been described. The bovine form displays a calcium-dependent binding to collagen structures of lung surfactant proteins.35 Furthermore, MFAP-4 interacts in a calcium-dependent manner with different collectins in the lung and might fix them in the ECM during inflammation.35 A role in the remodeling process of ECM with collagen interaction in hepatic fibrogenesis can only be hypothesized, because this protein has not yet been implicated in matrix turnover.
Recently, several ECM-related proteins are being incorporated into biomarker panels. These include procollagen I, collagen IV, or enzymes that are involved in ECM regulation YKL-40 (human cartilage glycoprotein 39) and regulators of matrix metalloproteases, including tissue inhibitor of metalloproteinase 1.36 The utility of these ECM remodeling proteins as serum biomarkers of hepatic fibrosis remains unclear. Tropomyosin, for instance, is an intracellular protein, and thus is not ideal for use in non-invasive serum biomarkers of hepatic fibrosis. Nevertheless, it is well known that chronic hepatic injury with perturbation of normal liver homeostasis and hepatocellular necrosis can lead to extracellular release of either free radicals (in other words, “oxidant stress”), intracellular constituents,37 or cytokines and signaling molecules. Sources of these mediators may be circulating (in other words, endocrine), intercellular (in other words, paracrine) or act on the same cell (in other words, autocrine). In addition, this oxidant stress–mediated necrosis may attenuate of stellate cell activation with stronger synthesis of smooth muscle proteins.37 Based on these findings, it is not entirely surprising that these proteins can be detected in higher levels in sera from patients with HCV-associated liver cirrhosis and cirrhosis of other causes.
MFAP-4 and Other Highly Abundant Proteins as Potential New Biomarkers of Hepatic Fibrosis
This study represents the first proteomic analysis of human cirrhotic liver cells in HCV-associated hepatic cirrhosis with successful identification of new potential biomarkers. Immunohistochemical investigation of tropomyosin, transgelin, and MFAP-4 showed that these novel proteins are highly abundant in hepatic stellate cells and cirrhotic ECM, but not in hepatic parenchyma or normal liver. The quantification of MFAP-4 serum samples allowed us to distinguish between patients with cirrhosis and nondiseased patients with high confidence (91.6% sensitivity and 95.6% specificity), exhibiting an excellent diagnostic accuracy to predict early fibrosis stages and cirrhosis. These very promising results have to be validated with larger number of patients and disease controls.
Fibro-Sure Test,12 the most commonly used test for noninvasive assessment of HCV patients with hepatic fibrosis, combines α2-macroglobulin, haptoglobin, apolipoprotein A1, bilirubin, gamma-glutamyl transpeptidase, and alanine aminotransferase serum levels. Fibro-Sure algorithm also considers patient’s age and sex and generates a measure of fibrosis and necroinflammatory activity in liver. However, presence of hemolysis can lead to decreased haptoglobin levels and falsely elevated fibrosis and activity scores.38,39 Furthermore, the cause of hepatic fibrosis must be taken into account, because parameters are different for use of these serum markers in other diseases (for example, non-alcoholic steatohepatitis/alcoholic steatohepatitis Fibro-Sure Test).
Using a cutoff of 0.31, (HCV) Fibro-Sure–negative predictive value for excluding significant fibrosis (prevalence, 0.31) is 91%.12,39 Considering an MFAP-4 serum concentration of 24 U/mL as a decision threshold, non-diseased patients could be identified with at least a comparable specificity of 96%.
Interestingly, MFAP-4 serum concentrations increased significantly with progressive stages (fibrosis stage 0–4) of hepatic fibrosis using 139 patient samples from the Hep-Net collective. The discrimination between different stages of hepatic fibrosis using MFAP-4 serum levels in HCV patients is excellent. Moreover, histological assessment of fibrosis stage 0 (no fibrosis) versus fibrosis stage 1 (portal fibrosis) and fibrosis stage 2 (bridging fibrosis with few septa) versus fibrosis stage 3 (bridging fibrosis with many septa) is difficult in many cases because of sampling variability and heterogeneity within tissue of HCV-infected liver.
Based on these findings, MFAP-4 may represent a novel biomarker for hepatic fibrosis, allowing a noninvasive assessment of hepatic fibrosis and potential evaluation of progression risk using an individual MFAP-4 profile for each patient. If validated prospectively in larger cohorts of patients, this MFAP-4 analysis might facilitate monitoring of HCV patients and thereby influence the decision about whether and when to initiate either antiviral or antifibrotic therapies.
In summary, we have used a rigorous proteomic approach to unearth novel proteins associated with hepatic fibrosis, and we have specifically identified MFAP-4 as a potential serum biomarker worthy of further analysis. Our findings validate the utility of proteomics in identifying novel biomarkers of disease pathogenesis and stage.
Supplementary Material
Acknowledgments
The authors thank Eva Hawranke and Kathy Pfeiffer of the Medizinische Proteom-Center, Bochum, as well as Sabine Roggenbrodt and Birgit Streletzki of the Department of Pathology, Christian Albrechts University, Kiel, Germany, for their excellent technical assistance. Thanks also to Professor Dr. Sergei Viazov, Department of Virology, University-Hospital, Essen for coordination of the serum-samples of the Hep-Net consortia (Hep-Net, supported by Bundesministerium für Bildung und Forschung). To Jon Barbour, many thanks for critical reading of the manuscript.
Supported by the Bundesministerium für Bildung und Forschung (NGFN, FZ 031U119), the Ministry of Innovation, Science, Research and Technology (MI-WFT) of Nordrhein Westfalen, and by U.S. National Institutes of Health grant DK56621 (to S.L.F.).
Abbreviations
- 2D
two-dimensional
- ALD
alcoholic liver disease
- AUC
area under the curve
- DIGE
difference gel electrophoresis
- ECM
extracellular matrix
- ELISA
enzyme-linked immunosorbent assay
- HCV
hepatitis C virus
- HPLC
high-pressure liquid chromatography
- MFAP-4
human microfibril-associated protein 4
- MS
mass spectrometry
- ROC
receiver operating characteristics
Footnotes
Potential conflict of interest: Dr. Reiser is a consultant for Gerson Lehrman and Medacorp.
Additional Supporting Information may be found in the online version of this article.
References
- 1.Minino AM, Heron MP, Murphy SL, Kochanek KD. Deaths: final data for 2004. Nat Vital Stat Rep. 2007;55:1–119. [PubMed] [Google Scholar]
- 2.Friedman SL. Hepatic stellate cells: protean, multifunctional, and enigmatic cells of the liver. Physiol Rev. 2008;88:125–172. doi: 10.1152/physrev.00013.2007. [DOI] [PMC free article] [PubMed] [Google Scholar]
- 3.Dufour DR. Assessment of liver fibrosis: can serum become the sample of choice? Clin Chem. 2005;51:1763–1764. doi: 10.1373/clinchem.2005.056929. [DOI] [PubMed] [Google Scholar]
- 4.Wasley A, Alter MJ. Epidemiology of hepatitis C: geographic differences and temporal trends. Semin Liver Dis. 2000;20:1–16. doi: 10.1055/s-2000-9506. [DOI] [PubMed] [Google Scholar]
- 5.Lederer SL, Walters KA, Proll S, Paeper B, Robinzon S, Boix L, et al. Distinct cellular responses differentiating alcohol- and hepatitis C virus-induced liver cirrhosis. Virol J. 2006;3:98. doi: 10.1186/1743-422X-3-98. [DOI] [PMC free article] [PubMed] [Google Scholar]
- 6.Hoofnagle JH. Hepatitis C: the clinical spectrum of disease. HEPATOLOGY. 1997;26:15S–20S. doi: 10.1002/hep.510260703. [DOI] [PubMed] [Google Scholar]
- 7.Poynard T, Ratziu V, Charlotte F, Goodman Z, McHutchison J, Albrecht J. Rates and risk factors of liver fibrosis progression in patients with chronic hepatitis C. J Hepatol. 2001;34:730–739. doi: 10.1016/s0168-8278(00)00097-0. [DOI] [PubMed] [Google Scholar]
- 8.Manns MP, McHutchison JG, Gordon SC, Rustgi VK, Shiffman M, Reindollar R, et al. Peginterferon alfa-2b plus ribavirin compared with interferon alfa-2b plus ribavirin for initial treatment of chronic hepatitis C: a randomised trial. Lancet. 2001;358:958–965. doi: 10.1016/s0140-6736(01)06102-5. [DOI] [PubMed] [Google Scholar]
- 9.Marcellin P, Asselah T, Boyer N. Fibrosis and disease progression in hepatitis C. HEPATOLOGY. 2002;36(5 Suppl 1):S47–S56. doi: 10.1053/jhep.2002.36993. [DOI] [PubMed] [Google Scholar]
- 10.Olaso E, Friedman SL. Molecular regulation of hepatic fibrogenesis. J Hepatol. 1998;29:836–847. doi: 10.1016/s0168-8278(98)80269-9. [DOI] [PubMed] [Google Scholar]
- 11.Leroy V, De Traversay C, Barnoud R, Hartmann JD, Baud M, Ouzan D, et al. Changes in histological lesions and serum fibrogenesis markers in chronic hepatitis C patients non-responders to interferon alpha. J Hepatol. 2001;35:120–126. doi: 10.1016/s0168-8278(01)00091-5. [DOI] [PubMed] [Google Scholar]
- 12.Poynard T, Imbert-Bismut F, Munteanu M, Ratziu V. FibroTest-Fibro-SURE: towards a universal biomarker of liver fibrosis? Expert Rev Mol Diagn. 2005;5:15–21. doi: 10.1586/14737159.5.1.15. [DOI] [PubMed] [Google Scholar]
- 13.Fabris C, Smirne C, Toniutto P, Colletta C, Rapetti R, Minisini R, et al. Usefulness of six non-proprietary indirect markers of liver fibrosis in patients with chronic hepatitis C. Clin Chem Lab Med. 2008;46:253–259. doi: 10.1515/CCLM.2008.051. [DOI] [PubMed] [Google Scholar]
- 14.Sitek B, Luttges J, Marcus K, Kloppel G, Schmiegel W, Meyer HE, et al. Application of fluorescence difference gel electrophoresis saturation labelling for the analysis of microdissected precursor lesions of pancreatic ductal adenocarcinoma. Proteomics. 2005;5:2665–2679. doi: 10.1002/pmic.200401298. [DOI] [PubMed] [Google Scholar]
- 15.Desmet VJ, Gerber M, Hoofnagle JH, Manns M, Scheuer PJ. Classification of chronic hepatitis: diagnosis, grading and staging. Hepatology. 1994;19:1513–1520. [PubMed] [Google Scholar]
- 16.Knodell RG, Ishak KG, Black WC, Chen TS, Craig R, Kaplowitz N, et al. Formulation and application of a numerical scoring system for assessing histological activity in asymptomatic chronic active hepatitis. Hepatology. 1981;1:431–435. doi: 10.1002/hep.1840010511. [DOI] [PubMed] [Google Scholar]
- 17.Poynard T, Bedossa P, Opolon P. Natural history of liver fibrosis progression in patients with chronic hepatitis C: The OBSVIRC, METAVIR, CLINIVIR, and DOSVIRC groups. Lancet. 1997;349:825–832. doi: 10.1016/s0140-6736(96)07642-8. [DOI] [PubMed] [Google Scholar]
- 18.Klose J, Kobalz U. Two-dimensional electrophoresis of proteins: an updated protocol and implications for a functional analysis of the genome. Electrophoresis. 1995;16:1034–1059. doi: 10.1002/elps.11501601175. [DOI] [PubMed] [Google Scholar]
- 19.Nesterenko MV, Tilley M, Upton SJ. A simple modification of Blum’s silver stain method allows for 30 minute detection of proteins in polyacrylamide gels. J Biochem Biophys Methods. 1994;28:239–242. doi: 10.1016/0165-022x(94)90020-5. [DOI] [PubMed] [Google Scholar]
- 20.Schaefer H, Chervet JP, Bunse C, Joppich C, Meyer HE, Marcus K. A peptide preconcentration approach for nano-high-performance liquid chromatography to diminish memory effects. Proteomics. 2004;4:2541–2544. doi: 10.1002/pmic.200300801. [DOI] [PubMed] [Google Scholar]
- 21.Perkins DN, Pappin DJ, Creasy DM, Cottrell JS. Probability-based protein identification by searching sequence databases using mass spectrometry data. Electrophoresis. 1999;20:3551–3567. doi: 10.1002/(SICI)1522-2683(19991201)20:18<3551::AID-ELPS3551>3.0.CO;2-2. [DOI] [PubMed] [Google Scholar]
- 22.Schlosser A, Thomsen T, Shipley JM, Hein PW, Brasch F, Tornoe I, et al. Microfibril-associated protein 4 binds to surfactant protein A (SP-A) and colocalizes with SP-A in the extracellular matrix of the lung. Scand J Immunol. 2006;64:104–116. doi: 10.1111/j.1365-3083.2006.01778.x. [DOI] [PubMed] [Google Scholar]
- 23.Abdi W, Millan JC, Mezey E. Sampling variability on percutaneous liver biopsy. Arch Intern Med. 1979;139:667–669. [PubMed] [Google Scholar]
- 24.Bedossa P, Dargere D, Paradis V. Sampling variability of liver fibrosis in chronic hepatitis C. HEPATOLOGY. 2003;38:1449–1457. doi: 10.1016/j.hep.2003.09.022. [DOI] [PubMed] [Google Scholar]
- 25.Poon HF, Farr SA, Banks WA, Pierce WM, Klein JB, Morley JE, et al. Proteomic identification of less oxidized brain proteins in aged senescence-accelerated mice following administration of antisense oligonucleotide directed at the Abeta region of amyloid precursor protein. Brain Res Mol Brain Res. 2005;138:8–16. doi: 10.1016/j.molbrainres.2005.02.020. [DOI] [PubMed] [Google Scholar]
- 26.Kawada N, Kristensen DB, Asahina K, Nakatani K, Minamiyama Y, Seki S, et al. Characterization of a stellate cell activation-associated protein (STAP) with peroxidase activity found in rat hepatic stellate cells. J Biol Chem. 2001;276:25318–25323. doi: 10.1074/jbc.M102630200. [DOI] [PubMed] [Google Scholar]
- 27.Friedman SL. Seminars in medicine of the Beth Israel Hospital, Boston: the cellular basis of hepatic fibrosis: mechanisms and treatment strategies. N Engl J Med. 1993;328:1828–1835. doi: 10.1056/NEJM199306243282508. [DOI] [PubMed] [Google Scholar]
- 28.Maher JJ, McGuire RF. Extracellular matrix gene expression increases preferentially in rat lipocytes and sinusoidal endothelial cells during hepatic fibrosis in vivo. J Clin Invest. 1990;86:1641–1648. doi: 10.1172/JCI114886. [DOI] [PMC free article] [PubMed] [Google Scholar]
- 29.Yokoyama Y, Kuramitsu Y, Takashima M, Iizuka N, Toda T, Terai S, et al. Proteomic profiling of proteins decreased in hepatocellular carcinoma from patients infected with hepatitis C virus. Proteomics. 2004;4:2111–2116. doi: 10.1002/pmic.200300712. [DOI] [PubMed] [Google Scholar]
- 30.Ueki N, Ohkawa T, Yamamura H, Takahashi K, Tsutsui T, Kawai Y, et al. Induction of calponin-h1 by transforming growth factor-beta1 in cultured human ito cells, LI90. Biochim Biophys Acta. 1998;1403:28–36. doi: 10.1016/s0167-4889(98)00015-9. [DOI] [PubMed] [Google Scholar]
- 31.Herrmann J, Arias M, Van De Leur E, Gressner AM, Weiskirchen R. CSRP2, TIMP-1, and SM22alpha promoter fragments direct hepatic stellate cell-specific transgene expression in vitro, but not in vivo. Liver Int. 2004;24:69–79. doi: 10.1111/j.1478-3231.2004.00891.x. [DOI] [PubMed] [Google Scholar]
- 32.Gressner OA, Weiskirchen R, Gressner AM. Biomarkers of hepatic fibrosis, fibrogenesis and genetic pre-disposition pending between fiction and reality. J Cell Mol Med. 2007;11:1031–1051. doi: 10.1111/j.1582-4934.2007.00092.x. [DOI] [PMC free article] [PubMed] [Google Scholar]
- 33.Pierschbacher MD, Ruoslahti E. Cell attachment activity of fibronectin can be duplicated by small synthetic fragments of the molecule. Nature. 1984;309:30–33. doi: 10.1038/309030a0. [DOI] [PubMed] [Google Scholar]
- 34.Hynes RO. Integrins: versatility, modulation, and signaling in cell adhesion. Cell. 1992;69:11–25. doi: 10.1016/0092-8674(92)90115-s. [DOI] [PubMed] [Google Scholar]
- 35.Lausen M, Lynch N, Schlosser A, Tornoe I, Saekmose SG, Teisner B, et al. Microfibril-associated protein 4 is present in lung washings and binds to the collagen region of lung surfactant protein D. J Biol Chem. 1999;274:32234–32240. doi: 10.1074/jbc.274.45.32234. [DOI] [PubMed] [Google Scholar]
- 36.Rosenberg WM, Voelker M, Thiel R, Becka M, Burt A, Schuppan D, et al. Serum markers detect the presence of liver fibrosis: a cohort study. Gastroenterology. 2004;127:1704–1713. doi: 10.1053/j.gastro.2004.08.052. [DOI] [PubMed] [Google Scholar]
- 37.Friedman SL. Mechanisms of disease: mechanisms of hepatic fibrosis and therapeutic implications. Nat Clin Pract Gastroenterol Hepatol. 2004;1:98–105. doi: 10.1038/ncpgasthep0055. [DOI] [PubMed] [Google Scholar]
- 38.Poynard T, McHutchison J, Manns M, Myers RP, Albrecht J. Biochemical surrogate markers of liver fibrosis and activity in a randomized trial of peginterferon alfa-2b and ribavirin. Hepatology. 2003;38:481–492. doi: 10.1053/jhep.2003.50319. [DOI] [PubMed] [Google Scholar]
- 39.Poynard T, Imbert-Bismut F, Munteanu M, Messous D, Myers RP, Thabut D, et al. Overview of the diagnostic value of biochemical markers of liver fibrosis (FibroTest, HCV FibroSure) and necrosis (ActiTest) in patients with chronic hepatitis C. Comp Hepatol. 2004;3:8. doi: 10.1186/1476-5926-3-8. [DOI] [PMC free article] [PubMed] [Google Scholar]
Associated Data
This section collects any data citations, data availability statements, or supplementary materials included in this article.