Abstract
Purpose
To validate a method for measuring 3D left ventricular (LV) strain from phase-unwrapped harmonic phase (HARP) images derived from tagged cardiac magnetic resonance imaging (MRI).
Materials and Methods
A set of 40 human subjects were imaged with tagged MRI. In each study HARP phase was computed and unwrapped in each short-axis and long-axis image. Inconsistencies in unwrapped phase were resolved using branch cuts manually placed with a graphical user interface. 3D strain maps were computed for all imaged timeframes in each study. The strain from unwrapped phase (SUP) and displacements were compared to those estimated by a feature-based (FB) technique and a HARP technique.
Results
3D strain was computed in each timeframe through systole and mid diastole in approximately 30 minutes per study. The standard deviation of the difference between strains measured by the FB and the SUP methods was less than 5% of the average of the strains from the two methods. The correlation between peak circumferential strain measured using the SUP and HARP techniques was over 83%.
Conclusion
The SUP technique can reconstruct full 3-D strain maps from tagged MR images through the cardiac cycle in a reasonable amount of time and user interaction compared to other 3D analysis methods.
Keywords: phase unwrapping, branch cuts, harmonic phase, tagged magnetic resonance imaging, left ventricle, 3D strain
INTRODUCTION
Parameters of cardiac left-ventricular (LV) mechanical function are important for diagnosing and managing patients with heart disease and assessing the efficacy of therapies over time. Imaging methods based on magnetic resonance (MR) tagging (1, 2) and displacement encoding with stimulated-echoes (DENSE) (3, 4) have been used to study the regional functional characteristics of the heart. While recent advances in imaging methods (5–8) and post-processing techniques (9, 10) have improved the clinical viability of these techniques, the ability to provide dense 3-D strain maps and torsion measurements throughout the cardiac cycle in a reasonable amount of time is still an active area of research.
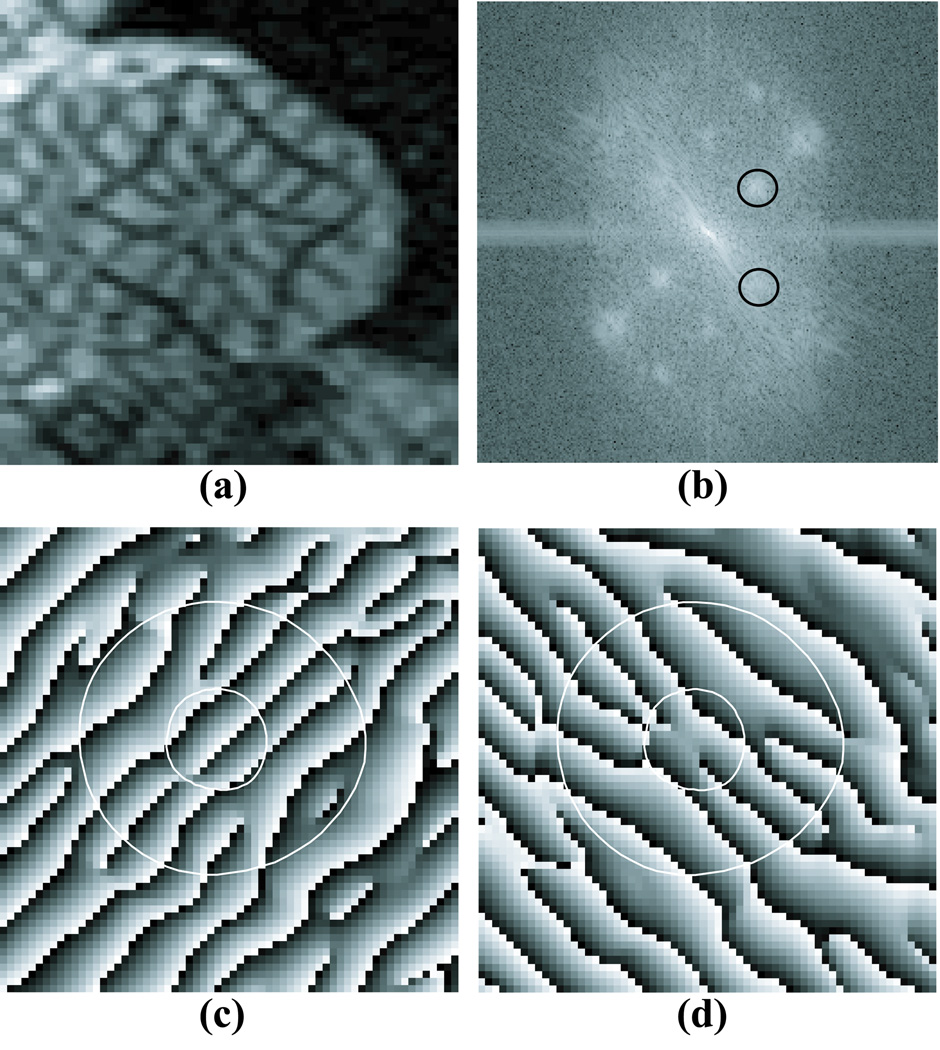
Tagged MRI is an established method for measuring parameters of LV deformation and strain. Tagged MRI spatially modulates the longitudinal magnetization of the underlying tissue before image acquisition. The result is a periodic tag pattern that deforms with the tissue as shown in Figure 1a. Several techniques have been developed to measure LV deformation and strain from the deformation of the tag pattern. These techniques include feature-based (FB) methods (11–15), optical-flow and non-rigid registration based methods (16–19), and HARP-based methods (7, 10, 20, 21).
Figure 1.
(a) A tagged short-axis image acquired near end-systole in a normal human; (b) the Fourier transform log-magnitude of (a); (c) HARP image obtained by band-pass filtering the lower circle in (b); (d) HARP image obtained by band-pass filtering the upper circle in (b).
In HARP analysis, the tag pattern deformation is measured by the local change in phase of the tag pattern. The tag pattern modulates the signal intensity of the image producing a series of peaks in the Fourier domain as shown in Figure 1b. One of these peaks is filtered out and inverse Fourier transformed to produce a HARP phase image as shown in Figures 1c and 1d. The HARP phase at a point in the image is a material property of the underlying tissue and can be tracked through the image sequence or used to compute 2-D strain (10, 22) or 3D strain in the middle third of the LV wall (7). The HARP phase, however, is wrapped because it can only be measured modulo 2π. This wrapping can cause tracking problems if a region of the tissue deforms more than one-half tag spacing i.e. a phase shift of more than π between timeframes. Deformations of this magnitude are possible in both healthy and diseased hearts.
In DENSE imaging (4, 23), myocardial tissue displacement is encoded into the phase of the MR image during acquisition. To reconstruct myocardial displacement from the phase data, the phase must be unwrapped (3, 23, 24), which involves adding integer multiples of 2π to the wrapped phase so that the unwrapped phase is continuous. Noise and imaging artifacts, however, can cause phase inconsistencies where no integer multiple of 2π can yield a continuous unwrapped phase map. While DENSE phase unwrapping continue to improve (3, 24), it is still possible for phase errors to occur, which can result in errors in deformation and strain estimates.
In this paper, a new method is presented for measuring 3D deformation and strain from tagged MRI data based on unwrapping HARP images called Strain from Unwrapped Phase (SUP). In contrast to a recently-proposed 3D wrapped-phase based method in (7), the SUP algorithm can measure strains in the entire LV. The SUP algorithm can also easily measure 3D strains in the entire LV wall over multiple time frames. The SUP approach is more robust to inter-frame motion than techniques such as (7) that are based on tracking wrapped phase. With unwrapped phase, points can be tracked through an image sequence as long as the average inter-frame deformation over the entire myocardium is less than one-half tag spacing. Compared to methods based on tracking tag lines (11, 25), displacement measurements from unwrapped HARP phase images are dense, potentially resulting in more accurate estimates of strain.
MATERIALS AND METHODS
Human Subjects
The SUP algorithm was validated on a cohort of 40 human subjects (10 normal volunteers, 10 patients with myocardial infarction, 10 patients with mitral regurgitation, and 10 patients with hypertension). All human studies were approved by the Institutional Review Boards of both institutions and informed consent was obtained from all participants.
Data Acquisition
All participants underwent MRI on a 1.5T MRI scanner (GE, Milwaukee, WI) optimized for cardiac application. Tagged images were acquired in standard views (2 and 4 chamber long axis and short axis) with a fast gradient-echo cine sequence with the following parameters: FOV = 300 mm, image matrix = 224×256, flip angle = 45, TE = 1.82ms, TR = 5.2ms, number of cardiac phases = 20, slice thickness = 8 mm. A 2D fast gradient recalled spatial modulation of magnetization (FGR-SPAMM) tagging preparation was done with a tag spacing of 7 pixels. This protocol resulted in 2 long-axis slices and on average, 12 short-axis slices per study.
Unwrapping HARP Phase
HARP images (10) were obtained by filtering out a single spectral peak in a tagged image and computing the phase in each pixel of the resulting complex-valued image. These phase images are wrapped because phase can only be computed modulo 2π. Phase unwrapping involves adding integer multiples of 2π to each pixel in the wrapped image so that:
The unwrapped phase is continuous
If the unwrapped phase is re-wrapped, the result is equivalent to the original wrapped image.
The relationship between the wrapped phase ψ (x, y) and the unwrapped phase ϕ(x, y) may be stated as
| (1) |
where W is the wrapping operator. In this paper, phase was unwrapped only inside the LV wall. Pixels outside the myocardium were not processed.
Several phase unwrapping algorithms have been proposed for MRI and other applications (26). In particular, DENSE post-processing involves unwrapping the DENSE phase maps (3, 4, 27). In this paper, a path-following method was used that is similar to the one used for DENSE in (3, 26), where phase was unwrapped along a path in the image from one pixel to another. If the phase is unwrapped correctly, the phase of the destination pixel is independent of the path taken. Two main issues arise with this approach: how to choose the path and how to handle regions of inconsistent phase. The path was chosen by the quality-guided method described below. Phase inconsistencies are called residues and were handled by introducing branch cuts. These methods are described in detail in the following sections.
Quality-Guided Phase Unwrapping
In path-following methods, it is necessary to determine a path that visits each pixel of interest. The phase is unwrapped along this path. Quality-guided algorithms(28) use a quality map, which indicates the pixels’ reliability of the wrapped phase map, to guide the integration path. A starting point was arbitrarily chosen and the next pixel visited was the neighbor with the highest quality. This process was repeated until all pixels of interest were processed. Similar to DENSE (3) algorithms, quality in this paper was defined as the reciprocal of the phase difference variance (29), which is given by
| (2) |
where each sum is over a 3 × 3 window, centered at the pixel (m, n). The terms and are the wrapped phase derivatives, and and are the average of the derivatives in the 3 × 3 window.
Residues and Branch Cuts
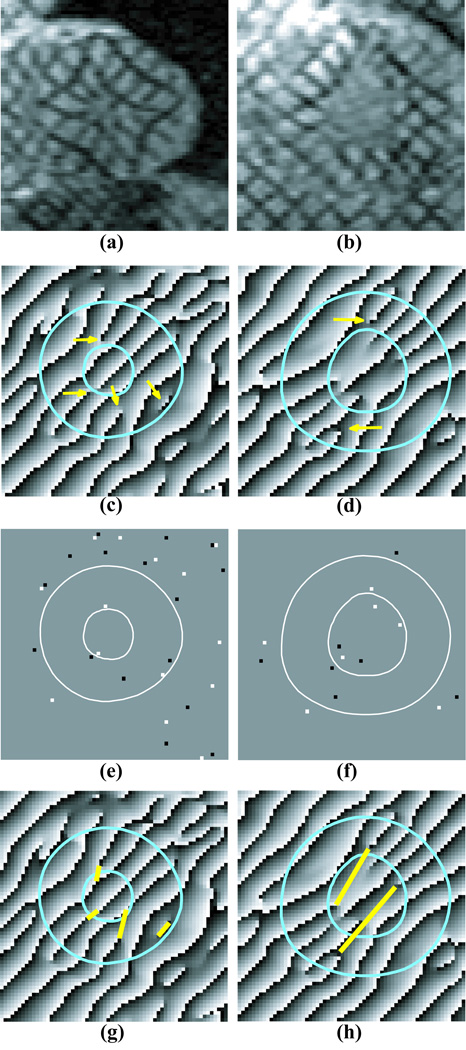
A fundamental assumption in phase unwrapping algorithms is that the unwrapped phase is smooth and that any large changes in phase between pixels are due to phase wrapping. Noise and artifacts, however, can cause inconsistencies in the phase map where the phase difference between pixels is large and cannot be corrected by adding an integer multiple of 2π. Tag fading, myocardial motion, and the presence of boundaries can also cause phase inconsistencies. Examples of phase inconsistencies are shown in Figure 2. +45 degree tag lines disappear before they reach the endocardium at 12 o’clock and 5 o’clock in Figure 2c. Also the tag-like phase wrap near the epicardium at 4 o’clock in Figure 2c is caused by the epicardial boundary. Figure 2d shows a “double wrap” artifact where two tag lines merge (7 o’clock).
Figure 2.
(a–b) Tagged short-axis images acquired near end-systole in two different human subjects; (c–d) HARP images obtained from a and b. Arrows indicate points of phase discontinuity. Cyan contours delineate the myocardium; (e–f) negative (black) and positive (white) residues in the HARP images in (c–d); (g–h) the corresponding HARP phase image with branch cuts drawn(yellow lines).
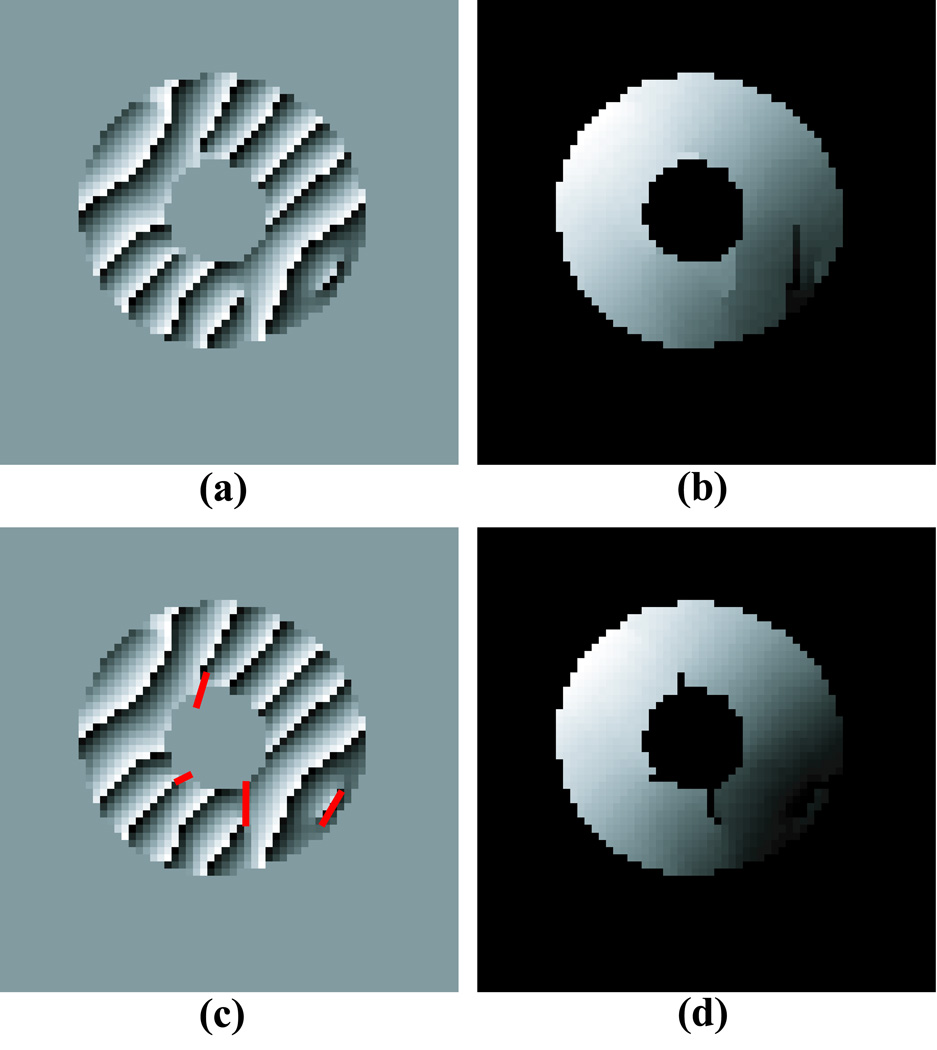
Phase inconsistencies can cause any phase unwrapping algorithm to fail. Figure 3a shows an example of a phase image with inconsistencies. Figure 3b shows the unwrapped phase image obtained with the technique described above. The phase inconsistencies result in discontinuities in the unwrapped phase. In this section we present a method for detecting and correcting for phase inconsistencies using residues and branch cuts.
Figure 3.
Phase Unwrapping example in a short-axis slice of a normal human left ventricle: (a) wrapped HARP phase from Figure 2c; (b) unwrapped HARP image without branch cuts; (c) HARP image with branch cuts shown in red (d) unwrapped HARP image with branch cuts.
Phase inconsistencies were detected using the principle that the wrapped phase difference around any closed path is equal to zero if the wrapped phase is consistent (26). Consequently, these phase inconsistencies were localized by summing the wrapped phase differences around a 2×2 neighborhood of each pixel in the myocardium. It can be shown (26) that this sum is either 0, +2π, or −2π. If the sum is zero, then no phase inconsistency exists. Otherwise, either a positive residue (+2π) or a negative residue (−2π) is present at that pixel. Examples of residues can be seen in Figures 2e and f.
In this paper, phase inconsistencies were corrected using the residue compensation method (26), where residues were removed by connecting residues with branch cuts. Branch cuts are lines in the image where an unwrapping path is not allowed to cross. In our implementation, pixels that touch the branch cut line were removed from the myocardium segmentation. Note that the number of pixels removed due to branch cuts is negligible compared to the total number of pixels used in the 3D deformation model fit described below.
Branch cuts either connect a positive to a negative residue or, if only a region of the image is unwrapped, a residue is connected to a point outside the myocardium segmentation. The problem, of course, is which residues to connect. It is common to see positive and negative residues next to each other in the image (see Figure 2e). These residues are known as dipoles and can be automatically connected by a branch cut.
Connecting non-dipole residues (called monopoles), however, is a difficult problem. In cases where there are an equal number of positive and negative residues, automated methods have been proposed that, for example, minimize the average branch cut length (26, 30). Minimizing branch-cut length, however, does not always yield the best unwrapped phase. As a result, the user must place the branch cuts interactively. This was done quickly with a graphical user interface (GUI).
Figures 2g and h show branch cut placement examples. The phase wraps in the second row of Figure 2 correspond to the +45 direction tag lines. If the phase inconsistency was caused by a prematurely ending tag line (11 o’clock and 5 o’clock in Figure 2c) or tag line merging (7 o’clock in Figure 2d), the branch cuts were placed along the missing or merged tag line. If a phase wrap occurred where there was no tag line (4 o’clock in Figure 2c) the branch cut was placed to remove the spurious phase wrap from the myocardium segmentation.
Once branch cuts were placed, the phase unwrapping technique described above resulted in a smooth unwrapped phase map as shown in Figure 3d. Note that after branch cuts are placed, the unwrapped phase is independent of the path taken during the unwrapping process.
Demodulated HARP Phase
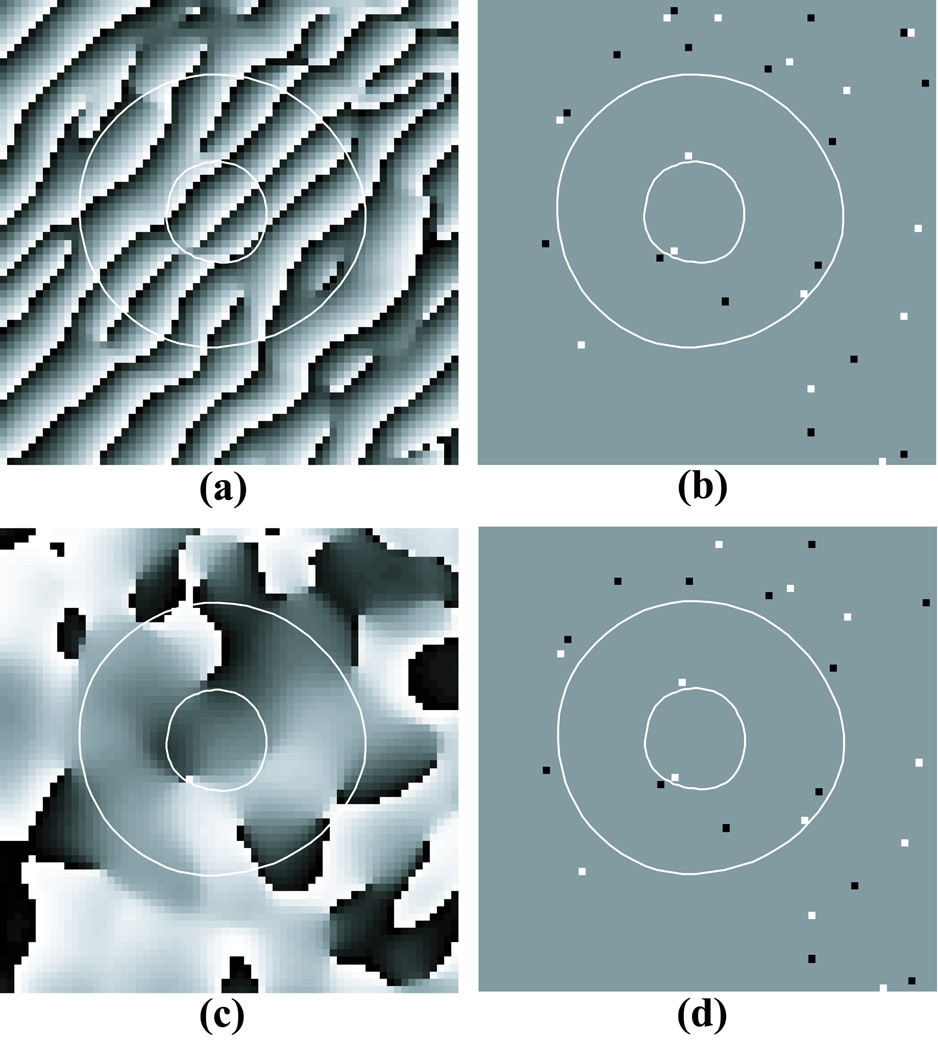
Instead of unwrapping the HARP phase image, one could unwrap the demodulated HARP phase image. The demodulated HARP phase image is computed by shifting the filtered HARP peak to the center of k-space before computing the inverse Fourier transform. Figures 4a and c show the HARP phase and demodulated HARP phase images of the tagged image in Figure 2a. The demodulated HARP phase is similar to the phase obtained with DENSE imaging (31).
Figure 4.
(a) HARP image; (b) negative (black) and positive (white) residues in the HARP image in (a); (c) the corresponding demodulated HARP phase image; (d) residues in the demodulated HARP image in (c).
At first, it might appear that the demodulated phase is easier to unwrap than the modulated HARP phase because there are fewer phase wraps. Phase wraps, however, are usually not a problem for phase unwrapping algorithms. The challenge in phase unwrapping is how to handle phase inconsistencies.
Since phase inconsistencies are mainly caused by tag lines disappearing, tag lines merging, myocardial boundaries and other inherent properties of the tissue being imaged, they appear in both the HARP phase and demodulated HARP phase images. For example, Figures 4b and d show the residues for both the HARP phase and demodulated HARP phase images. The residues in both images are almost identical.
While either the HARP phase or demodulated HARP phase image could be unwrapped, the HARP phase image was used in this paper because the phase wraps correspond to tag lines and provide visual cues that make it easier for the user to place branch cuts as seen in Fig. 3c.
Inter-frame Phase Consistency
Each image was unwrapped independently and the starting point for phase unwrapping may correspond to a different material point in each image. As a result, the unwrapped phases in two adjacent timeframes may differ by an integer multiple of 2π. This difference was corrected by adding the integer multiple of 2π to all unwrapped phases in the current timeframe. In this paper, the multiple was chosen to minimize the L1 norm of all displacements between the current and previous timeframes. Note that this correction assumes that the average deformation of the heart between consecutive frames is less than one-half of the tag spacing. Inter-frame deformation of more than one-half tag spacing in a localized region or regions will not affect the unwrapped phase as long as the average deformation is less than one-half tag spacing.
Motion and Strain Estimation
Calculating 1-D Displacement Measurements
Once the phases were unwrapped, 1-D displacements were measured from each pixel in the myocardium similar to those measured from tag-line tracking data (11). Each 1-D displacement measurement is the displacement of a material point back to its reference position in the direction normal to the tag plane. As in (11, 32, 33), we define the reference time to be the time the tag pattern was applied. Note that this time is several milliseconds before the first image is acquired.
To compute the 1-D displacements, an estimate of the reference phase plane must be computed. The reference phase plane was estimated by fitting a plane to the unwrapped phase plane in the first timeframe in a given slice. This computation is analogous to the one performed in (11, 32, 33) to determine the tag line center and spacing. There can be some motion between the time the tags are applied and the acquisition of the first image, but this is usually small. Since tag lines are parallel when they are applied, the reference phase plane was specified by the 1-D linear equation
| (3) |
where s is a parameter that sweeps out a line perpendicular to the tag line and m and b are parameters of the reference plane fit to the first time frame unwrapped phase.
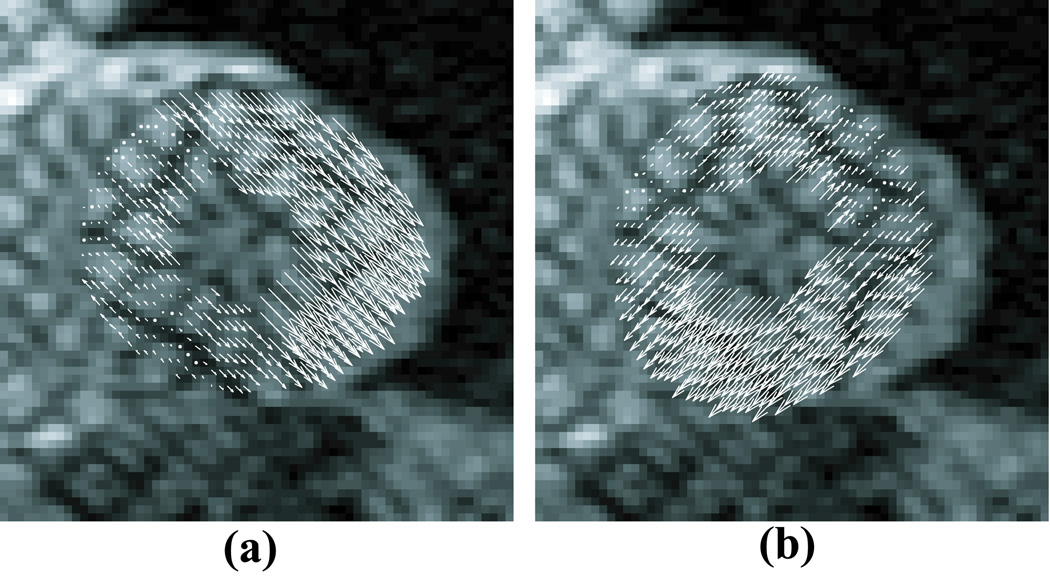
To compute the 1-D displacement measurements, let sd correspond to a point in a deformed image with phase ϕd (sd). From Equation [3], the point in the reference image with the same phase is sr =(ϕd (sd) – b) / m. The displacement measurement is then d = sd – sr. Figure 5 shows an example of displacement estimates measured from a short-axis slice of a normal human volunteer at end-systole. Note that due to through-plane motion a 1-D displacement does not establish a one-to-one correspondence between points at the reference and deformed times. Rather, it is a 1-D constraint on the 3-D displacement of a material point back to its position in the reference time (11, 32, 33).
Figure 5.
1-D displacement vectors superimposed for (a) the +45 and (b) −45 tag directions. The arrows point to the position of the points at the time of tag line imposition.
Segmentation
Segmentation of the myocardium is the first step in most cardiac image analysis procedures (3, 12, 22). Both the phase unwrapping and displacement measurement steps require that the LV wall be segmented in each slice and time of interest. In this algorithm, LV contours were drawn semi-automatically by the user at end-diastole (ED) and end-systole (ES). Non-rigid registration (34) was then used to propagate ED and ES contours to all the time frames. ED contours are used in almost all tagged MRI analysis algorithms to define a material-point mesh or other set of points of interest. ES contours were included because they improve the ability of the propagated contours to distinguish between papillary muscles and the LV wall.
Strain Calculation
The 1-D displacement measurements and a material-point mesh automatically constructed from the ED contours were used to compute 3-D LV deformation and strain in each timeframe. The deformation and strain were reconstructed using the Affine Prolate Spheroidal B-Spline (APSB) method in (35), which fits a B-spline deformation model defined in prolate-spheroidal coordinates to the displacement measurements. First, a backward fit was performed in each timeframe that maps each point back to its undeformed position. A series of forward fits were then performed to compute the trajectory of each point in the material-point mesh through the cardiac cycle. 3-D strain was computed by spatially differentiating the deformation model.
Validation Experiments
The SUP technique was validated on the cohort of 40 human subjects described above. In each subject, 3D strain was computed in all imaged timeframes using the SUP technique. 3D strain was computed at end-systole (ES) with the feature-based (FB) technique in (35). Both the FB and SUP methods use the APSB deformation model described in [34]. The tags were tracked using the FB technique and then manually corrected by an expert. 2D strain in each timeframe was computed using HARP analysis (10).
To assess the accuracy of 1D displacement measurements obtained from unwrapped phase images, 1D displacement measurements were computed from tag lines tracked in the FB method and compared to 1D measurements computed from the unwrapped phase images at the tracked tag line points.
The accuracy of 3D strains at end-systole was assessed by comparing SUP strains and FB strains with a paired t-test. The accuracy of strains versus time was assessed by comparing peak strains and strain rates computed using SUP and HARP with paired t-tests. In all statistical comparisons, a P value of 0.05 or less was considered statistically significant.
RESULTS
Computation Time
All studies were processed using the SUP technique described above, which was implemented in MATLAB (The Mathworks Inc, Natick, MA). Unwrapping all images in a study took less than a minute on a 2.6GHz Core2 Duo processor with 4 GB of memory. Approximately 30 minutes per study of user interaction were required to resolve residues. Strain reconstruction took approximately 15 minutes per study. The total time required to analyze 20 time frames of a typical study was 45 minutes.
Quantitative Comparisons
Comparison of Displacement Estimates with Feature-Based Technique
Table 1 shows statistics of the differences between 1D displacement measurements computed from unwrapped phase images and tracked tag lines at end-systole. The SUP and tag line methods showed excellent agreement on long-axis images and short-axis images in the proximal and middle thirds of the LV (relative to the base). The mean differences are few hundredths of pixel, which means there is no bias toward under or over estimation of displacement. The difference standard deviation is around 1/3 of pixel, which is close to the tag line tracking accuracy (33, 36). In three slices at or next to the apex, (out of a total of 429 processed) the maximum difference was large (~8 pixels) due to partial volume effects that severely diminished the contrast-to-noise ratio (CNR). These slices were removed from the differences in Table 1, but left in for the comparison of strains in subsequent comparisons.
Table 1.
Comparison of displacement measurements computed from SUP at tracked tag lines at end-systole. Proximal, middle, and distal refer to the LV base.
| Slices | Mean Difference | Standard Deviation | Maximum Difference |
|---|---|---|---|
| All slices | 0.0012 | 0.3963 | |
| 4-Chamber | −0.0263 | 0.3364 | 2.0479 |
| 2-Chamber | 0.0052 | 0.3349 | 2.7517 |
| Short-axis – Proximal 3rd | −0.0170 | 0.3572 | 2.5694 |
| Short-axis - Middle 3rd | −0.0217 | 0.3299 | 2.4348 |
| Short-axis – Distal 3rd | 0.0787 | 0.5625 | 2.9898 |
Difference = SUP – tag line. All measurements are in pixels. RMSE = root mean squared error.
Comparison of End-Systolic Strains with Feature-Based Technique
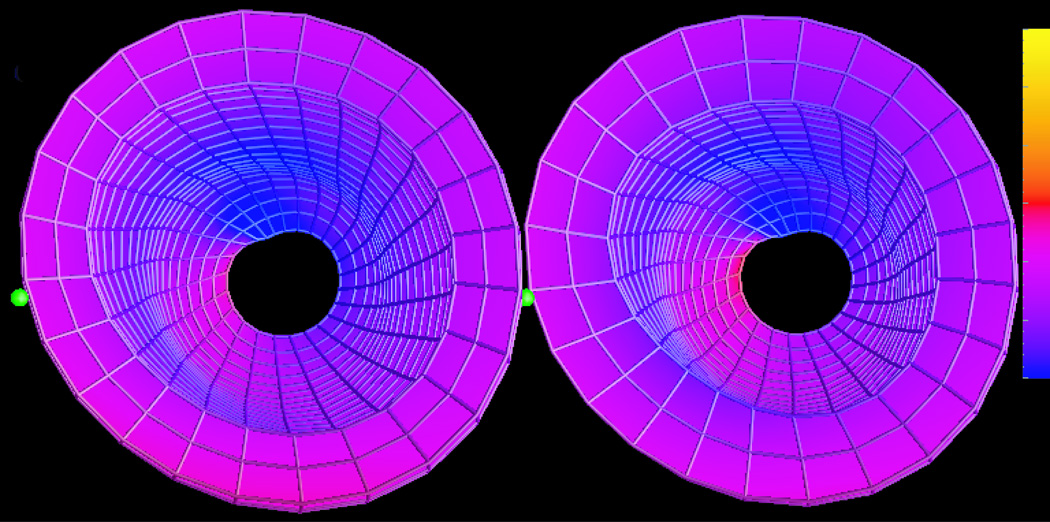
Figure 6 shows the maps of 3D circumferential strain (Ecc) in a representative normal human volunteer computed using SUP method and the FB method. The same material-point mesh and deformation model were used to reconstruct strain in both methods. Note that strain is computed in the entire LV, except the apex which is typically not included in this type of analysis. The strain maps are similar.
Figure 6.
Maps of circumferential strain (Ecc) using feature-based (left) and unwrapped phase (right) methods. Strains are mapped from blue = −30% to yellow = +30%. The green balls denote the basal mid septum.
Table 2 shows statistics of the difference between the SUP and FB methods. In all strains in Table 2, the standard deviation of the difference is less than 5% of the average of the two methods. The correlation between the methods is strongest in circumferential strain. Only two long-axis images were acquired, so the correlation in longitudinal strain (Ell) and torsion is lower, but still good. In fact, the SUP method may provide more accurate measurements of Ell, torsion and other strains than the FB method, but further investigation is needed to support this claim.
Table 2.
Comparison of 3D, end-systolic strains computed from strain from unwrapped phase (SUP) and feature-based (FB) methods.
| Strain | Differences | p | ρ | p | CV |
|---|---|---|---|---|---|
| Ecc | 0.0009 ± 0.0017 | 0.9105 | 0.9613 | <0.001 | 2.037% |
| Ell | −0.0022 ± 0.0019 | 0.7752 | 0.9351 | <0.001 | 2.881% |
| Emin | −0.0028 ± 0.0019 | 0.6717 | 0.9201 | <0.001 | 1.591% |
| Torsion | −0.3498 ± 0.2251 | 0.5757 | 0.8697 | <0.001 | 3.662% |
Differences = SUP-FB. Differences = Mean ± Standard Error. ρ = Correlation coefficient. CV = coefficient of variation. Ecc = Circumferential shortening strain. Ell = Longitudinal shortening strain. Emin = Maximal shortening strain.
Comparison with HARP Strains
Table 3 shows statistics of the difference between the 3D strains calculated from SUP and the 2D strains from the HARP method(10). 2D LV torsion using HARP was measured using the procedure described in (20). One slice each at the basal and apical levels was used to compute torsion. The basal slice chosen was the slice closest to and below the mitral valve at the end-systolic (ES) phase. The apical slice chosen was the slice closest to the apex where the blood pool could be identified. A mesh consisting of 3 concentric rings and 24 circumferential points was defined in each slice at end-diastole (ED) from semi-automatically-drawn contours. Each mesh was tracked through all time frames using the improved harmonic phase (HARP) method for motion tracking (21).
Table 3.
Comparison of strains and torsion using the strain from unwrapped phase (SUP) and HARP methods.
| Strain | Differences | p | ρ | p | CV |
|---|---|---|---|---|---|
| Ecc | |||||
| Peak Strain | −0.0223 ± 0.0005 | 0.004 | 0.8361 | <0.001 | 3.909% |
| Systolic Rate | −0.1004 ± 0.0024 | 0.011 | 0.8387 | <0.001 | 3.494% |
| Early-Diastolic Rate | −0.0494 ± 0.0068 | 0.502 | 0.6615 | <0.001 | 8.100% |
| Ell | |||||
| Peak Strain | −0.0217 ± 0.0005 | <0.001 | 0.7023 | <0.001 | 4.926% |
| Systolic Rate | 0.0657 ± 0.0042 | 0.132 | 0.6240 | <0.001 | 6.407% |
| Early-Diastolic Rate | −0.2091 ± 0.0111 | 0.052 | 0.5739 | <0.001 | 12.771% |
| Torsion | |||||
| Peak Strain | −0.0036 ± 0.1092 | 0.998 | 0.6567 | <0.001 | 6.999% |
| Systolic Rate | −9.4941 ± 0.5079 | 0.069 | 0.649 | <0.001 | 7.053 |
| Early-Diastolic Rate | 3.9996 ± 0.8812 | 0.533 | 0.2578 | 0.108 | 10.408% |
Difference = SUP - HARP. Differences = Mean ± Standard Error. ρ = Correlation coefficient. CV = coefficient of variation. Ecc = Circumferential shortening strain. Ell = Longitudinal shortening strain. Emin = Maximal shortening strain.
The peak strain and systolic strain rate of the measured circumferential strain show a high correlation. Correlation in longitudinal strain is lower because the SUP method uses 3D deformation model fitting to compute longitudinal strain from the motion of all tag points, whereas HARP computes strain from two long-axis images. Also, the tag line CNR decreases through the cycle due to T1 decay of the tag pattern, so early diastolic correlations are lower than correlations for peak strain and systolic strain rate. It was seen that HARP in general underestimated the strains as compared to the SUP method. This could be attributed to the improved accuracy of tracking using the SUP method as a result of removal of inconsistencies in the HARP image using branch cuts.
A few degrees of difference was seen in comparison of peak torsion. The 3D method corrects for the through-plane motion, but the 2D method tracks points in a given slice through time. In the 2D method, the tracked points in the basal slice start out near mid-ventricle and become more basal through systole. Since the base typically rotates more than the mid-ventricle, though-plane motion can distort the 2D rotation and torsion curves.
SUP Strains in Normals and Patients
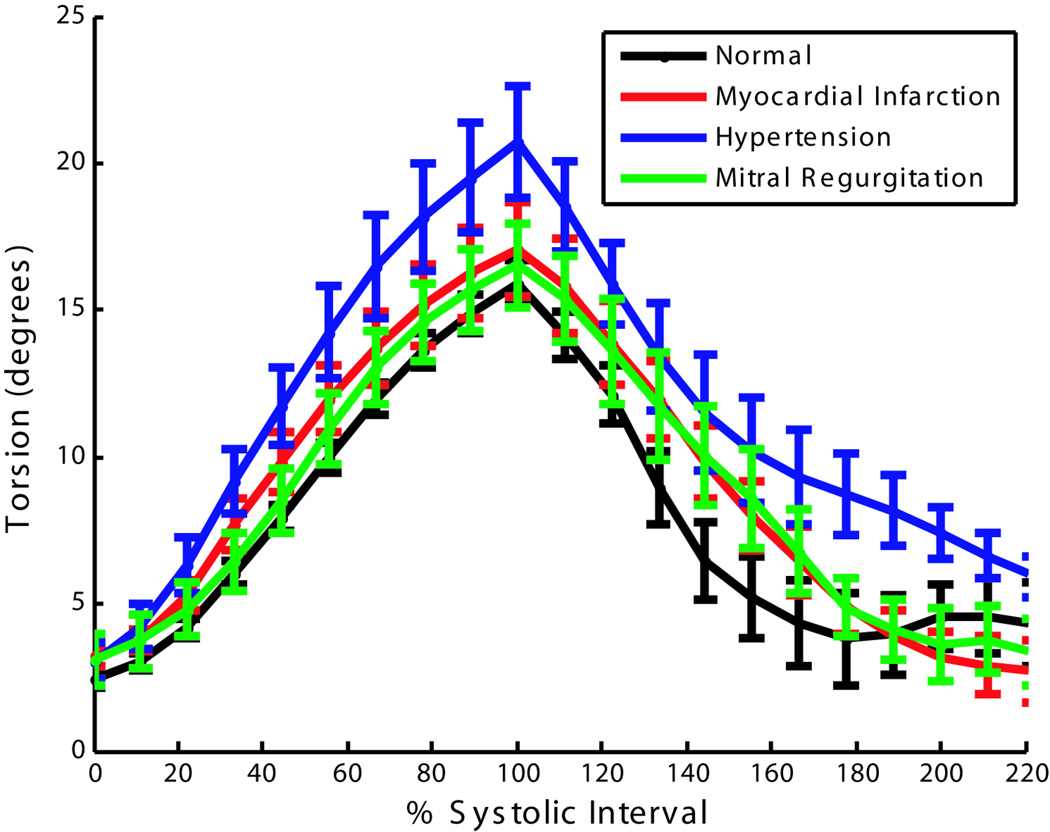
Figure 7 shows plots of torsion versus time averaged over 10 normal human volunteers, 10 patients with myocardial infarction, 10 patients with hypertension and 10 patients with mitral regurgitation. The hypertensive patients showed an increase in torsion, which has been reported in the clinical literature (37). The untwisting in early-diastole was slower for patients with mitral regurgitation as compared to normal human volunteers, which is consistent with previously reported results (38).
Figure 7.
Torsion angle (rotation of the apex relative to the base) versus % systolic interval averaged over 10 normal human volunteers, 10 patients with myocardial infarction, 10 patients with hypertension and 10 patients with mitral regurgitation. Error bars represent ± one standard error.
DISCUSSION
The SUP method was presented for measuring 3D strain from tagged MRI. Strains computed using SUP demonstrate excellent agreement with a previously-published feature-based method . Some user interaction is also required to resolve phase-unwrapping residues (especially later in the cycle), but the SUP method can compute strains in the entire LV instead of just the middle third.
The time required for the SUP measured 3D strains in the entire LV over 20 time frames is approximately 45 minutes per study. The same analysis using the feature-based method would require approximately 3 hours.
While the tagged imaging protocol used in this paper is commercially available and is widely used clinically, advanced tagged imaging techniques such as Complementary SPAMM, can yield a higher tag CNR throughout the cardiac cycle. Higher CNR images will result in fewer phase inconsistencies and less user interaction will be required to correct them.
The use of residues to automatically detect phase inconsistencies in wrapped phase images and the use of branch cuts to correct them can also be used in unwrapping the phase in DENSE imaging.
Spottiswoode et.al(3) used a spatio-temporal method of phase unwrapping to maintain inter-frame phase consistency in DENSE images where a group of pixels are selected in the first time frame and these pixels are sequentially unwrapped in each successive timeframe. This technique works well in DENSE images because there are only a few phase wraps across the myocardium. The SUP method, however, is based on HARP images, which make it easier to place branch cuts. HARP images have 6–10 phase wraps across the myocardium. Temporal phase unwrapping in HARP images is sensitive to large (greater than one-half tag spacing) interframe displacements. Therefore, we used a method based on the phase of the entire myocardium over time to maintain phase consistency. This allows for local tissue to have displacements greater than one-half tag-spacing between timeframes as long as the average deformation of tissue between timeframes is less than one-half tag-spacing.
The SUP technique reconstructs full 3-D strain maps from tagged MR images through the cardiac cycle, and takes into account the through-plane motion of the heart. Slice-following DENSE (23), zHARP (5) and HARP-SENC (6) can account for through-plane motion, but these techniques require two breath-holds per slice. In contrast, tagged images can be acquired with multiple slices per breath hold which allows the entire LV to be imaged in significantly less time.
In conclusion, the strain from unwrapped phase (SUP) method can compute 3-D strains in the LV through the cardiac cycle in a reasonable amount of time and user interaction compared to other 3D analysis methods.
Acknowledgments
Grant Support: NIH NHLBI grant P50-HL077100.
REFERENCES
- 1.Ryf S, Spiegel MA, Gerber M, Boesiger P. Myocardial tagging with 3D-CSPAMM. Journal of Magnetic Resonance Imaging. 2002;16(3):320–325. doi: 10.1002/jmri.10145. [DOI] [PubMed] [Google Scholar]
- 2.Zerhouni EA, Parish DM, Rogers WJ, Yang A, Shapiro EP. Human heart: tagging with MR imaging--a method for noninvasive assessment of myocardial motion. Radiology. 1988;169(1):59–63. doi: 10.1148/radiology.169.1.3420283. [DOI] [PubMed] [Google Scholar]
- 3.Spottiswoode BS, Zhong X, Hess AT, et al. Tracking Myocardial Motion From Cine DENSE Images Using Spatiotemporal Phase Unwrapping and Temporal Fitting. Medical Imaging, IEEE Transactions on. 2007;26(1):15–30. doi: 10.1109/TMI.2006.884215. [DOI] [PubMed] [Google Scholar]
- 4.Aletras AH, Balaban RS, Wen H. High-Resolution Strain Analysis of the Human Heart with Fast-DENSE. Journal of Magnetic Resonance. 1999;140(1):41–57. doi: 10.1006/jmre.1999.1821. [DOI] [PubMed] [Google Scholar]
- 5.Abd-Elmoniem KZ, Stuber M, Prince JL. Direct three-dimensional myocardial strain tensor quantification and tracking using zHARP. Medical Image Analysis. 2008;12(6):778–786. doi: 10.1016/j.media.2008.03.008. [DOI] [PMC free article] [PubMed] [Google Scholar]
- 6.Sampath S, Osman NF, Prince JL. A combined harmonic phase and strain-encoded pulse sequence for measuring three-dimensional strain. Magnetic Resonance Imaging. 2009;27(1):55–61. doi: 10.1016/j.mri.2008.05.020. [DOI] [PMC free article] [PubMed] [Google Scholar]
- 7.Pan L, Prince JL, Lima JAC, Osman NF. Fast tracking of cardiac motion using 3D-HARP. Biomedical Engineering, IEEE Transactions on. 2005;52(8):1425–1435. doi: 10.1109/TBME.2005.851490. [DOI] [PubMed] [Google Scholar]
- 8.Sampath S, Prince JL. Automatic 3D tracking of cardiac material markers using slice-following and harmonic-phase MRI. Magnetic Resonance Imaging. 2007;25(2):197–208. doi: 10.1016/j.mri.2006.09.033. [DOI] [PubMed] [Google Scholar]
- 9.Tecelão SRR, Zwanenburg JJM, Kuijer JPA, Marcus JT. Extended harmonic phase tracking of myocardial motion: Improved coverage of myocardium and its effect on strain results. Journal of Magnetic Resonance Imaging. 2006;23(5):682–690. doi: 10.1002/jmri.20571. [DOI] [PubMed] [Google Scholar]
- 10.Osman NF, McVeigh ER. Imaging Heart Motion Using Harmonic Phase MRI IEEE Transactions on Medical. Imaging. 2000;19(3):186–202. doi: 10.1109/42.845177. [DOI] [PubMed] [Google Scholar]
- 11.Denney TS, Jr., Prince JL. Reconstruction of 3-D left ventricular motion from planar tagged cardiac MR images: an estimation theoretic approach. Medical Imaging, IEEE Transactions on. 1995;14(4):625–635. doi: 10.1109/42.476104. [DOI] [PubMed] [Google Scholar]
- 12.Guttman MA, Prince JL, Mcveigh ER. Tag and Contour Detection in Tagged MR Images of the Left Ventricle. IEEE Transactions on Medical Imaging. 1994;13(1):74–88. doi: 10.1109/42.276146. [DOI] [PubMed] [Google Scholar]
- 13.Qian Z, Montillo A, Metaxas D, Axel L. Segmenting MRI Tagging Lines using Gabor Filter Banks; Proceedings of IEEE International Conference on the Engineering in Medical and Biology Society; 2003. pp. 630–633. [Google Scholar]
- 14.Denney TS., Jr. Estimation and Detection of Myocardial Tags in MR Image Without User-Defined Myocardial Contours. IEEE Transactions on Medical Imaging. 1999;18(4):330–334. doi: 10.1109/42.768842. [DOI] [PubMed] [Google Scholar]
- 15.Xiang Deng TSD., Jr. Combined tag tracking and strain reconstruction from tagged cardiac MR images without user-defined myocardial contours. Journal of Magnetic Resonance Imaging. 2005;21(1):12–22. doi: 10.1002/jmri.20234. [DOI] [PubMed] [Google Scholar]
- 16.Ledesma-Carbayo MJ, Derbyshire JA, Sampath S, Santos A, Desco M, McVeigh ER. Unsupervised estimation of myocardial displacement from tagged MR sequences using nonrigid registration. Magnetic Resonance in Medicine. 2008;59(1):181–189. doi: 10.1002/mrm.21444. [DOI] [PubMed] [Google Scholar]
- 17.Denney TS, Jr., Prince JL. Optimal brightness functions for optical flow estimation of deformable motion. Image Processing, IEEE Transactions on. 1994;3(2):178–191. doi: 10.1109/83.277899. [DOI] [PubMed] [Google Scholar]
- 18.Chandrashekara R, Mohiaddin RH, Rueckert D. Analysis of 3-D myocardial motion in tagged MR images using nonrigid image registration. Medical Imaging, IEEE Transactions on. 2004;23(10):1245–1250. doi: 10.1109/TMI.2004.834607. [DOI] [PubMed] [Google Scholar]
- 19.Prince JL, Gupta SN, Osman NF. Bandpass optical flow for tagged MRI. Med Phys. 2000;27(1):108–118. doi: 10.1118/1.598862. [DOI] [PubMed] [Google Scholar]
- 20.Liu W, Chen J, Ji S, et al. Harmonic phase MR tagging for direct quantification of Lagrangian strain in rat hearts after myocardial infarction. Magn Reson Med. 2004;52(6):1282–1290. doi: 10.1002/mrm.20276. [DOI] [PubMed] [Google Scholar]
- 21.Khalifa A, Youssef ABM, Osman N. Improved Harmonic Phase (HARP) Method for Motion Tracking a Tagged Cardiac MR images; International Conference on the Engineering in Medical and Biology Society; 2005. pp. 4298–4301. [DOI] [PubMed] [Google Scholar]
- 22.Osman NF, Kerwin WS, McVeigh ER, Prince JL. Cardiac motion tracking using CINE harmonic phase (HARP) magnetic resonance imaging. Magn Reson Med. 1999;42(4):1048–1060. doi: 10.1002/(sici)1522-2594(199912)42:6<1048::aid-mrm9>3.0.co;2-m. [DOI] [PMC free article] [PubMed] [Google Scholar]
- 23.Aletras AH, Ding S, Balaban RS, Wen H. DENSE: Displacement Encoding with Stimulated Echoes in Cardiac Functional MRI. Journal of Magnetic Resonance. 1999;137(1):247–252. doi: 10.1006/jmre.1998.1676. [DOI] [PMC free article] [PubMed] [Google Scholar]
- 24.Wen H, Marsolo KA, Bennett EE, et al. Adaptive Postprocessing Techniques for Myocardial Tissue Tracking with Displacement-encoded MR Imaging. Radiology. 2008;246(1):229–240. doi: 10.1148/radiol.2461070053. [DOI] [PMC free article] [PubMed] [Google Scholar]
- 25.Xiang D, Denney TS., Jr Three-dimensional myocardial strain reconstruction from tagged MRI using a cylindrical B-spline model. Medical Imaging, IEEE Transactions on. 2004;23(7):861–867. doi: 10.1109/TMI.2004.827961. [DOI] [PubMed] [Google Scholar]
- 26.Ghiglia DC, Pritt MD. Two-dimensional phase unwrapping : theory, algorithms, and software. New York: Wiley; 1998. p. 494. [Google Scholar]
- 27.Kim D, Gilson WD, Kramer CM, Epstein FH. Myocardial Tissue Tracking with Two-dimensional Cine Displacement-encoded MR Imaging: Development and Initial Evaluation. Radiology. 2004:2303021213. doi: 10.1148/radiol.2303021213. [DOI] [PubMed] [Google Scholar]
- 28.Flynn TJ. Consistent 2-D phase unwrapping guided by a quality map; Geoscience and Remote Sensing Symposium, 1996 IGARSS '96 'Remote Sensing for a Sustainable Future', International; 1996. pp. 2057–2059. vol.2054. [Google Scholar]
- 29.Pritt MD. Phase unwrapping by means of multigrid techniques for interferometric SAR. Geoscience and Remote Sensing, IEEE Transactions on. 1996;34(3):728–738. [Google Scholar]
- 30.Zebker HA, Lu Y. Phase unwrapping algorithms for radar interferometry: residue-cut, least-squares, and synthesis algorithms. J Opt Soc Am A. 1998;15(3):586–598. [Google Scholar]
- 31.Kuijer JPA, Hofman MBM, Zwanenburg JJM, Marcus JT, Rossum ACv, Heethaar RM. DENSE and HARP: Two views on the same technique of phase-based strain imaging. Journal of Magnetic Resonance Imaging. 2006;24(6):1432–1438. doi: 10.1002/jmri.20749. [DOI] [PubMed] [Google Scholar]
- 32.Declerck J, Denney TS, Ozturk C, O'Dell W, McVeigh ER. Left ventricular motion reconstruction from planar tagged MR images: a comparison. Physics in Medicine and Biology. 2000;45(6):1611–1632. doi: 10.1088/0031-9155/45/6/315. [DOI] [PMC free article] [PubMed] [Google Scholar]
- 33.Denney TS, McVeigh ER. Model-Free Reconstruction of Three-Dimensional Myocardial Strain From Planar Tagged MR Images. J Magn Reson Imaging. 1997;7(5):799–810. doi: 10.1002/jmri.1880070506. [DOI] [PMC free article] [PubMed] [Google Scholar]
- 34.Feng W, Gupta H, Lloyd SG, Italia LD., Jr Myocardial contour propagation in cine cardiac MRI; Proceedings of 15th Meeting of the International Society for Magnetic Resonance in Medicine; Berlin. 2007. May, p. 766. TSD. [Google Scholar]
- 35.Li J, Denney TS. Left ventricular motion reconstruction with a prolate spheroidal B-spline model. Phys Med Biol. 2006;51(3):517–537. doi: 10.1088/0031-9155/51/3/004. [DOI] [PubMed] [Google Scholar]
- 36.Denney TS, Jr., Yan BLGL. Unsupervised reconstruction of a three-dimensional left ventricular strain from parallel tagged cardiac images. Magnetic Resonance in Medicine. 2003;49(4):743–754. doi: 10.1002/mrm.10434. [DOI] [PubMed] [Google Scholar]
- 37.Stuber M, Scheidegger MB, Fischer SE, et al. Alterations in the local myocardial motion pattern in patients suffering from pressure overload due to aortic stenosis. Circulation. 1999;100(4):361–368. doi: 10.1161/01.cir.100.4.361. [DOI] [PubMed] [Google Scholar]
- 38.Borg AN, Harrison JL, Argyle RA, Ray SG. Left ventricular torsion in primary chronic mitral regurgitation. Heart. 2008;94(5):597–603. doi: 10.1136/hrt.2007.126284. [DOI] [PubMed] [Google Scholar]


