Abstract
Intramyocardial reentry is implicated as a primary cause of the most deadly cardiac arrhythmias known as polymorphic ventricular tachycardia and ventricular fibrillation. However, the mechanisms involved in the triggering of such reentry and controlling its subsequent dynamics remain poorly understood. One of the major obstacles has been a lack of adequate tools that would enable 3D imaging of electrical excitation and reentry inside thick ventricular wall. Here, we present a new experimental technique, termed alternating transillumination (AT), aimed at filling this gap. The AT technique utilizes a recently synthesized near-infrared fluorescent voltage-sensitive dye, DI-4-ANBDQBS. We apply AT to study the dynamics of reentry during shock-induced polymorphic ventricular tachycardia in pig myocardium.
I. Introduction
Optical mapping using voltage-sensitive fluorescent dyes is a well-established technique, widely used in cardiac electrophysiology to study dynamic phenomena [1], in particular reentry (also known as spiral waves). However, until recently, it was used primarily for mapping surface activation. Several groups are currently exploring the possibility of extending optical mapping for extracting 3D information. One such avenue is using transillumination. During transillumination imaging, the light source and the camera are located on different sides of the ventricular wall. As a result, the camera collects the light that crossed the ventricular wall and thus contains information about intramural excitation.
Although the concept of transillumination mapping was introduced almost a decade ago [2], it did not find much use due to a poor penetration of blue-green light into myocardial tissue. The situation has dramatically changed after the development of near-infrared voltage-sensitive dyes [3], which in thick ventricular preparations, increases the transillumination signal by almost two orders of magnitude. This provided motivation for revisiting the concept of transillumination mapping.
In this study, we implement the so-called alternating transillumination technique (AT). Our earlier studies suggest that the data acquired using AT can be used for 3D tomographic reconstructions of intramyocardial excitation fronts [4] as well as for tracking tornado-like organization centers of 3D reentry named filaments [5].
Here, we provide a brief description of the AT method, as well as experimental illustrations of its applications. Specifically, we monitor filament dynamics inside a thick ventricular wall during the first seconds of electrically induced ventricular tachycardia.
II. Material and methods
A. Experimental Protocol
All experimental protocols conformed to the Guide for the Care and Use of Laboratory Animals and were approved by the Committee for the Humane Use of Animal of SUNY Upstate Medical University. The experiments were conducted in coronary perfused pig right ventricular wall preparations. Pigs (20 – 25 kg) were anesthetized with sodium pentobarbital (35 mg/kg i.v.) and the heart was quickly excised. The right ventricle was then isolated and the right coronary artery was cannulated. Subsequently, the ventricle was stretched on a plastic frame and placed vertically in a glass perfusion chamber as shown in figure 1. The preparation was perfused at a constant pressure of 80 mmHg with warm oxygenated Tyrode’s solution. To avoid temperature gradients between the surface and the internal myocardial layers, the tissue was superfused with the same Tyrode’s solution, heated to 37°C. After placement into the perfusion chamber, the ventricle was stimulated at 500 ms BCL through a point electrode with stimulus amplitude of 1.5 thresholds. After 30 minutes of equilibration, an electromechanical uncoupler (diacetyl monoxime, 10 mM) was added to the perfusate to abolish motion artifacts. Subsequently, the tissue was stained with a near-infrared voltage-sensitive dye, DI-4-ANBDQBS at a concentration of 40 μM via a bolus injection [3]. Arrhythmias were induced by a premature field stimulus (S2) applied across ventricular wall through a pair of silver electrodes located near the endocardial and epicardial surfaces of the preparation. The strength of the S2 was set to 1.5–2 diastolic thresholds.
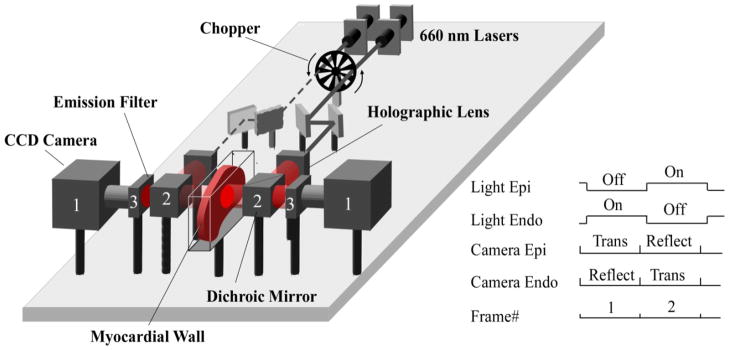
Figure 1. Alternating transillumination system.
The chopper modulates two laser beams to produce alternating illumination of either the epicardial or endocardial sides of the myocardial wall. The panel shows the phase when the beam from the left laser (dashed line) is blocked by the chopper, while the right beam (solid line) passes through. Before reaching the myocardium, each beam is expanded by a holographic lens and is directed towards the surface via a dichroic mirror (2). After passing through the dichroic mirrors (2) and long pass filters (3) located on both sides of the preparation, the emitted voltage-dependent fluorescent signals are recorded simultaneously with two fast CCD cameras (1). The synchronization diagram of the cameras and the chopper is shown on the right inset. “Trans” and “Reflect” indicate the cameras’ recording modes (reflection versus transillumination).
B. Alternating Transillumination system
The schematic of our AT system is shown in figure 1. The system has two identical illumination and recording channels, located symmetrically around the glass chamber containing the ventricular slab, and a mechanical chopper that switches the light from one side of the preparation to the other at a high rate (500 Hz). Each illumination channel consists of a 660 nm 600 mW laser (Model Shanghai Dream Laser Technology Co., Ltd,), a set of metal reflecting mirrors, a holographic lens producing a broad beam, and a long-pass dichroic mirror (Model DCLP685, Chroma Technology Corp) which directs the beam to the surface of the heart. Each recording channel consists of a long pass 715 nm interference filter, which cuts off the excitation light, and a fast CCD camera (Lil’Joe, Scimeasure Analytical Systems, Inc.) which records fluorescence signals at 2 KHz frame rate.
The chopper and the CCD cameras are synchronized by an external clock generated by multifunction data acquisition board (Model PCI-6229, National Instruments). The data collected by the cameras is streamed to a computer by a pair of C-Link frame grabbers (Model PCI-DV C-Link, Engineering Design Team). The entire system is controlled by custom software built using Borland C++ Builder.
The signal diagram for the recording protocol is illustrated in the inset on the right of figure 1. As the light alternates from one side to another, the cameras take sequential recordings in reflection and transillumination modes. Specifically, when the epicardial surface is illuminated, the epicardial camera is recording in reflection mode1 (PP) and the endocardial camera is recording in transillumination mode (PN). After switching the light on the endocardial surface, the epicardial camera records in transillumination mode (NP) and the endocardial camera in reflection mode (NN). This protocol allows for continuously monitoring four different views of the excitation pattern with a temporal resolution of 2 ms.
C. Data processing and analysis
Movies for each camera were subdivided into two by separating the frames recorded in reflection and transillumination modes. As a result, we obtained four movies (PP, PN, NP, and NN), corresponding to transillumination (PN and NP) and reflection (NN and PP) views of the excitation pattern.
All recordings underwent both spatial and temporal filtration with kernels of 2 mm and 4 ms, respectively. The dominant frequency of arrhythmia (DF) as well as its complexity was determined using fast Fourier transform as described previously [6].
To detect scroll wave filaments, we used two independent methods: time-space plot analysis (TSP) [7] and amplitude analysis. The threshold for the amplitude analysis was set as follows. A given pixel was assumed to belong to the filament if the signal intensity in that pixel remained under ±15% of the averaged signal intensity in the same pixel for longer than one period of time (1/DF). The filament detection was considered valid when confirmed by both the TSP and amplitude methods.
The relative contributions of various myocardial layers in PP, PN, NP, and NN images were calculated using a previously described light transport model [8]. The values of the attenuation lengths for excitation (δe) and fluorescent (δf) light, required for these calculations were measured using the protocol described below.
D. Measuring the optical attenuation length
The epicardial surface of the preparation was pressed against a glass plate and uniformly illuminated by passing light from a 250 W halogen lamp through 650DF40 and 715LP interference filters, respectively. The parameters of the filters were chosen near the optimal excitation and fluorescence wavelengths for the DI-4-ANBDQBS [3]. The light intensity as a function of depth was measured using a 500 μm optical fiber coupled to a power meter (Model PM100, Thorlabs). The fiber was advanced at 0.5–1.0 mm steps into the ventricular slab from the endocardial surface. The attenuation length was determined by fitting the experimental data with the theoretical equation (1) linking the photon distribution (ϕ) and depth (z) [8]:
| (1) |
Here ϕ0 is the light intensity just inside the illuminated surface, L is the thickness of the ventricular wall, and δ is the attenuation length. In our preparations, L varied from 6 to 10 mm.
III. Results
A. Representation of different myocardial layers in PP, PN, NP and NN recordings
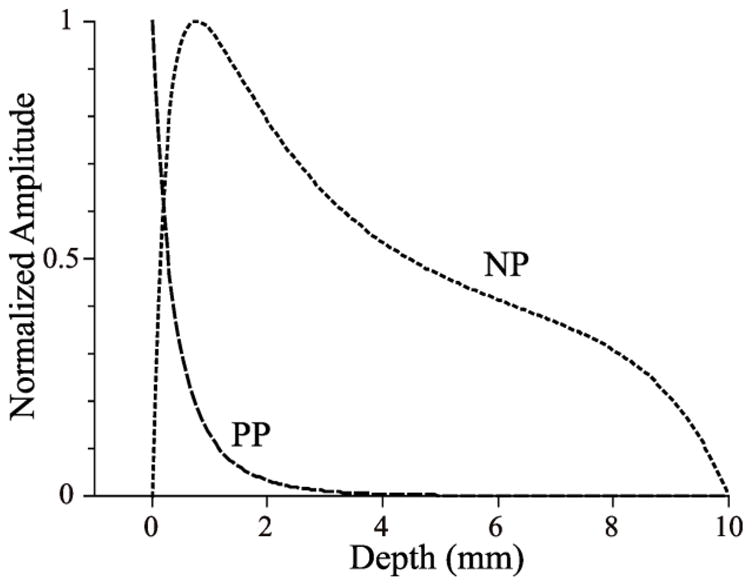
Figure 2 shows the calculated maximal signal intensity in reflection (PP) and transillumination (NP) images produced by a fluorescent particle located at various depths. For these calculations we used the experimentally derived values of attenuation lengths:δe= 2.56±0.5 and δf=3.3±0.5 mm.
Figure 2. Representation of myocardial layers in reflection and transillumination images.

The depth dependences of peak epicardial pixel intensities are shown in PP and NP imaging modes. The curves were calculated using the diffusion approximation. The dimensionless excitation and emission attenuation lengths, relative to the slab thickness, are 0.25 and 0.33 in both modes. Here, we see that NP is probing deeper than PP; the latter more strongly emphasizes the epicardial layer itself.
One can see that PP view emphasizes the epicardial surface, whereas NP is probing deeply inside the tissue with the maximum on the camera side, near 2 mm from the epicardium. This is very different from the case of blue-green excitation light (used for conventional voltage-sensitive dyes) where the transillumination signal emphasizes the illuminated surface [8]. The curves for NN and PN views (not shown) are symmetric to those for PP and NP.
Thus the four images PP, NP, PN, and NN represent epicardial, sub-epicardial, sub-endocardial, and endocardial surfaces, respectively.
B. Monitoring filaments using AT method
We analyzed 14 episodes of polymorphic ventricular tachycardia in 4 animals. In all episodes, we detected filaments in at least one of the four layers within 0.5 seconds after initiation. In the majority of cases, the first filament was observed within 10 mm from the S2 electrode, while in the other cases the first appearance was at the periphery of the imaged area. The frequency of arrhythmia ranged from 6.8 Hz to 9.0 Hz with an average of 7.9 Hz. The averaged frequencies did not differ significantly for different layers.
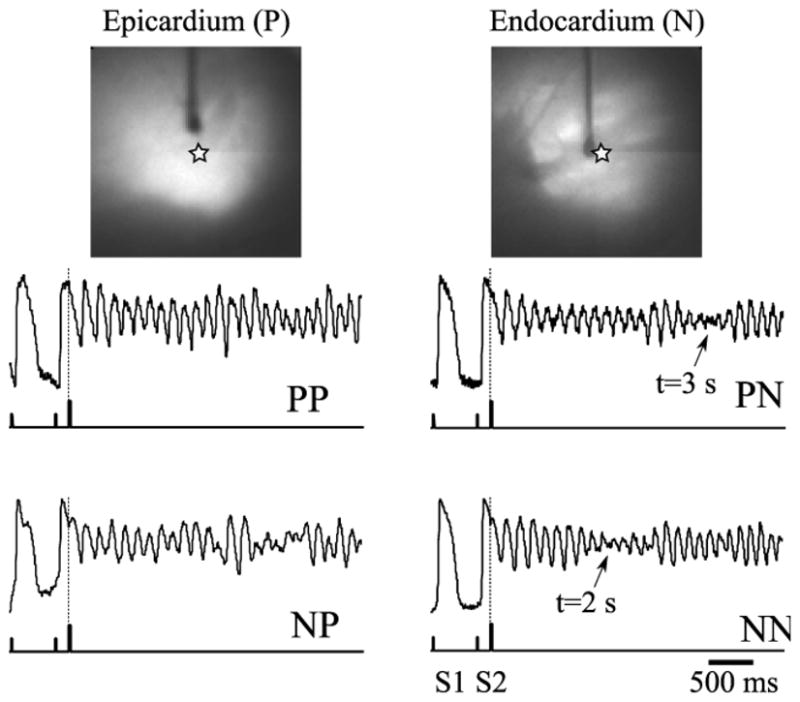
Figure 3 shows time traces of the optical signal before and after initiation of arrhythmia. One can see a significant drop in signal amplitude in PN and NN recordings caused by the filament passing the point of observation.
Figure 3. Initiation of a polymorphic tachycardia via premature stimulation.

Top: Epicardial and endocardial views of the preparation. Vertical dark shadows show the stimulating electrodes. Bottom: Single pixel recordings near the tip of the stimulating electrode (indicated as a star on top panels) extracted from the PP, PN, NP, and NN movies. The (x,y) coordinates of the pixel are the same for all four traces. The ticks on the lower trace show the timing of the basic (S1) and the premature (S2) stimuli. Note a significant decrease in signal amplitude in PN and NN recordings at 2 and 3 seconds past the arrhythmia initiation (arrows). The drop is caused by a drifting filament passing the recording site.
Note the significant difference in the timing of this event in different layers (2 s in NN versus 3 s in PN) suggesting transmural drift of the filament from the endocardium towards deeper sub-endocardial layers and subepicardial layers. A slow transmural drift has been previously predicted by computer simulations [9] and can be a result of myocardial fiber rotation.
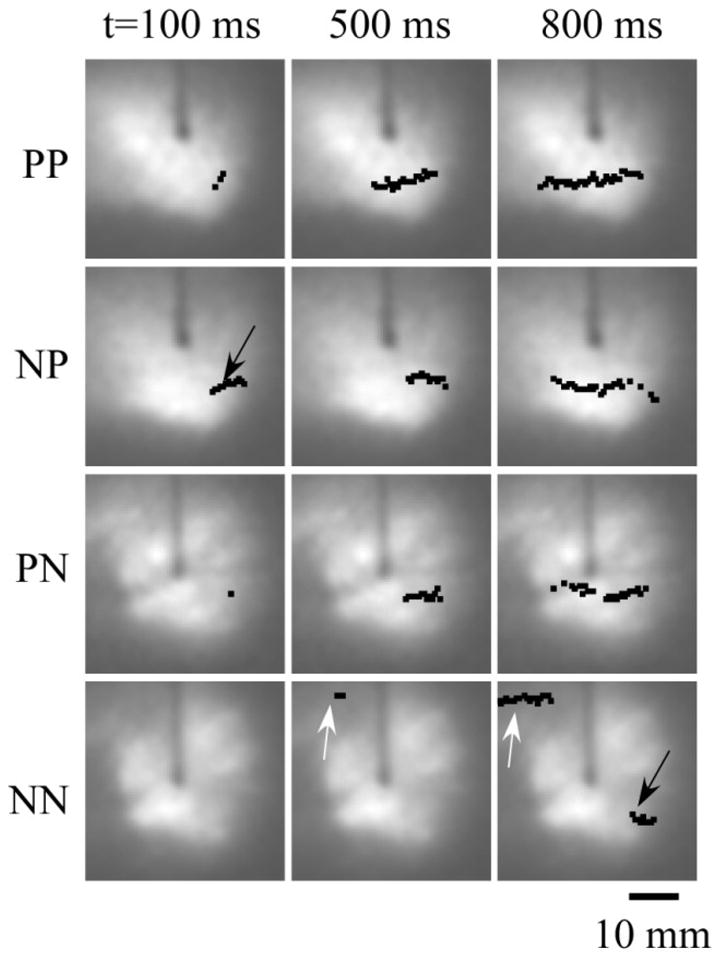
Figure 4 shows snapshots of the filament projections in all four layers at different moments in time detected using TSP. The filament is first detected at t=100 ms in PP, NP, and PN layers about 10 mm away from the tip of the S2 electrode.
Figure 4. Filament dynamics in various layers.

Black dots and arrows show the location of the filament center. Numbers on top indicate the time after the S2 stimulus. The filament originates in the NP layer, grows slowly, and reaches the endocardial NN layer at t=800 ms. White arrows show the formation and growth of the second filament in the NN layer.
Considering the topological constraint forbidding filaments to end inside the tissue [10], one should conclude that we most likely see projections of a small O-shaped filament located in sub-epicardial NP layer. With time, the filament expands and eventually reaches the endocardial NN layer at t=800 ms (see black arrow in the bottom right panel).
One can also see the formation of the second filament in the NN layer at the periphery of the imaged area. The filament first appears at t=500 ms and rapidly expands (compare t=500 and t=800). Again, considering the topological constraints and the absence of this filament in other layers, we conclude that most likely we see a projection of flattened U-shaped or L-shaped filament.
IV. Discussion
We described a new optical mapping method utilizing a new near-infrared voltage-sensitive dye and high speed alternating transillumination recordings. The new method enables monitoring of electrical activity in four different layers of the myocardial wall. We applied the new method to study the early stages of electrically induced polymorphic ventricular tachycardia. Using this approach, we were able to detect intramyocardial filaments and determine their 3D dynamics. Although the method is limited to four layers, we could clearly distinguish between them and could detect transmural motion of the filament.
We studied 14 tachyarrhythmic episodes, and in all of them, we were able to detected filaments in at least one of the four layers. Immediately after initiation, the filaments were located within 10 mm from the S2 electrode. The filament dynamics in different episodes of arrhythmia in the same animal showed a high degree of variability. We attribute this effect to relatively low amplitude of the S2 stimulus (1.5–2 thresholds) which makes the initiation very sensitive to little changes in tissue excitability and small heterogeneities.
In all episodes, the filaments had a very slow drift in its transverse direction as well as transmurally. During the first 4 seconds of arrhythmia, we were not able to detect the formation of a stable reentry driving the entire arrhythmic episode that would support the mother rotor hypothesis [11]. We neither observed a complex pattern of multiple meandering wavebreaks supporting the multiple wavelet hypotheses [12].
Acknowledgments
This work was supported by National Institute of Health, the National Heart, Lung and Blood Institute grants 5RO11HL071635 and 2RO1HL071762 and American Heart Association predoctoral fellowship grant 0815731D
Footnotes
The first and the second letters in this notation indicate the direction of illumination and the position of the camera (ePicardium versus eNdocardium), respectively
Contributor Information
Bogdan G. Mitrea, Email: mitreab@upstate.edu, State University of New York, Upstate Medical University, Syracuse, NY, 13210, USA, phone: 315-464-8007; fax: 315-464-8014
Marcel Wellner, Email: wellnerm@upstate.edu, State University of New York, Upstate Medical University, Syracuse, NY 13210, and Syracuse University, Syracuse, NY 13244.
Arkady M. Pertsov, Email: pertsova@upstate.edu, State University of New York, Upstate Medical University, Syracuse, NY, 13210
V. REFERENCES
- 1.Rosenbaum DS, Jalife J. Optical mapping of cardiac excitation and arrhythmias. Wiley; 2001. [Google Scholar]
- 2.Baxter WT, Mironov SF, Zaitsev AV, Jalife J, Pertsov AM. Visualizing excitation waves inside cardiac muscle using transillumination. Biophysical Journal. 2001;80:516–530. doi: 10.1016/S0006-3495(01)76034-1. [DOI] [PMC free article] [PubMed] [Google Scholar]
- 3.Matiukas A, Mitrea BG, Qin M, Pertsov AM, Shvedko AG, Warren MD, Zaitsev AV, Wuskell JP, Wei M, Watras J. Near-infrared voltage-sensitive fluorescent dyes optimized for optical mapping in blood-perfused myocardium. Heart Rhythm. 2007;4:1441–1451. doi: 10.1016/j.hrthm.2007.07.012. [DOI] [PMC free article] [PubMed] [Google Scholar]
- 4.Khait VD, Bernus O, Mironov SF, Pertsov AM. Method for the three-dimensional localization of intramyocardial excitation centers using optical imaging. Journal of Biomedical Optics. 2006;11:034007. doi: 10.1117/1.2204030. [DOI] [PubMed] [Google Scholar]
- 5.DPZMD, JJMD . Cardiac Electrophysiology: From Cell to Bedside: Expert Consult - Online and Print. Saunders; 2009. [Google Scholar]
- 6.Zaitsev AV, Berenfeld O, Mironov SF, Jalife J, Pertsov AM. Distribution of Excitation Frequencies on the Epicardial and Endocardial Surfaces of Fibrillating Ventricular Wall of the Sheep Heart. Circ Res. 2000 Mar;86:408–417. doi: 10.1161/01.res.86.4.408. [DOI] [PubMed] [Google Scholar]
- 7.Valderrabano M, Yang J, Omichi C, Kil J, Lamp ST, Qu Z, Lin S, Karagueuzian HS, Garfinkel A, Chen P, Weiss JN. Frequency Analysis of Ventricular Fibrillation in Swine Ventricles. Circ Res. 2002 Feb;90:213–222. doi: 10.1161/hh0202.103645. [DOI] [PubMed] [Google Scholar]
- 8.Bernus O, Wellner M, Mironov SF, Pertsov AM. Simulation of voltage-sensitive optical signals in three-dimensional slabs of cardiac tissue: application to transillumination and coaxial imaging methods. Physics in Medicine and Biology. 2005;50:215–229. doi: 10.1088/0031-9155/50/2/003. [DOI] [PubMed] [Google Scholar]
- 9.Berenfeld O, Pertsov AM. Dynamics of Intramural Scroll Waves in Three-dimensional Continuous Myocardium with Rotational Anisotropy. Journal of Theoretical Biology. 1999 Aug;199:383–394. doi: 10.1006/jtbi.1999.0965. [DOI] [PubMed] [Google Scholar]
- 10.Pertsov AM, Wellner M, Vinson M, Jalife J. Topological constraint on scroll wave pinning. SIAM Rev Phys Rev Lett. 1992;84:2738. doi: 10.1103/PhysRevLett.84.2738. [DOI] [PubMed] [Google Scholar]
- 11.Samie FH, Berenfeld O, Anumonwo J, Mironov SF, Udassi S, Beaumont J, Taffet S, Pertsov AM, Jalife J. Rectification of the Background Potassium Current: A Determinant of Rotor Dynamics in Ventricular Fibrillation. Circ Res. 2001 Dec;89:1216–1223. doi: 10.1161/hh2401.100818. [DOI] [PubMed] [Google Scholar]
- 12.Moe GK, Rheinboldt WC, Abildskov JA. A computer model of atrial fibrillation. American Heart Journal. 1964;67:200. doi: 10.1016/0002-8703(64)90371-0. [DOI] [PubMed] [Google Scholar]


