

Abstract
Recently, novel near-infrared (NIR) voltage-sensitive dyes were developed for imaging electrical activity in blood-perfused hearts and for tomographic applications. However, their usefulness for conventional surface mapping is unclear. The spectral shift to the NIR range significantly increases the penetration depth of light into the tissue, thus increasing the intramural volume contributing to the optical action potential (OAP). Here, we characterize both computationally and experimentally the effect of increased penetration depth on the OAP upstroke, the OAP component most sensitive to optical scattering and absorption, and the activation maps. Optical imaging of cardiac electrical activity was performed in isolated rat hearts (n=5) paced from the LV mid free wall. We used the NIR dye JPW-6033 (excitation at 660nm, acquisition at >695nm). The conventional dye DI-4-ANEPPS (excitation at 532nm, acquisition at 700 DF50nm) was used for comparison. To simulate OAP we utilized a hybrid model that couples light transport equations with the model of electrical propagation. As expected, the switch from DI-4-ANEPPS to JPW-6033 significantly increased the upstroke duration: from 3.95±0.69ms to 5.39±0.82 ms, respectively. However, activation maps were largely unaffected. The correlation between the shape of the optical upstroke, and the averaged subsurface wave front orientation was also preserved. The computer simulations are in excellent agreement with the experimental data. In conclusion, our analysis suggests that despite significant increase in upstroke duration, the novel NIR dyes can be a useful alternative to conventional dyes in surface mapping applications.
I. Introduction
Recently, novel near-infrared (NIR) voltage-sensitive fluorescent dyes were developed for imaging cardiac electrical activity in blood-perfused myocardial tissues, where conventional dyes with blue-green excitation are difficult to use due to significant absorption of the excitation light [1]. Compared to blue-green dyes, such as the widely used DI-4-ANEPPS [2–5], the new NIR dyes also display higher voltage sensitivity yielding up to 20% signal-to-background ratios per 100mV change in transmembrane potential, as well as reduced photobleaching and much slower washout and internalization kinetics [1]. These dyes have therefore the potential to be used in a wide range of cardiac optical imaging modalities.
One consequence of a spectral shift towards the NIR range is an increase in the volume of subsurface tissue contributing to the optical signal due to reduced photon scattering and absorption. Increased subsurface contributions are associated with widening of the optical upstroke, which may affect the accuracy and interpretation of the optical recordings. Previous work using DI-4-ANEPPS showed that the optical upstroke morphology, more specifically the fractionate level at which the optical signal reaches maximum derivative (VF*), strongly correlates to the mean wave front orientation within the subsurface volume contributing to the optical signal [5, 6]. Thus far, estimations of the wave front orientation based on VF* have been limited to superficial tissue layers as a result of blue-green excitation light being highly susceptible to scattering and absorption.
The major objective of this study was to quantify both computationally and experimentally the changes in the optical action potentials (OAPs) produced by the most promising of the novel NIR dyes, JPW-6033 [1], as compared to the widely used dye DI-4-ANEPPS. We aimed to characterize the optical depth penetration for JPW-6033 and record its effect on the OAP upstroke morphology and duration. Furthermore, we sought to examine if subsurface wave front orientation can be determined from the morphology of the optically recorded action potential using NIR dyes.
Our study confirmed that the volume of tissue contributing to the epi-fluorescence optical signal was significantly increased for JPW-6033, resulting in increased mean optical upstroke duration from 3.95 ms (DI-4-ANEPPS) to 5.39 ms (JPW-6033). However, this did not significantly affect activation maps, which are very similar for both dyes. Importantly, our results demonstrate that VF* obtained from measurements using NIR dyes still strongly correlates to subsurface wave front orientation. Our findings suggest that the new dyes can be useful, not only in blood-perfused tissues, but in a whole range of optical mapping applications.
II. Methods
A. Langendorff-perfused rat heart preparation
Male Wistar rats (N = 5) were killed in accordance with the Animals (Scientific Procedures) Act 1986. Hearts were rapidly removed and arrested in ice cold cardioplegic solution containing (in mM): glucose, 277.5; KCl, 30; NaHCO3, 25; mannitol, 34.3, pH 7.4. The aorta was cannulated and perfused at 7 ml/min with bicarbonate buffered saline solution containing (mM): NaCl, 130; NaHCO3, 24; NaH2PO4, 1.2; MgCl2, 1; glucose, 5.6; KCl, 4; CaCl2; oxygenated with 95% O2/5% CO2, pH 7.4, 37 °C. 10 μM blebbistatin was added to stop contraction. The tissue was stained with potentiometric dye, Di-4-ANEPPS (5 μg/ml normal Tyrode’s solution) via the perfusate at the beginning of the experiment. Following all optical recordings using Di-4-ANEPPS tissue was stained with JPW-6033 (50 μg/ml normal Tyrode’s solution). Bipolar electrodes were used to stimulate the ventricles at the epicardial surface at cycle lengths ranging from 200–70 ms).
B. Optical setup
Optical recordings were acquired through a high-framerate charge-coupled device video camera (SciMeasure Analytical systems, GA, USA) mounted with a lens (focal length 12 mm, 1:0.8 aperture ratio; Computar, London, UK). Excitation light from monochromatic lasers, 532 and 660 nm, (Shanghai Dreamlasers technology Co., Ltd, Shanghai, China) was passed through a beam expander to illuminate the epicardial surface. Emission light from Di-4-ANEPPS and JPW-6033 were filtered through broadband 700DF50 and long-pass 695 nm filters, respectively. Images (80 × 80 pixels) with pixel dimensions of 0.25 × 0.25 mm were acquired at a rate of 2000 frames per second. Background fluorescence was subtracted from each frame to obtain the voltage-dependent optical signal.
C. Processing of optical recordings
In all experiments, OAPs recorded over 5 s underwent temporal (3 ms kernel) and spatial (1.25 mm kernel) filtration followed by ensemble averaging. Activation time was measured at a level of 50% of the OAP upstroke. To characterise optical upstroke morphology we used the relative fractional level VF*, at which the maximum time derivative of the voltage-sensitive fluorescence occurred. Cubic spline interpolation (10 additional points per interval) in the time-series fluorescent data was used to obtain accurate estimates of VF* [5]. Optical upstroke duration was measured as the time interval between 10% and 90% of the upstroke.
D. Computer simulations
Optical signals of cardiac electrical activity are simulated using a photon transport model coupled to a rat electrophysiological model [7] as previously described [6]. The optical parameters at the wavelengths of interest for the photon transport model were: 520DF60, 1.12±0.41 mm; 650DF40, 2.56±0.55 mm and 715LP, 3.3±0.5 mm (as determined in [8]). The spatial and temporal distribution of the transmembrane potential Vm (r⃗,t) was calculated using the diffusion equation with partial-flux boundary conditions for the photon transport model (see e.g. [9]). This model was previously shown to be sufficiently accurate in reproducing the effects of scattering on action potential upstrokes [6]. The model was adapted using the following parameters: electrical diffusivity tensor scaled to steady-state conduction velocities of 60 cm/s in longitudinal and 20 cm/s in transverse directions of fiber orientation and fiber orientation was assumed to rotate at linear rate in a counterclockwise direction with a total fiber rotation of 120° in a 3 mm thick slab simulation. Propagation of electrical waves was simulated in rectangular slabs of 10 mm × 10 mm × 3mm. Temporal and spatial resolutions for each simulation were 1 ms and 0.1 mm, respectively.
III. Results
Fig. 1 shows the optical integration volumes achieved using excitation/emission conditions appropriate for Di-4-ANEPPS and JPW-6033 from computer simulations (see methods). Results show the subsurface volume that contributes to 75% of the optical signal in a single epicardial pixel. Simulations infer the maximum depth of contributing optical signals were 0.9 mm and 3.9 mm for Di-4-ANEPPS and JPW-6033, respectively.
Fig. 1.
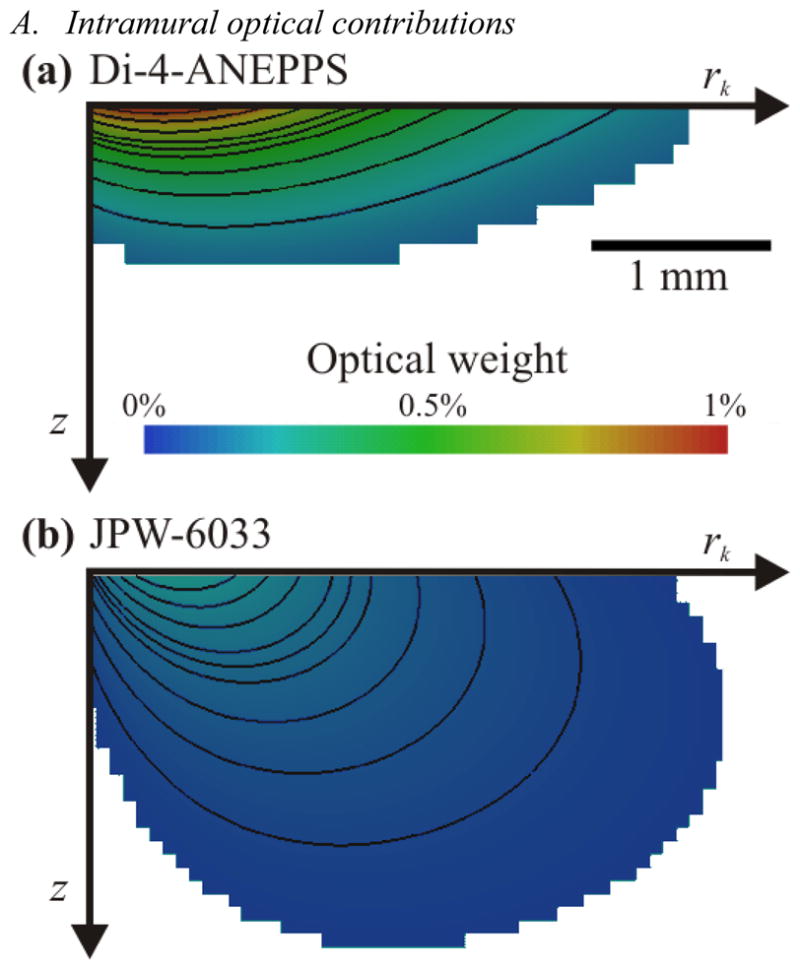
The subsurface optical integration volume achieved using Di-4-ANEPPS and JPW-6033. Simulations are 2D transmural slabs with a total depth, z, of 5 mm and radius, rk, of 10 mm. Color scale bar indicates the percentage contribution of each pixel to the total signal recorded from the top left pixel on the epicardium. Optical integration volumes are shown using optical properties for: A, Di-4-ANEPPS and B, JPW-6033.
B. Optical activation properties
Fig. 2A depicts optical activation maps simulating the use of Di-4-ANEPPS and JPW-6033. JPW-6033 produced a delay of 6.7 ms for the earliest activation time following point stimulation (at time = 0 ms) compared with 3.4 ms for Di-4-ANEPPS. Experimental recordings when pacing from the mid free left ventricular wall from rats also incurred a greater delay of activation using JPW-6033 compared with Di-4-ANEPPS (Fig. 2B).
Fig. 2.

OAP activation properties using Di-4-ANEPPS and JPW-6033. A and B, Activation maps after point stimulation at locations indicated by arrows in simulations and experiments, respectively. A, Simulations using optical parameters for Di-4-ANEPPS (left panel) and JPW-6033 (right panel). B, Optical activation maps from the same rat left ventricular wall loaded with Di-4-ANEPPS (left panel) and JPW-6033. C, Comparison of optical upstroke morphologies obtained from pixels indicated by an asterisk * in activation maps from simulations (top panel) and experiments (bottom panel).
Di-4-ANEPPS and JPW-6033 produced similar optical activation maps showing typical elliptical isochrones due to tissue anisotropy. Note that the long axis of these ellipses are somewhat rotated when comparing activation maps using Di-4-ANEPPS with JPW-6033 from both simulations (Fig. 2A) and experiments (Fig. 2B). This could indicate the contribution of tissue at increased depths from the epicardial surface.
Fig. 2C shows a comparison of OAP upstrokes. Simulations show OAP upstroke durations are prolonged relative to the electrical upstroke as a result of optical signals being averaged over a subsurface volume. Furthermore, increased depth contributions from JPW-6033 (8.9±1.15 ms) was associated with prolongation of the upstroke duration relative to Di-4-ANEPPS (4.9±0.69 ms), N=100 pixels, P<0.0001. This was validated experimentally where by the optical upstroke duration using JPW-6033 was 5.89±0.82 ms compared with 3.95±0.69 ms using Di-4-ANEPPS (N=5 hearts, P<0.01).
C. Estimating subsurface wavefront orientation
Fig. 3A shows VF* maps derived from simulations using optical parameters for Di-4-ANEPPS and JPW-6033. In both simulations we observed a typical pattern that is consistent with experimental recordings (Fig. 3B): an elongated strip centered on the stimulation site which corresponds to the regions of fast propagation as shown in Fig. 2A and B. The region in close proximity to the stimulation site revealed VF* values ~0.5 using Di-4-ANEPPS and <0.5 using JPW-6033. VF* values perpendicular to the direction of fast propagation were increased further away from the pacing site up to 0.7 for Di-4-ANEPPS and up to 0.8 for JPW-6033. Experiments confirmed these observations where JPW-6033 produced an elongated region of low VF* (<0.25) on the stimulation site whereas VF* values recorded using Di-4-ANEPPS approximated 0.5 at the site of stimulation. Perpendicular to the direction of fast propagation in experimental recordings revealed a pattern of increasing VF* values, consistent with simulations.
Fig. 3.
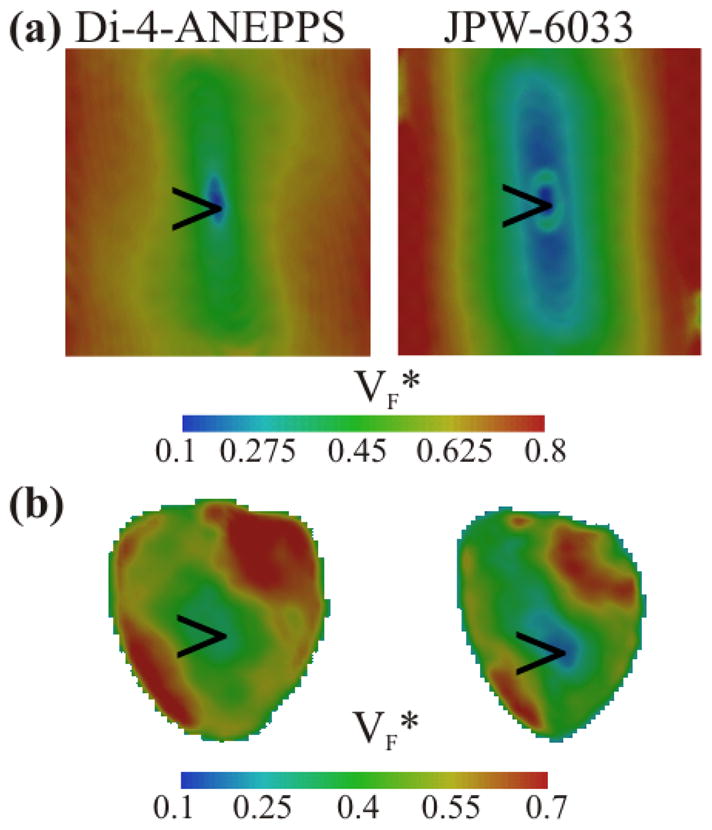
Comparison of VF* maps using Di-4-ANEPPS and JPW-6033. A, Simulations of VF* maps with optical parameters for Di-4-ANEPPS (left panel) and JPW-6033 (right panel). B, Experimental VF* maps in the same heart loaded with Di-4-ANEPPS (left panel) and JPW-6033 (Right panel). Arrows indicate the site of stimulation.
VF* derived from the OAP recorded using Di-4-ANEPPS correlated with the angle normal to the subsurface wavefront with respect to the epicardial surface (Fig. 4A). In addition, a simulation using the optical parameters for JPW-6033 revealed a strong correlation between VF* and subsurface wave propagation direction to remain (Fig. 4B); although differences between correlations using both dyes were evident. VF* values obtained using JPW-6033 correlated with a reduced range of sub-surface angles compared with Di-4-ANEPPS.
Fig. 4.

Correlation between VF* and subsurface wavefront orientation using Di-4-ANEPPS and JPW-6033. VF* values derived from simulations in Fig. 3A plotted against fiber orientation with respect to the epicardial surface. A and B, VF* derived from action potentials using optical parameters for Di-4-ANEPPS and JPW-6033, respectively. Linear regression analysis determined R2=0.97 and R2=0.99 for Di-4-ANEPPS and JPW-6033, respectively.
IV. Discussion
The present study describes the characteristics of a novel NIR voltage-sensitive dye, JPW-6033 for recording of OAPs in ventricular myocardium. It was shown that the mean optical signal using NIR dye is recorded from increased depths in the myocardium compared with using blue/green wavelengths for the conventional dye, Di-4-ANEPPS. Increased optical integrated volume was associated with prolongation of the OAP upstroke duration. Furthermore, the correlation between optical upstroke morphology and subsurface wavefront orientation, characterized for Di-4-ANEPPS, was shown to remain viable when using NIR voltage-sensitive dyes.
Previous epifluorescence studies in cardiac tissue, which used conventional dyes with excitation wavelengths in the blue/green range, were acquiring and interpreting information from tissue depths of < 1mm. Increasing the optical integration volume, by using NIR voltage-sensitive dyes, provides a method to understand wavefront propagation at deeper layers of cardiac tissue and to account for transmural structural changes in the heart, namely, fiber rotation [10]. The current study utilized simulations of wave propagation in ventricular slabs with a linear fiber rotation of 120° from epicardium to endocardium [11]. As fiber orientation determines the direction of fast electrical propagation [12], greater intramural variation of wavefront orientation will be accounted for optically using NIR voltage-sensitive dyes was observed with activation maps (Fig. 2).
Differences in VF* maps derived from each dye in the present study demonstrated variations of intramural wavefront orientation estimated near to the epicardial subsurface compared with increased subsurface depths.
In conclusion, we have characterized the increased depth contributions of NIR voltage-sensitive dyes to optical signals. Simulations verify that optical signals using NIR dyes are acquired from an increased optical integrated volume compared with conventional dyes. As a result, OAP upstroke duration is prolonged however the fractional level of the maximal derivative, VF*, remains in strong correlation with the subsurface wavefront orientation. These findings enable better interpretation of intramural optical wavefront orientation.
Acknowledgments
This work was supported in part by the EPSRC under grant EP/F065574/1, the Royal Society under grant RG081248 and NIH under grants 5R01HL071762, 5R01HL071635 and 5R03TW008039.
Contributor Information
Richard D. Walton, Email: R.D.Walton@leeds.ac.uk, Faculty of Biological Sciences and members of the Multidisciplinary Cardiovascular Research Centre, University of Leeds, Leeds, LS2 9JT UK
Bogdan G. Mitrea, Email: MitreaB@upstate.edu, Department of Pharmacology, SUNY Upstate Medical University, Syracuse, NY 13210 USA
Arkady M. Pertsov, Email: PertsovA@upstate.edu, Department of Pharmacology, SUNY Upstate Medical University, Syracuse, NY 13210 USA
Olivier Bernus, Email: O.Bernus@leeds.ac.uk, Faculty of Biological Sciences and members of the Multidisciplinary Cardiovascular Research Centre, University of Leeds, Leeds, LS2 9JT UK.
References
- 1.Matiukas A, Mitrea BG, Qin M, Pertsov AM, Shvedko AG, Warren MD, Zaitsev AV, Wuskell JP, Wei MD, Watras J, Loew LM. Near-infrared voltage-sensitive fluorescent dyes optimized for optical mapping in blood-perfused myocardium. Heart Rhythm. 2007;4:1441–51. doi: 10.1016/j.hrthm.2007.07.012. [DOI] [PMC free article] [PubMed] [Google Scholar]
- 2.Caldwell BJ, Legrice IJ, Hooks DA, Tai DC, Pullan AJ, Smaill BH. Intramural measurement of transmembrane potential in the isolated pig heart: validation of a novel technique. J Cardiovasc Electrophysiol. 2005;16:1001–10. doi: 10.1111/j.1540-8167.2005.40558.x. [DOI] [PubMed] [Google Scholar]
- 3.Mironov SF, Vetter FJ, Pertsov AM. Fluorescence imaging of cardiac propagation: spectral properties and filtering of optical action potentials. Am J Physiol Heart Circ Physiol. 2006;291:H327–35. doi: 10.1152/ajpheart.01003.2005. [DOI] [PubMed] [Google Scholar]
- 4.Yang Z, Zhang H, Kong S, Yue XF, Jin YB, Jin J, Huang YC. Study for relevance of the acute myocardial ischemia to arrhythmia by the optical mapping method. Physiol Meas. 2007;28:481–8. doi: 10.1088/0967-3334/28/5/003. [DOI] [PubMed] [Google Scholar]
- 5.Hyatt CJ, Mironov SF, Vetter FJ, Zemlin CW, Pertsov AM. Optical action potential upstroke morphology reveals near-surface transmural propagation direction. Circ Res. 2005;97:277–84. doi: 10.1161/01.RES.0000176022.74579.47. [DOI] [PubMed] [Google Scholar]
- 6.Hyatt CJ, Zemlin CW, Smith RM, Matiukas A, Pertsov AM, Bernus O. Reconstructing subsurface electrical wave orientation from cardiac epi-fluorescence recordings: Monte Carlo versus diffusion approximation. Opt Express. 2008;16:13758–72. doi: 10.1364/oe.16.013758. [DOI] [PubMed] [Google Scholar]
- 7.Pandit SV, Clark RB, Giles WR, Demir SS. A mathematical model of action potential heterogeneity in adult rat left ventricular myocytes. Biophys J. 2001;81:3029–51. doi: 10.1016/S0006-3495(01)75943-7. [DOI] [PMC free article] [PubMed] [Google Scholar]
- 8.Mitrea BG, Wellner M, Pertsov AM. Monitoring intramyocardial reentry using alternating transillumination. 31st Annual INternational Conference of the IEEE-Engineering-in-Medicine-and-Biology-Society; 2009. [DOI] [PMC free article] [PubMed] [Google Scholar]
- 9.Bernus O, Mukund KS, Pertsov AM. Detection of intramyocardial scroll waves using absorptive transillumination imaging. J Biomed Opt. 2007;12:014035. doi: 10.1117/1.2709661. [DOI] [PubMed] [Google Scholar]
- 10.Armour JA, Randall WC. Structural basis for cardiac function. Am J Physiol. 1970;218:1517–23. doi: 10.1152/ajplegacy.1970.218.6.1517. [DOI] [PubMed] [Google Scholar]
- 11.Chen J, Song SK, Liu W, McLean M, Allen JS, Tan J, Wickline SA, Yu X. Remodeling of cardiac fiber structure after infarction in rats quantified with diffusion tensor MRI. Am J Physiol Heart Circ Physiol. 2003;285:H946–54. doi: 10.1152/ajpheart.00889.2002. [DOI] [PubMed] [Google Scholar]
- 12.Clerc L. Directional differences of impulse spread in trabecular muscle from mammalian heart. J Physiol. 1976;255:335–46. doi: 10.1113/jphysiol.1976.sp011283. [DOI] [PMC free article] [PubMed] [Google Scholar]