Abstract
Summary
Hand radiographs are obtained routinely to determine bone age of children. This paper presents a method that determines a Paediatric Bone Index automatically from such radiographs. The Paediatric Bone Index is designed to have minimal relative standard deviation (7.5%), and the precision is determined to be 1.42%.
Introduction
We present a computerised method to determine bone mass of children based on hand radiographs, including a reference database for normal Caucasian children.
Methods
Normal Danish subjects (1,867), of ages 7–17, and 531 normal Dutch subjects of ages 5–19 were included. Historically, three different indices of bone mass have been used in radiogrammetry all based on  , where T is the cortical thickness and W the bone width. The indices are the metacarpal index A/W2, DXR-BMD = A/W, and Exton-Smith’s index A/(WL), where L is the length of the bone. These indices are compared with new indices of the form A/(WaLb), and it is argued that the preferred index has minimal SD relative to the mean value at each bone age and sex. Finally, longitudinal series of X-rays of 20 Japanese children are used to derive the precision of the measurements.
Results
The preferred index is A/(W1.33L0.33), which is named the Paediatric Bone Index, PBI. It has mean relative SD 7.5% and precision 1.42%.
Conclusions
As part of the BoneXpert method for automated bone age determination, our method facilitates retrospective research studies involving validation of the proposed index against fracture incidence and adult bone mineral density.
Keywords: Bone age, Bone mass, Children’s bone health, Radiogrammetry, Radiographs
Introduction
Hand radiographs are obtained routinely in order to determine the bone age as part of the workup of a variety of disorders related to growth and maturation in children. Bone age is a better assessment of the child’s stage of physiological development than the chronological age; for instance, the menarche and the growth spurt occur in relatively narrow intervals of bone age [1].
In recent years, there has been an increasing interest in assessing bone mass in paediatric endocrinology, and the traditional bone density methods, dual-energy X-ray absorptiometry (DEXA) and peripheral quantitative computed tomography (pQCT), have been adapted to the paediatric population [2, 3]. A bone mass measurement is often judged relative to bone age rather than age.
The determination of bone age has recently been automated by the BoneXpert method which locates 15 bones in the hand, including all the metacarpals, and assigns a bone age value to each bone [4–7]. In view of this new technology, it is logical to investigate the best way to determine bone mass from the bone age radiographs by an automated version of the classical method of radiogrammetry which was popular in the 1960s [8–10]).
Rijn et al. [11] presented a study of automated radiogrammetry in children. This work employed the Pronosco/Sectra X-posure System to determine digital X-ray radiogrammetry (DXR)-bone mineral density (BMD), which was originally developed for adults but used by them to analyse a paediatric population. Their results were encouraging, but the method tended to reject images at ages below 10 years, and it was not able to adapt the size of the measurement region to the size of the hand.
The aim of this paper is to present a dedicated method for assessing bone mass of children using conventional radiographs of the hand. We perform a systematic analysis to determine the index that best accommodates the highly variable size of the paediatric hand, we present a reference database for healthy Caucasian European children, and we determine the precision of the method.
Methods
Data
The subjects’ radiographs are derived from three studies:
The Sjaelland study: 1,867 healthy Caucasian subjects (median age 11.5 years, range 7–17 years) recorded on films in 1965 to 1966 in Denmark [12]. The images were obtained using portable X-ray equipment with a film–focus distance of 0.45 m, and the right hand was used. The study included municipal school children from five communities in Northern Sjaelland for whom the parents gave consent, resulting in images from 97% of all children, which makes this data set a true representation of the population. The images used are a random subset of the 3,600 images that make up the original study.
The Erasmus study: 531 healthy Caucasian subjects, including 255 boys (median age 12.4 years, range 3.8–20.1 years) and 276 girls (median age 12.6 years, range 3.8–20.0 years) from the Erasmus Gymnasium in Rotterdam were studied in 1997 by researchers at the Erasmus Medical Centre (EMC) [13]. The younger children were children of employees at the EMC institutions. Institutional Review Board approval was given to obtain radiographs of the left hand and use these data for subsequent analysis. Informed consent was obtained from the parents or custodians and, for children above 12, also from the child. A detailed description of this cohort was published by Lequin et al. [13]. Radiographs of the left hand were recorded on mammography film (Philips Diagnost H, Imation GTU film, Alfa-II Trimax intensifying screens, small 0.6 mm focus, film–focus distance 1.5 m, 45 kV, 16 mAs) to obtain excellent quality.
The Seiiku study followed ten boys and ten girls with growth hormone deficiency treated with growth hormone and gonadotropin-releasing hormone analogue for a period of 1.75–6.75 years. The data consist of 284 images recorded in the period ca. 1984–2001. The children were followed from an age of 4–11 years to an age of 15–21 years. The images were obtained approximately once every 6 months.
The films were digitised in 300 dpi with 12 bits per pixel using a Vidar Diagnostic Pro Advantage scanner (Vidar, Hemdon, VA, USA) using software version TWAIN 5.2. However, the Seiiku study and one third of the Sjælland images were digitised with a UMAX Powerlook 1100 scanner (Umax Data Systems Inc, Taipei, Taiwan) in 300 dpi with 8 bits per pixel, using MagicScan 4.5 software.
Method
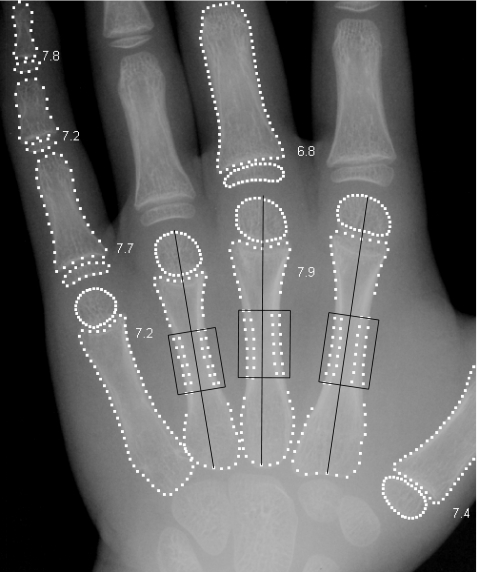
The method is based on the BoneXpert system for automatic determination of bone age [4–7] (Visiana, Holte, Denmark, www.BoneXpert.com). The images are first reduced to 150 dpi and 8 bits, and then the boundaries of the metacarpals (and other bones) are determined. For more mature bones, the boundary includes both the diaphysis and the fused epiphysis, while for the less mature bones there are separate boundaries for the diaphysis and the epiphysis. The boundary of the diaphysis is computed as 64 points, which correspond to the same anatomical locations across subjects [4, 14]. Two of the points correspond to the proximal and distal ends of the diaphysis, and they are used to define the bone axis (see Fig. 1). The length, L, of the bone is measured along this axis, and it includes the epiphysis. A region of interest (ROI) is centred 44% of L from the proximal end of the bone, and it extends 25% of L. In this region, the inner and outer borders of the cortical bone boundary are determined as shown in Fig. 1. The outer boundary is defined as a connected path running at locations with maximal gradient, while the inner boundary is the path of maximal intensity.1 For each bone, the average width, W, and average cortical thickness, T, are determined from the ROI. From W and T, the transverse cortical area is defined by the formula for a cylindrically symmetric bone:
 |
Fig. 1.
Excerpt of a hand radiograph showing the bone borders outlined by BoneXpert for bone age determinations, which are indicated next to the bones. The ROIs in the metacarpals are shown; they are centred at a distance of 44% from the proximal ends of the indicated bone axes. In each ROI, the inner and outer borders of the cortex are marked
We will use the cortical area as the basic measure of the amount of bone and construct various indices from it. If T is much smaller than W, we can approximate the area as A ≈ πTW, and we will refer to this approximation later in the text.
Historically, three different indices have been used:
The metacarpal index: The first index used was the metacarpal index (MCI) which was defined as the cortical thickness, T, divided by the bone width, W, with both T and W measured around the middle of the second metacarpal [8]. This was later refined to A/W2, which we will take as the MCI in this paper [16]; the earlier expression can be viewed as an approximation to this newer expression (two indices are regarded as the same if they equal up to a multiplicative constant). A/W2 can also be interpreted as the volumetric bone density, i.e. the bone mass per 3D bone volume.
The cortical thickness: The second method was the cortical thickness T itself. It was promoted for its simplicity by Morgan (and others) as an alternative to the MCI [9]. A recent variant of this is DXR-BMD, defined as
 , where c is a constant determined so that DXR becomes an estimate of DEXA-BMD in the radius, and T and W are measured for metacarpals 2 through 4 [17]. DXR is the same as A/W and approximately equal to the cortical thickness.
The Exton-Smith Index: The third method was the Exton-Smith Index, ESI = A/(WL) [10]. In contrast to the other indices, this method was designed for the paediatric population, and the division by L was intended to correct for the variable body size in this population. ESI is approximately equal to T/L.
In this work, we will follow the footsteps of Exton-Smith and design a bone index which is relevant for the paediatric population. Exton-Smith argued that when considering children of a given age, the optimal index should not depend on the size of the child. The cortical thickness increases with size of the subject, and Exton-Smith found that dividing by L removed this dependency. This means that the relative standard deviation of the index (i.e. the SD divided by the mean) is reduced because some “trivial” variation is removed.
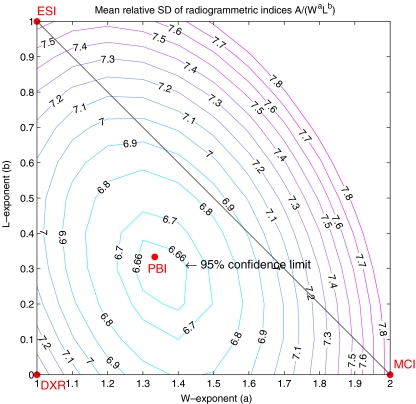
We develop this principle into a strict design principle. We seek a bone index of the form A/(WaLb), and we optimise the exponents a and b so as to minimise the mean relative SD (MRSD) of the index (the relative SD is the SD divided by the mean). This is the same as removing any linear dependency of the index on L and W. The three classical indices are used to span a triangular search area as shown in Fig. 2.
Fig. 2.
The triangle spanned by the three classical radiogrammetric bone indices. The W exponent increases in the horizontal direction and the L exponent in the vertical direction. The contours of the mean relative SDs of the Sjælland study are shown. The smallest value is obtained close to the middle of the triangle, where PBI resides. The 95% confidence limit for the optimal index is approximately equal to the 6.66 contour
Our method studies a cohort of normal children over a suitable age range, in this case the Sjælland data, encompassing ages 7 through 17. The data are divided into half-year bins of bone age and into gender, and the relative SD is formed for each bin. The relative SD is averaged over all bins to form the MRSD, and the optimal index is the one with the smallest MRSD.
A bone index is computed for the three middle metacarpals by computing it for each metacarpal and then averaging.
Precision
The precision of a bone index measurement is defined as the ability to obtain the same result on a repeated measurement. This could be determined directly by obtaining two X-rays of the hand after replacing the hand on the film cassette for a number of children. However, such a procedure would be unethical, so in this study the precision (in fact an upper limit on the true precision) is instead determined using the retrospective longitudinal series of X-rays in the Seiiku study.
Consider a triplet of measurements PBI1, PBI2 and PBI3 taken at 6-month intervals, assume that Paediatric Bone Index (PBI) grows linearly over the time span of the triplet, and define the interpolation residual e as2
 |
The precision error p on a single determination can then be derived from a set of observations of e as
 |
where rms denotes the root of the mean of the squares.
The assumption of linear PBI evolution over the period of the three measurements is in general not exactly true, and any deviation from linearity will add a contribution to rms(e). As a consequence, this precision estimate is an upper limit on the true precision.
The unwanted effect of non-linearities can be minimised by using measurements taken at short intervals (the extreme case would be to use measurements taken with 1-h intervals, but as mentioned, such data are unlikely to exist). Therefore, the estimate of p is restricted to triplets that span at most 1.4 years, so that measurements taken at 7, 8 and 8.3 years, form an acceptable triplet, while measurements taken at 7, 8 and 8.5 years are too far apart.
Results
The algorithm was able to analyse all images. The MRSD of the various bone indices are displayed for the Sjælland data as a contour plot in Fig. 2. The three classical indices have MRSD between 7.4% and 7.9%. The lowest value of MRSD is 6.66%, and it is obtained with the following a and b values, here quoted ± their 95% confidence limits:
 |
 |
The true optimal index is somewhere within this confidence range, and we choose to define the Paediatric Bone Index, PBI = A/(W1.33L0.33) to represent the preferred index; it has the aesthetic quality of being the geometric mean of the three classical indices. We adopt the measurement unit μm0.33 because it leads to PBI values in the convenient range 3–7. Using the approximation A ≈ πTW, we have
 |
The MRSD values for the Erasmus study are generally larger than for the Sjælland study, but their relative sizes are very similar, and MRSD is 7.5% for PBI in the Erasmus data.
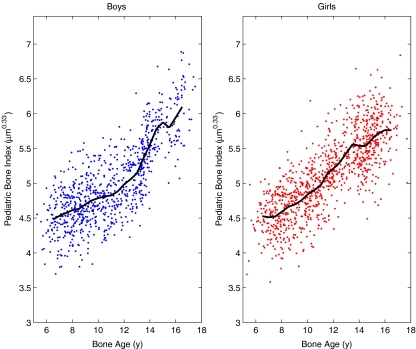
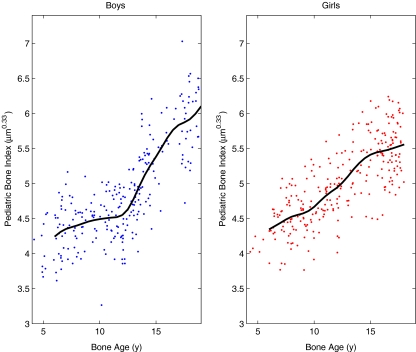
Figures 3 and 4 show the Sjælland and Erasmus data for PBI.
Fig. 3.
The PBI values of the Sjælland study. The solid curves indicate the average PBI in each half-year of bone age
Fig. 4.
The PBI data of the Erasmus study. The solid curves are smoothed versions of the average PBI as a function of bone age
Although the Sjælland study is very large, it is not well suited as a reference database for clinical use because the images are 43 years old, and they are of the right hand, whereas the left hand is used for bone age radiographs today. Instead, the recent Erasmus study of the left hand is used, so the average curves in Fig. 4 constitute the recommended PBI reference database for Caucasian children in Western Europe, and they are also listed in Table 1. The data do not show any significant variation in relative SD with bone age or sex, so a constant of 7.5% is used.
Table 1.
The mean PBI at each bone age value, as derived from the Erasmus study
| Bone age (years) | PBI boys (μm0.33) | PBI girls (μm0.33) |
|---|---|---|
| 6.0 | 4.24 | 4.35 |
| 6.5 | 4.31 | 4.39 |
| 7.0 | 4.35 | 4.44 |
| 7.5 | 4.38 | 4.49 |
| 8.0 | 4.40 | 4.53 |
| 8.5 | 4.43 | 4.55 |
| 9.0 | 4.46 | 4.57 |
| 9.5 | 4.48 | 4.61 |
| 10.0 | 4.49 | 4.67 |
| 10.5 | 4.50 | 4.74 |
| 11.0 | 4.51 | 4.82 |
| 11.5 | 4.52 | 4.88 |
| 12.0 | 4.55 | 4.94 |
| 12.5 | 4.63 | 5.01 |
| 13.0 | 4.78 | 5.10 |
| 13.5 | 4.95 | 5.20 |
| 14.0 | 5.12 | 5.29 |
| 14.5 | 5.26 | 5.36 |
| 15.0 | 5.38 | 5.41 |
| 15.5 | 5.51 | 5.44 |
| 16.0 | 5.65 | 5.46 |
| 16.5 | 5.76 | 5.48 |
| 17.0 | 5.83 | 5.50 |
| 17.5 | 5.87 | 5.53 |
| 18.0 | 5.92 | 5.56 |
| 18.5 | 5.99 | 5.58 |
| 19.0 | 6.10 | 5.59 |
The standard deviation score (SDS) of a PBI measurement is computed as in the following example: A girl with BA = 10 years receives a measurement of PBI = 5.00 μm0.33. At this BA, the reference is 4.67 μm0.33 (from Table 1) so
 |
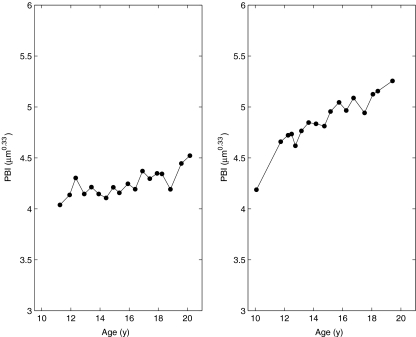
Figure 5 shows the longitudinal development of PBI for two boys from the Seiiku study. The number of triplets in the Seiiku data which span less than 1.4 years is 179, and the average span of these is 0.98 years. The precision is determined from these to 1.42% [1.27; 1.57] 95% confidence. This is an upper limit on the true precision, so one can express this result as a precision error <1.57% with >97.5% confidence.
Fig. 5.
PBI values of two boys in the Seiiku study
The precision of the other indices are: MCI, 1.06%; ESI, 1.68%; and DXR, 1.64%; and the precision of the underlying length measurements are: W, 53 μm; M, 36 μm; T, 27 μm; L, 0.32 mm; where M = W − 2T is the medullar width.
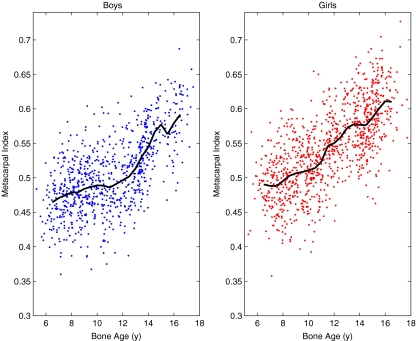
Figure 6 shows MCI versus bone age. MCI has MRSD 7.9%, whereas PBI in Fig. 3 has MRSD 6.7%, and one can appreciate that the spread of the data is indeed larger in MCI, whereas the shapes of the average curves are quite similar.
Fig. 6.
The MCI values of the Sjælland study. The solid curves indicate the average MCI in each half-year of bone age
Discussion
The meta-principle
We have proposed the meta-principle that the bone index should have the minimum relative standard deviation in a healthy population. This principle derives from the conjecture that, for healthy subjects, the body successfully balances the amount of bone formed with the overall dimensions of the body and the developmental stage, so that there is neither too little nor too much bone. We thus assume that nature is economical and has learned, by natural selection, to adapt the amount of bone to the environment, understood in the widest sense of the word. Therefore, healthy children of different heights and proportions all have the optimum amount of bone, to a good approximation, and PBI is the formula of this biomechanical balance determined by evolution.3
Accordingly, PBI is hypothesised as the preferred index for the diagnosis of disorders that disturb the optimum bone balance. If we define a pathological bone mass as a 2 SD deviation, then with a bone index with a relative SD of 7.5%, a 16% deficiency in cortical bone is pathological, while with an index with a relative SD of 8.5%, it is not, i.e. all subjects with a deviation between 15% and 17% cannot be diagnosed. Alas, this design principle could lead to the best sensitivity to pathological conditions.
However, we stress that this design is based on a hypothesis, and the intention of the analysis was mainly to place the classical indices in perspective and provide guidance for constructing new indices, including indices exploiting that we now also have the bone length L available. The present work is thus to be considered a pilot study to encourage new comparative studies of the clinical value of PBI and other indices.
Comparison with DEXA and pQCT
This section enumerates the advantages and weaknesses of PBI (and similar indices, like MCI) relative to the established methods DEXA and pQCT in paediatric patients.
All radiogrammetry methods measure the volume of bone tissue rather than its mineral content. If mineralization is a constant, as is the case in healthy subjects, this is the same thing. But some disorders alter the degree of mineralization, and radiogrammetry is insensitive to this. Many would consider this to be a weakness of the radiogrammetric method—it is sensitive to osteopenia, defined as a decrease in the amount of bone tissue, but insensitive to osteomalacia, i.e. a decrease in the mineral content of bone.
A limitation of all radiogrammetric methods performed on metacarpals is that they measure only cortical bone, and they measure at a site different from the most relevant sites of fractures, e.g. spine and hip. Notice, however, that the main reason for measuring bone mass in children is not to estimate fracture risk at specific sites but rather to assess the general bone mass accrual during childhood.
pQCT provides more detailed information on bone geometry than PBI. Notice, however, that the radiogrammetric method can also give specific information on bone length and inner and outer diameters.
In comparison with DEXA and pQCT, PBI has the advantage that it takes only a fraction of a second to record the image, so movement artefacts are not a problem.
The effective radiation dose of a hand X-ray is very small, 0.10–0.12 μSv for children of age 10–15 year, corresponding to less than 30 min of the background radiation [18]. The effective radiation dose for a spine DEXA for 10–15-year-old children is 7.1–5.0 μSv, if the appropriate paediatric software is used. [19]. This is about 50 times more than for a hand X-ray. The adult effective dose values of pQCT range from less than 1 μSv for a single slice to 25–50 μSv, depending on the system and technique used [20]. Thus, the radiation dose of PBI is much smaller than for the conventional methods.
If PBI is based on an X-ray taken for the purpose of bone age determination, the PBI measurement is obtained at no extra radiation dose or cost. PBI could be an efficient screening tool prior to the use of more elaborate bone densitometers, in particular in regions of the world where bone densitometers are not within easy reach.
Effect of image magnification
MCI and ESI (and all other indices with a + b = 2) have the advantage of being scale-invariant, i.e. if the radiographic bone image is magnified, the index is unchanged. PBI is not scale-invariant. The standard geometry of bone age hand X-rays is a distance from the X-ray tube to the detector (film–focus distance) of 1 m and a distance from the centre of the metacarpals to the detector of 1.5 cm. The magnification is then 1.5%, and the PBI reference database presented here corresponds approximately to this geometry (the Erasmus study actually used a film–focus distance of 1.5 m leading to a magnification of only 1%, but we have ignored this).
In practice, the magnification can deviate up to 2% from this standard. For instance, the object–film distance could occasionally be 3.5 cm (without knowing this), and this gives 2% larger magnification. This leads to a 2% increase in DXR, which is significant, given that the precision is less than 2%. The effect on PBI is only 0.67%, which is much more acceptable. Thus PBI’s sensitivity to untold magnification is within an acceptable range under normal circumstances.
PBI was found to be 5.3% lower in the left hands of the Erasmus study compared to the right hands of the Sjælland study. About 0.8% of this is expected from the shorter distance to the X-ray tube in the Sjaelland study, and the remaining 4.5% could be due to several factors: (1) a higher bone content in the dominant compared to the non-dominant hand, (2) a secular trend or (3) a regional difference.
Precision
The inner border (M) of the cortex is determined much more precisely (36 μm) than the outer border (W; 53 μm), presumably because the outer border is a sharp edge, which is much more vulnerable to variability of the sharpness of the image.
The precision errors 1.42% for PBI and 1.64% for DXR are larger than the result of 0.60% published for DXR-BMD [17]. There can be several reasons for this difference: The population studied here has a mean cortical thickness of 1.3 mm (equal to the average T of Caucasian children of age 10 years), whereas the typical adult value is 2.0 mm. Furthermore, the published DXR results represent short-term precision. Finally, our method only gives an upper limit to the true precision. We believe that our estimate is realistic for the typical clinical situation, so a treatment effect in PBI observed in a specific subject must be at least 2√2 × 1.42% = 4.0% to be significant.
Perspective
PBI shares with DEXA and pQCT the challenge that we do not have a clear understanding of the clinical relevance and meaning of bone mass measurements in children. We merely know that various disorders lead to reduced bone mass, while we have little quantitative knowledge of the relationship between bone mass and health risk.
The PBI method might help clarify this fundamental issue because large bone-age studies have been performed in the past, and this allows retrospective studies where the PBI in childhood is related to incidence of fractures later in childhood or even in adulthood. It would not be possible to perform such studies with DEXA, since very few DEXA measurements of children were made more than 10 years ago. Existing bone age studies can also be exploited to easily gather reference data for a wide range of populations and ethnicities.
An additional benefit could be derived from the frequent use of hand X-rays in orthodontics. By collecting information on fractures for these children, one could assess the ability of PBI to predict fractures, expressed as the area under a receiver–operator curve or as the increase in fracture incidence per 1 SDS of PBI. Such a study would also allow a comparison of the bone indices studied in this paper; we conjecture that PBI will be optimal.
Conclusion
This paper has presented an automated method for performing classical radiogrammetry for assessment of bone mass in children. This is the first time that a dedicated paediatric algorithm, which can analyse all images over a wide age range and which adjusts the size of the ROI to the size of the hand, has been implemented. It is also the first time the precision of radiogrammetry in children has been reported.
We set up a framework of bone indices encompassing the three classical radiogrammetric bone indices (Fig. 2), and this led us to stipulate that the new Paediatric Bone Index is the preferred index for a paediatric population. However, it is stressed that this is still hypothetical, and the MCI, for instance, could still be a better predictor of fracture risk.
The main limitations of the radiogrammetric methods are that they measure only cortical bone, they are insensitive to abnormal mineralisation, and they measure on a small part of the skeleton which might not be representative of the whole skeleton.
A reference data base for modern Caucasian children was presented which allows for the determination of PBI SDS in clinical practice.
PBI can be used to analyse retrospective studies, and this could lead to a rapid increase in our knowledge of the relationship between bone mass in childhood and future fracture risk.
Acknowledgement
We would like to thank Sven Helm for providing access to the Sjælland study and Novo Nordisk for making the VIDAR film scanner available.
Conflicts of interest H. H. Thodberg is the owner of Visiana, which develops, owns and markets the BoneXpert technology for automated determination of bone age, which also includes the Paediatric Bone Index method described in this paper. For all other authors, none.
Footnotes
These paths are constructed using dynamic programming [15]. The original image has a resolution of 150 dpi, corresponding to a pixel size 170 × 170 μm. The algorithm first resamples the image in each ROI to an image with pixels aligned with the bone axis. The new pixel size is 850 μm along the bone axis and 186 μm across the bone axis. A typical ROI extends 1.5 mm along the bone axis or approximately 17 pixels (Fig. 1 shows the path at every second of these pixels inside each ROI). The outer and inner borders of the cortex are thus determined approximately 6 × 17 ≈ 100 times with a resolution of 186 μm in the six cortical areas of the three middle metacarpals, i.e. there are approximately 100 determinations of the cortical thickness. Since the precision SD error from rounding to an integer is approximately 0.3, the precision error from “pixelisation” of the cortex border is 0.3 × 186 μm = 56 μm, and the precision error on T from pixelisation is 56 × √2 μm = 79 μm. Averaging T over the 100 independent determinations yields a precision SD of about 8 μm. The observed precision on T is (as mentioned in the “Results” section) 27 μm. Using a finer pixel size would thus, at best, reduce the precision to 26 μm. This shows that the used image resolution is well adapted to the problem at hand.
If the three measurements are not taken with even intervals, e is defined as e = PBI2 − PBIinterpolate, where PBIinterpolate is the linear interpolation of PBI1 and PBI3 to the time of PBI2.
We considered using the term Bone Health Index (BHI) as an alternative name for PBI to reflect that this index is derived as the expression describing the bone balance in healthy children. However, that would perhaps suggest that there is evidence for a good relation between BHI and fracture risk; we do not yet have studies to support that, so we use the more neutral term PBI.
References
- 1.Tanner JM, Healy MJR, Goldstein H, Cameron N. Assessment of skeletal maturity and prediction of adult height (TW3 Method) London: WB Saunders; 2001. [Google Scholar]
- 2.Binkovitz LA, Henwood MJ. Pediatric DXA: technique and interpretation. Pediatric Radiology. 2007;37:21–31. doi: 10.1007/s00247-006-0153-y. [DOI] [PMC free article] [PubMed] [Google Scholar]
- 3.Moyer-Mileur LJ, Quick JL, Murray MA. Peripheral quantitative computed tomography of the tibia: pediatric reference values. Journal of Clinical Densitometry. 2008;11:283–294. doi: 10.1016/j.jocd.2007.11.002. [DOI] [PubMed] [Google Scholar]
- 4.Thodberg HH, Kreiborg S, Juul A, Pedersen KD. The BoneXpert method for automated determination of skeletal maturity. IEEE Trans Med Imaging. 2009;28:52–66. doi: 10.1109/TMI.2008.926067. [DOI] [PubMed] [Google Scholar]
- 5.Martin DD, Deusch D, Schweizer R, Binder G, Thodberg HH, Ranke MB. Clinical application of automated Greulich-Pyle bone age in children with short stature. Pediatr Radiol. 2009;39:598–607. doi: 10.1007/s00247-008-1114-4. [DOI] [PubMed] [Google Scholar]
- 6.Rijn RR, Lequin MH, Thodberg HH. Automatic determination of Greulich and Pyle bone age in healthy Dutch children. Pediatric Radiology. 2009;39:591–97. doi: 10.1007/s00247-008-1090-8. [DOI] [PubMed] [Google Scholar]
- 7.Thodberg HH. Clinical review: an automated method for determination of bone age. Journal of Clinical Endocrinology & Metabolism. 2009;94:2239–2244. doi: 10.1210/jc.2008-2474. [DOI] [PubMed] [Google Scholar]
- 8.Barnett E, Nordin KS. The radiological diagnosis of osteoporosis: a new approach. Clin Radiol. 1960;11:166–174. doi: 10.1016/S0009-9260(60)80012-8. [DOI] [PubMed] [Google Scholar]
- 9.Morgan DB, Spiers FW, Pulvertaft CN, Fourman P. The amount of bone in the metacarpal and the phalanx according to age and sex. Clin Radiol. 1967;18:101–108. doi: 10.1016/S0009-9260(67)80137-5. [DOI] [PubMed] [Google Scholar]
- 10.Exton-Smith AN, Millard PH, Payne PR, Wheeler EF. Method for measuring quantity of bone. Lancet. 1969;2:1153–1154. doi: 10.1016/S0140-6736(69)92482-9. [DOI] [PubMed] [Google Scholar]
- 11.Rijn RR, Grootfaam DS, Lequin MH, Boot AM, Beek RD, Hop WCJ, Kuijk C. Digital radiogrammetry of the hand in a pediatric and adolescent Dutch Caucasian population: normative data and measurements in children with inflammatory bowel disease and juvenile chronic arthritis. Calcified Tissue International. 2004;74:342–350. doi: 10.1007/s00223-003-0020-x. [DOI] [PubMed] [Google Scholar]
- 12.Helm S. Skeletal maturity in Danish schoolchildren assessed by the TW2 method. Am J Phys Anthropol. 1979;51:345–352. doi: 10.1002/ajpa.1330510305. [DOI] [PubMed] [Google Scholar]
- 13.Lequin MH, Rijn RR, Robben SG, Hop WC, Kuijk C. Normal values for tibial quantitative ultrasonometry in Caucasian children and adolescents (aged 6 to 19 years) Calcif Tissue Int. 2000;67:101–105. doi: 10.1007/s00223001119. [DOI] [PubMed] [Google Scholar]
- 14.Thodberg HH, Olafsdottir H. Adding curvature to minimum description length shape models. Proceedings of British Machine Vision Conference. 2003;2:251–260. [Google Scholar]
- 15.Sonka M, Hlavac V, Boyle R. Image processing, analysis, and machine vision 2nd edn. Singapore: International Thomson; 1999. [Google Scholar]
- 16.Wishart JM, Horowitz M, Bochner M, Need AG, Nordin BEC. Relationships between metacarpal morphometry, forearm and vertebral bone density and fractures in postmenopausal women. Br J Radiol. 1993;66:435. doi: 10.1259/0007-1285-66-785-435. [DOI] [PubMed] [Google Scholar]
- 17.Rosholm A, Hyldstrup L, Baeksgaard L, Grunkin M, Thodberg HH. Estimation of bone mineral density by digital X-ray radiogrammetry: theoretical background and clinical testing. Osteoporos Int. 2001;12:961–969. doi: 10.1007/s001980170026. [DOI] [PubMed] [Google Scholar]
- 18.Huda W, Gkanatsios NA. Radiation dosimetry for extremity radiographs. Health Phys. 1998;75:492–999. doi: 10.1097/00004032-199811000-00005. [DOI] [PubMed] [Google Scholar]
- 19.Blake GM, Naeem M, Boutros M. Comparison of effective dose to children and adults from dual X-ray absorptiometry examinations. Bone. 2006;38:935–942. doi: 10.1016/j.bone.2005.11.007. [DOI] [PubMed] [Google Scholar]
- 20.Prevrhal S, Engelke K, Genant HK (2008) pQCT: peripheral quantitative computed tomography. In Grampp S (ed) Radiology of osteoporosis. Springer, pp 146


