

Abstract
Background
Several studies have now shown corpus callosum abnormalities using diffusion tensor imaging (DTI) in children with fetal alcohol spectrum disorders (FASD) in comparison with nonexposed controls. The data suggest that posterior regions of the callosum may be disproportionately affected. The current study builds on previous efforts, including our own work, and moves beyond midline corpus callosum to probe major inter-hemispheric white matter pathways with an improved DTI tractographic method. This study also expands on our prior work by evaluating a larger sample and by incorporating children with a broader range of clinical effects including full-criteria fetal alcohol syndrome (FAS).
Methods
Participants included 33 children with FASD (8 FAS, 23 partial FAS, 2 static encephalopathy) and 19 nonexposed controls between the ages of 10 and 17 years. Participants underwent DTI scans and intelligence testing. Groups (FASD vs. controls) were compared on fractional anisotropy (FA) and mean diffusivity (MD) in 6 white matter tracts projected through the corpus callosum. Exploratory analyses were also conducted examining the relationships between DTI measures in the corpus callosum and measures of intellectual functioning and facial dysmorphology.
Results
In comparison with the control group, the FASD group had significantly lower FA in 3 posterior tracts of the corpus callosum: the posterior mid-body, the isthmus, and the splenium. A trend-level finding also suggested lower FA in the genu. Measures of white matter integrity and cognition were correlated and suggest some regional specificity, in that only posterior regions of the corpus callosum were associated with visual-perceptual skills. Correlations between measures of facial dysmorphology and posterior regions of the corpus callosum were nonsignificant.
Conclusions
Consistent with previous DTI studies, these results suggest that microstructural posterior corpus callosum abnormalities are present in children with prenatal alcohol exposure and cognitive impairment. These abnormalities are clinically relevant because they are associated with cognitive deficits and appear to provide evidence of abnormalities associated with prenatal alcohol exposure independent of dysmorphic features. As such, they may yield important diagnostic and prognostic information not provided by the traditional facial characteristics.
Keywords: Diffusion Tensor Imaging; Brain; Fetal Alcohol (FAS, FASD)
With an estimated incidence of up to 0.9%, Fetal Alcohol Spectrum Disorders (FASD) represent a serious public health problem (Centers for Disease Control and Prevention, 2005; Sampson et al., 1997; Sokol et al., 2003). A diagnosis of FAS is typically made with consideration of 4 criteria: (i) prenatal alcohol exposure (documented or not-documented); (ii) dysmorphic facial features; (iii) growth deficiency; and (iv) CNS dysfunction (Hoyme et al., 2005; Jones and Smith, 1973). However, FAS represents one specific outcome of prenatal alcohol exposure. It is wellestablished in the literature that most prenatally exposed individuals do not display the physical characteristics of FAS (growth deficiency and facial dysmorphology), but many do have structural brain anomalies and neurocognitive impairment (Bookstein et al., 2001; Mattson et al., 1998; Sowell et al., 2001a). Cognitive deficits have been documented among individuals with FASD in multiple domains including intelligence, attention, language, visual-spatial skills, learning and memory, motor skills, and executive functioning (Kodituwakku, 2007). However, individual cognitive status varies considerably, which is likely due to a host of genetic and environmental factors (e.g., pattern and timing of alcohol exposure, nutrition, postnatal environment) that impact phenotypic expression and development. As a result of new evidence, the term FASD is now commonly used to encompass the full spectrum of effects, ranging from subtle physical, cognitive, and behavioral effects to the more severe end of the spectrum occupied by FAS.
Characterizing the range of underlying neurodevelopmental abnormalities among individuals across the spectrum of FASD is crucial. The goal of the current study was to replicate our initial finding of microstructural abnormalities in midline corpus callosum in children with FASD (Wozniak et al., 2006) and to more broadly evaluate the status of inter-hemispheric white matter tracts projecting into the cerebral hemispheres. An additional focus of the study was on identifying relationships between white matter status and cognitive functioning.
The neuroimaging method employed in the current study, diffusion tensor imaging (DTI), is uniquely suited to the study of children with neurodevelopmental conditions involving subtle white matter abnormalities such as FASD. Whereas traditional magnetic resonance imaging (MRI) evaluates macrostructural aspects of brain status, including overall brain size, gray and white matter volumes, and specific regional volumes, DTI provides information on brain microstructure (Beaulieu, 2002; Le Bihan, 2003; Mori and Zhang, 2006; Neil et al., 2002; Wozniak et al., 2008). The sensitivity of DTI techniques to normal developmental changes that occur in white matter microstructure with age (Ashtari et al., 2007; Barnea-Goraly et al., 2005; Ben Bashat et al., 2005; Bonekamp et al., 2007; Eluvathingal et al., 2007; Hasan et al., 2008; Salat et al., 2005; Schmithorst et al., 2002; Snook et al., 2005; Wozniak and Lim, 2006) and their relationship to changes in cognitive functioning over development (Fryer et al., 2008; Liston et al., 2006; Mabbott et al., 2006; Muetzel et al., 2008; Olson et al., 2008; Qiu et al., 2008; Schmithorst et al., 2005) make DTI methods uniquely appropriate for the study of conditions like FASD in children.
DTI provides measures of the magnitude and directionality of water diffusion in tissue (Basser and Pierpaoli, 1995; Basser et al., 1994; Le Bihan, 1995; Moseley et al., 1990). Unrestricted water molecules diffuse equally in all directions in Brownian motion—often referred to as isotropic diffusion (as indicated by high mean diffusivity or MD). In contrast, with the presence of barriers such as cell membranes, cellular structures, and myelin, the diffusion occurs more readily in 1 direction (often in the direction of fiber bundles) and is termed anisotropic diffusion. In highly-ordered tissue such as white matter, DTI measures typically reflect relatively unrestricted diffusion along the principal direction of axons and comparatively little diffusion in the plane perpendicular to the axons (as indicated by high fractional anisotropy or FA, a commonly used metric of anisotropic diffusion). Abnormal brain development or acquired damage can result in lower FA and higher MD values in white matter (Neil et al., 2002). FA, MD, and other DTI measures collected across the whole brain can be examined using a number of different selection approaches. Voxel-wise methods, including the recently developed Tract-Based Spatial Statistics (TBSS) approach (Smith et al., 2006), allow for detailed comparisons at the level of the image resolution across all of the voxels in the brain. Another approach uses underlying anatomy to guide the placement of 2-dimensional or 3-dimensional regions of interest (ROIs). Using this method, mean FA and MD values for the ROIs can be compared across groups. A third voxel-selection method, tractography, uses one of a number of algorithms to test if a single voxel in the image is “connected” with the neighboring voxel, thus generating 3-dimensional representations of white matter fiber bundles (Basser et al., 2000; Behrens et al., 2003). Although DTI tractography methods have important technical limitations, including low spatial resolution and potential inaccuracies due to crossed fibers, they are useful in vivo tools that contribute unique information to the investigation of anatomical connectivity in the developing brain.
Thus far, 6 published DTI studies have investigated microstructural white matter integrity in the corpus callosum in FASD. As illustrated in Table 1, all 6 studies report abnormalities in the corpus callosum, most consistently in posterior regions. The studies vary with respect to methodology and to the presence or absence of additional findings.
Table 1.
Summary of DTI Studies Demonstrating Corpus Callosum Abnormalities in FASD
| Study [sample] | FASD sample size | DTI voxel-selection method | Group differences in anterior CC | Group differences in posterior CC | CC Regions with sig. group differences | Cohen's d effect sizes |
|---|---|---|---|---|---|---|
| Ma et al. (2005) [adults] | 9 (all FAS) | 2 ROIs in genu and splenium | X | X | Genu FA | –3.0 |
| Genu ADC | 2.4 | |||||
| Splenium FA | –1.2 | |||||
| Splenium ADC | 1.5 | |||||
| Wozniak et al. (2006) [children] | 13 (0 FAS) | 6 ROIs | X | Isthmus MD | 1.1 | |
| Sowell et al. (2008a) [children] | 17 (4 FAS) | Voxel-wise and ROIs | X | Lateral Splenium FA | –1.1 to –1.2 | |
| Lebel et al. (2008) [children] | 24 (2 FAS) | Tractography | X* | X | Genu MD* | NA, sig. low |
| Splenium FA | NA, sig. low | |||||
| Fryer et al. (2009) [children] | 15 (9 FAS) | Voxel-wise and ROIs | Body of CC FA | NA, sig. low | ||
| Li et al. (2009) [adults] | 57 (28 with dysmorphia; 29 without) | Tract-based spatial statistics | X | Isthmus FA (DYS vs. CTL) | –0.7 | |
| Isthmus MD (DYS vs. CTL) | –0.7 | |||||
| Isthmus RD (DYS vs. CTL) | –0.8 | |||||
| Wozniak et al. (current data) [children] | 33 (8 FAS) | Tractography | X | Posterior Mid-body FA | –0.7 | |
| Isthmus FA | –0.7 | |||||
| Splenium FA | –0.8 |
CC = corpus callosum; FA = fractional anisotropy; ADC = apparent diffusion coefficient; MD = mean diffusivity; RD = radial diffusivity; NA = not available; sig. low = significantly lower values were seen in FASD; DYS = dysmorphic facial features present; CTL = control group.
Lebel et al. unexpectedly found decreased MD in genu in subjects with FASD.
The first DTI study (Ma et al., 2005) included young adults (age 18 to 25) with FAS (n = 9) and examined callosal integrity in hand drawn ROIs in the genu and splenium. Lower FA for the FAS group was found in both ROIs, suggesting abnormalities in alcohol-exposed individuals. In a study examining children (age 10 to 13) with FASD (n = 13, 0 FAS), we identified predominately posterior corpus callosum abnormalities (Wozniak et al., 2006). Six midline corpus callosum ROIs were examined and the data revealed higher MD in the isthmus region for children with FASD compared with control subjects. Sowell and colleagues (2008a) found lower FA in children (age 7 to 15) with FASD (n = 17, 4 FAS) in lateral aspects of the splenium using a whole-brain voxel-based analysis. The DTI microstructural abnormalities corresponded to anomalies in white matter macrostructure (tissue volumes). In that study, lower FA values in the splenium correlated with poorer performance on a measure of visuomotor skill for children with prenatal alcohol exposure. Lebel and colleagues (2008) used DTI tractography in a sample of children (age 5 to 12) with FASD (n = 24, 2 FAS). Compared with control subjects, alcohol-exposed children had lower FA in the splenium tract and lower MD for the tract involving the genu. The latter finding of lower genu MD in the FASD group is noteworthy because lower MD typically reflects a higher degree of fiber coherence / organization and is in contrast with findings from the Ma and colleagues (2005) study. Fryer and colleagues (2009) reported lower FA in the body of the corpus callosum in a group of children (age 8 to 18) with heavy prenatal alcohol exposure (n = 15, 9 FAS) compared with controls. Most recently, Li and colleagues (2009) reported low FA, high MD, and high radial diffusivity (RD) in the isthmus of the corpus callosum among adults (age 19 to 27) with FASD (with dysmorphic facial features) (n = 28) compared with controls (n = 25). Although Li and colleagues did not observe statistically significant differences between an FASD group without dysmorphic facial features (n = 29) and controls, the FA, MD, and RD values fell between the other 2 groups, suggesting a continuum of effects. Variability in findings across studies may be due to differences in age, diagnosis, severity, sample size, and DTI methodology. Nevertheless, the data from these 6 studies are strikingly consistent in showing corpus callosum abnormalities in individuals with FASD, including those who do not meet full criteria for FAS.
At this point, the available corpus callosum DTI data appear to complement the published findings on macrostructural abnormalities in FASD. Volumetric abnormalities in the corpus callosum have been reported and detailed analyses have revealed notable alterations in posterior regions of the callosum including the splenium (Riley et al., 1995; Sowell et al., 2001a). Differences in callosal shape and displacement of posterior callosum have also been observed in individuals with prenatal alcohol exposure (Bookstein et al., 2001, 2002a) and have been shown to be associated with cognitive deficits including verbal learning (Sowell et al., 2001a), motor skill (Roebuck et al., 2002), and executive functioning (Bookstein et al., 2002b). Absence of the corpus callosum (agenesis) has also been noted in children and adolescents prenatally exposed to alcohol, as have less severe alterations including thinning, hypoplasia, and partial agenesis (e.g., Autti-Ramo et al., 2002; Riley et al., 1995; Swayze et al., 1997).
Structural MRI and DTI studies examining brain regions other than the callosum also highlight the apparent vulnerability of white matter to prenatal alcohol exposure. Although brain volume is reduced overall in FASD (Archibald et al., 2001; Sowell et al., 2002; Swayze et al., 1997) white matter is disproportionately reduced compared with gray matter (Archibald et al., 2001; Lebel et al., 2008). Within the cerebrum, lobular analyses reveal volumetric reductions in the parietal, frontal, and temporal lobes; however, when the reduction in overall brain size is considered, only the parietal lobe is disproportionately reduced (Archibald et al., 2001; Sowell et al., 2002). Detailed regional analyses show reduced local growth in inferior parietal, perisylvian, and orbitofrontal regions (Sowell et al., 2002). Studies using voxel-based morphometry reveal decreased white matter and increased gray matter volumes in similar regions (Sowell et al., 2001b). Increased cortical thickness is also found in portions of the temporal, inferior parietal, and frontal lobes (Sowell et al., 2008b). Three DTI studies have examined microstructural integrity of white matter outside of the corpus callosum. Sowell and colleagues (2008a) reported significantly lower FA among those with FASD compared with control subjects in the right temporal lobe, inferior longitudinal fasciculus (ILF), inferior fronto-occipital fasciculus (IFOF), right internal capsule, and brainstem. Lebel and colleagues (2008) observed FA and/or MD abnormalities in multiple white matter tracts including the ILF and IFOF, cingulum, and superior longitudinal fasciculus. Fryer and colleagues (2009) reported multiple regions of lower FA among children with FASD compared with controls, with the largest clusters in bilateral occipital, right temporo-parieto-occipital junction, and left superior frontal regions.
Ultimately, studies detailing the impact of prenatal alcohol exposure on brain structure and function may contribute to improved diagnostic specificity and to the measurement of treatment effects for individuals with FASD. Understanding how structural brain abnormalities relate to key clinical variables, such as facial dysmorphology and cognitive functioning, will be important in achieving these goals. Notably, DTI studies have thus far not shown a clear relationship between underlying white matter microstructure and the level of facial dysmorphology (Ma et al., 2005; Wozniak et al., 2006). These findings suggest that measurements of physical anomalies and neuroimaging measures of brain integrity may provide unique, independent, and complementary information about the effects of prenatal alcohol exposure on the individual.
For the current study, we recruited a new, larger sample including alcohol-exposed children with static encephalopathy, partial FAS, and FAS. In addition to attempting to replicate our previous findings (Wozniak et al., 2006), we also utilized tractography to build on our findings and allow for comparisons across studies. Because imaging studies of this type typically involve small samples, replication is important and will increase confidence in the findings. In the case of FASD, including a larger, more representative sample of the spectrum may also provide clarification to the findings from previous studies. Based on the macrostructural findings associated with FASD discussed above and knowledge of the regions of the corpus callosum that are connected to these cortical areas (Huang et al., 2005), we hypothesized that children with FASD would exhibit abnormalities in multiple regions of the corpus callosum, especially in posterior regions including the isthmus and splenium.
Methods
Subjects
All subjects were of age 10 to 17. A total of 33 children with FASD were recruited from the University of Minnesota's Fetal Alcohol Spectrum Disorders Clinic. Nineteen control subjects with no prenatal alcohol exposure were also included. Control subjects were recruited from a large metropolitan area via posted advertisements in stores, laundromats, libraries and other public buildings across a diverse range of neighborhoods with a wide range of socioeconomic level. All children with FASD were seen clinically by a pediatric psychologist and a developmental pediatrician with formal training and more than 10 years experience using the 4-Digit Diagnostic System (Astley and Clarren, 2000). MRI scans were completed within 1 year of the examination of dysmorphic facial features. The diagnostic system classifies individuals on 4 criteria: (i) growth, (ii) facial characteristics, (iii) CNS status, and (iv) alcohol exposure. Full-criteria FAS is defined by growth deficiency (< 10th percentile height and weight or <third percentile on either), severe facial abnormalities (abnormally thin upper lip, abnormally smooth philtrum, and palpebral fissure width more than 2 SD outside mean), moderate or severe CNS impairment (microcephaly and/or cognitive deficits more than 2 SD from mean in 3 or more domains), and confirmed alcohol use by the mother. Partial FAS (pFAS) is characterized by at least moderate facial abnormalities (one or more of: abnormally thin upper lip, abnormally smooth philtrum, or palpebral fissure width more than 2 SD outside mean), moderate or severe CNS impairment, and confirmed alcohol use by the mother during pregnancy. Growth deficiency is not required for pFAS. Static encephalopathy—alcohol exposed is characterized by moderate or severe CNS impairment and confirmed alcohol use by the mother during pregnancy. Dysmorphic facial features and growth deficiency are not required but may be present in static encephalopathy. For all 3 conditions (FAS, pFAS, and static encephalopathy—alcohol exposed), confirmed maternal alcohol consumption is required at either a “high risk” level (estimated >100 mg/dl blood alcohol concentration weekly, early in pregnancy) or a lower level that is still associated with “some risk.”
Male and female children and adolescents with FAS (n = 8), pFAS (n = 23), and static encephalopathy—alcohol exposed (n = 2) were included in this study. All subjects with FASD had documentation of prenatal alcohol exposure, either by the biological parent or by social service records (rank 3 or 4 using Astley & Clarren's system). If maternal alcohol use was documented specifically as daily and chronic or consisting of weekly heavy binge drinking during pregnancy, a rank of 4 was assigned. Rank 3 was assigned for cases in which heavy maternal alcohol consumption was documented but was not daily nor were binge episodes weekly. For example, documentation of several heavy binge drinking episodes during pregnancy resulted in assigning a rank of 3. For purposes of this study, subjects were not included if maternal alcohol consumption was not heavy at any point and consisted only of minimal amounts (for example, a single drink consumed on several occasions during pregnancy). Subjects for whom prenatal alcohol exposure was only suspected but was neither self-reported by the biological mother nor observed by a third party were excluded. Subjects with FASD were excluded for other prenatal drug exposure (except nicotine and caffeine). Additional exclusion criteria for all subjects (FASD and controls) were the presence of another developmental disorder (e.g., autism, Down's syndrome), very low birthweight (< 1500 grams), neurological disorder, traumatic brain injury, other medical condition affecting the brain, substance abuse or dependence in the participant, or contraindications to safe MRI scanning. Control subjects were excluded for any history of prenatal substance exposure and for history of psychiatric disorder or learning disability. Table 2 contains the subject characteristics.
Table 2.
Subject Characteristics for FASD and Control Groups
| N(%) or mean ± SD | |||
|---|---|---|---|
| FASD (n = 33) | Control (n = 19) | Statistical test | |
| Age at MRI scan | 12.6 ± 2.2 yrs. | 12.6 ± 2.2 yrs. | t = −0.008, p = 0.994 |
| Gender | |||
| Male | 18 (55) | 12 (63) | χ2 = 0.37, p = 0.55 |
| Female | 15 (45) | 7 (37) | |
| Growth deficiency (FASD only) | |||
| Growth rating (Astley & Clarren) | |||
| 1. None | 20 (61) | – | – |
| 2. Mild | 5 (15) | – | – |
| 3. Moderate | 2 (6) | – | – |
| 4. Severe | 6 (18) | – | – |
| Facial features (FASD only) | |||
| (Astley & Clarren ratings) | |||
| 1. None | 0 (0) | – | – |
| 2. Mild | 2 (6) | – | – |
| 3. Moderate | 12 (36) | – | – |
| 4. Severe | 19 (58) | – | – |
| Alcohol exposure (FASD only) | |||
| (Astley & Clarren ratings) | |||
| 1. No risk | 0(0) | – | – |
| 2. Unknown risk | 0 (0) | – | – |
| 3. Some risk | 20 (61) | – | – |
| 4. High risk | 13 (39) | – | – |
| FASD category (Astley & Clarren) | |||
| Static encephalopathy (alcohol-exposed) | 2 (6) | – | – |
| Partial FAS | 23 (70) | – | – |
| FAS | 8 (24) | – | – |
| Cognitive functioning (Wechsler) | |||
| Verbal comprehension index | 79.5 (11.6) | 106.6 (11.5) | t = 8.14, p < 0.001 |
| Perceptual reasoning index | 84.8 (16.0) | 107.4 (12.5) | t = 5.28, p < 0.001 |
| Working memory index | 78.7 (14.8) | 102.3 (8.5) | t = 6.37, p < 0.001 |
| Processing speed index | 82.0 (14.4) | 103.1 (12.1) | t = 5.37, p < 0.001 |
| Full-Scale IQ | 76.9 (13.3) | 107.3 (11.1) | t = 8.39, p < 0.001 |
All procedures were approved by the University of Minnesota's Research Subjects' Protection Program and all subjects underwent a comprehensive informed consent procedure. Subjects were compensated with gift cards for their time.
Cognitive Evaluation
All subjects were administered either the Wechsler Intelligence Scales for Children—Fourth Edition (WISC-IV) (Wechsler, 2003) (age 10 to 16) or the Wechsler Adult Intelligence Scales—Third Edition (WAIS-III) (Wechsler, 1997) (age 17) by a research technician or doctoral-level psychology trainee. Many subjects with FASD were administered the test as part of their clinical evaluation whereas others were given the test at the time of the MRI scan. Control subjects were administered the IQ test at the time of the MRI. In all cases, the MRI scan was performed within 1 year of the IQ test.
MRI Acquisition and Processing
Subjects were scanned using a Siemens 3T Trio MRI scanner with an 8-channel parallel array head coil. The scan sequence was as follows:
Axial DTI: the 30-direction diffusion-weighted acquisition, positioned to cover the cerebrum and as much of the cerebellum as possible. Acquisition parameters for the dual spin echo, single shot, echo planar, diffusion weighted sequence were: TR = 8500 ms, TE = 90 ms, 64 slices, voxel size = 2 × 2 × 2 mm, FOV = 256 mm2, 1 average, GRAPPA with acceleration factor = 2, b = 1000 s/mm2). Thirty-six volumes each were collected to compute the tensor: 6 images with b = 0 s/mm2 and 30 images with diffusion gradients applied in noncollinear directions (6 minutes).
Field map: the field map was used to correct the DTI data for geometric distortion. Positioned to match the DTI acquisition. The acquisition parameters were: TR = 700 ms, TE = 4.62 ms/7.08 ms, 64 slices, voxel size = 2 × 2 × 2 mm FOV = 2562 mm (3 minutes).
Post-Processing
The imaging data were processed using tools from FMRIB's software library, including the brain extraction tool, linear registration tools (FLIRT), diffusion toolbox (FDT, BEDPOST, Probtrack), and dewarping tool (FUGUE). The DTI data were corrected for eddy current distortion, field maps were used to correct the resulting data for geometric distortions caused by susceptibility induced magnetic field inhomogeneity, and the diffusion tensor was then computed using FDT.
Corpus Callosum Parcellation and Tractography
We first defined corpus callosum seed regions of interest (ROIs) using a semi-automated approach. The DTI FA map for each subject was aligned to standard space (Montreal Neurological Institute—152 T1 mean brain) using a 12 degree of freedom affine registration. Next, a rectangular mask, 3 sagittal slices thick, was defined around the corpus callosum on the midline of standard-space FA map of each subject. This rectangular mask was partitioned into 6 regions based on delineations from Witelson (1989) by first manually identifying these landmarks: the anterior portion of the genu, posterior portion of the splenium, superior portion of the mid-body, inferior portion of the genu and splenium, and the boundary between the genu and rostral body. A single operator (M.L.N.) identified these landmarks for all subjects. These landmarks were used to define the mid-point, the anterior third, the posterior third and the posterior fifth of the corpus callosum. This resulted in 6 geometric masks (Fig. 1) that were registered back to the FA map in native space using the inverse of the abovementioned 12 degree of fit alignment. Witelson's seventh region, the rostrum, was not included as a separate region of interest due to its small size. A left-right segmentation mask was created by including voxels with FA > 0.3 and a principal eigenvector with a left–right component > 0.95. The left–right segmentation mask was then convolved with the 6 geometric masks defined in MNI space, together yielding a highly specific parcellation of the corpus callosum into 6 Witelson ROIs. Probabilistic tractography was then performed on each subject's DTI data with the FMRIB routine Probtrack, using the 6 corpus callosum ROIs as seed regions, yielding 6 inter-hemispheric connectivity distributions or tracts for every subject. A threshold was applied to the connectivity distributions to generate masks (Fig. 2), which were subsequently applied to the DTI data, allowing for computation of mean FA and MD values within each tract for each subject.
Fig. 1.
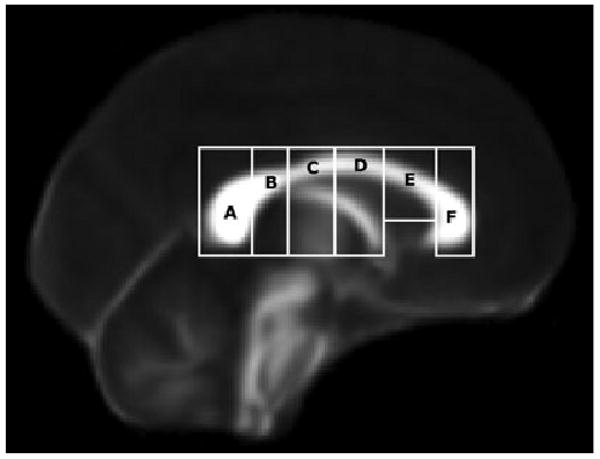
Six corpus callosum regions of interest (ROIs) as geometric masks, prior to being convolved with left-right segmentation maps. The regions, based on definitions from Witelson (1989) are as follows: (A) Splenium, (B) Isthmus, (C) Posterior Midbody, (D) Anterior Midbody, (E) Rostral Body, and (F) Genu. The masks are displayed on the FMRIB 58-subject average FA map. These ROI served as the seed points for the tractography.
Fig. 2.

Six inter-hemispheric connectivity distribution masks (tracts) generated by tractography: (anterior to posterior) 1. genu; 2. rostral body; 3. anterior mid-body; 4. posterior mid-body; 5. isthmus; 6. splenium.
Reliability of the Callosal Segmentation and Tractography Method
As part of the development of our corpus callosum segmentation and tractography technique, we undertook a pilot study examining its test–retest reliability. Thirteen healthy control subjects (7 male, 6 female), age 22 to 44, were scanned on the Siemens 3T Trio MRI on 2 separate occasions. Time between scans ranged from 1 to 29 weeks with a mean of 9.8 weeks, SD = 8.2 weeks. Fractional anisotropy (FA) was the dependent measure in this analysis. Intra-class correlations (2-way mixed model with absolute agreement for single measures) were high for all 6 tracts: Genu = 0.87; Rostral body = 0.86; Anterior mid-body = 0.55; Posterior mid-body = 0.63; Isthmus = 0.90; Splenium = 0.81. These findings indicate that the DTI data acquisition, postprocessing, and extraction of tract-based measures are reliable, consistent with other published studies (Bonekamp et al., 2007; Heiervang et al., 2006; Wakana et al., 2007).
Because one operator was used to define the corpus callosum landmarks for the current study, it is not possible to compute an interrater reliability measure. However, our own internal lab data show that the manual identification of these landmarks is highly reliable (> 0.9) across operators. This is most likely the case because the slices are relatively thick (2 mm) and, thus, the choice of the appropriate slices is typically very clear.
Results
Group Differences
A MANOVA testing for a group difference (31 FASD vs. 19 controls) in FA across all 6 tracts was significant [Wilks' Lambda = 0.742, F(6,45) = 2.61, p = 0.029]. Univariate analyses showed that the FASD group had significantly lower FA in 3 posterior tracts: the posterior mid-body, the isthmus, and the splenium. Effect sizes for these 3 tracts were large (0.71, 0.72, and 0.78 respectively). A second MANOVA testing for a group difference in MD was nonsignificant [Wilks' lambda = 0.857, F(6,43) = 1.25, p = 0.298]. Means, standard deviations, and effect sizes for FA and MD are included in Table 3.
Table 3.
Means, Standard Deviations (SD), and Univariate Test Results (following MANOVA) for Fractional Anisotropy (FA) and Mean Diffusion (MD) in 6 Corpus Callosum Tracts
| FASD (n = 33) | Control (n = 19) | Univariate tests following MANOVA (for FA only) | |||||
|---|---|---|---|---|---|---|---|
| Mean | SD | Mean | SD | F | p | Effect size (Cohen's d) | |
| Fractional anisotropy (FA) | |||||||
| Genu | 0.462 | 0.027 | 0.475 | 0.016 | 3.55 | 0.065 | 0.59 |
| Rostral body | 0.429 | 0.026 | 0.430 | 0.015 | 0.08 | 0.779 | 0.05 |
| Anterior mid-body | 0.424 | 0.025 | 0.424 | 0.020 | 0.0 | 0.986 | 0.0 |
| Posterior mid-body | 0.424 | 0.026 | 0.441 | 0.022 | 6.05 | 0.017 | 0.71 |
| Isthmus | 0.431 | 0.025 | 0.447 | 0.019 | 5.59 | 0.022 | 0.72 |
| Splenium | 0.462 | 0.030 | 0.481 | 0.017 | 6.64 | 0.013 | 0.78 |
| Mean diffusivity (MD) × 10−3 | |||||||
| Genu | 0.879 | 0.038 | 0.871 | 0.024 | 0.25 | ||
| Rostral body | 0.893 | 0.040 | 0.881 | 0.024 | 0.36 | ||
| Anterior mid-body | 0.921 | 0.037 | 0.927 | 0.033 | −0.17 | ||
| Posterior mid-body | 0.912 | 0.047 | 0.905 | 0.028 | 0.18 | ||
| Isthmus | 0.955 | 0.059 | 0.967 | 0.038 | −0.24 | ||
| Splenium | 0.895 | 0.064 | 0.876 | 0.043 | 0.34 | ||
Univariate test statistics for MD are not listed because the overall MANOVA for MD was nonsignificant.
p < 0.05; mean diffusivity values are × 10 −3 mm2/s
Dysmorphic Facial Characteristics
Data from our initial DTI study showed no relationship between dysmorphic features and mid-sagittal MD in the isthmus region (Wozniak et al., 2006). We conducted similar analyses with data from this second study in the 3 corpus callosum regions that showed group differences: posterior mid-body, isthmus, and splenium. Spearman correlations comparing facial dysmorphology (Astley & Clarren 1 to 4 rating) with FA and MD in these 3 regions for children with FASD were all nonsignificant, the highest correlation being only 0.14. Because the distribution of facial ratings was skewed (Table 2), the power of these correlational analyses was somewhat limited. As a further exploration of these relationships, we conducted independent-samples t-tests for FA and MD for the 3 corpus callosum regions, comparing the 2 largest rating categories: moderate facial features (36%) versus severe facial features (58%). None of these t-tests was significant and there were no noteworthy trends in these comparisons.
Cognitive Functioning
As expected, the FASD group performed significantly below the control group on all measures of cognitive functioning (Table 2). In order to explore the relationship between the observed corpus callosum abnormalities and cognitive functioning in those with FASD, we conducted a set of exploratory correlations between FA and MD in the anterior-most region (genu) and the posterior-most region (splenium) versus the 4 index scores from the Wechsler scales: Verbal Comprehension, Perceptual Organization, Working Memory, and Processing Speed in our sample of 31 FASD subjects. These analyses were done by group to avoid inflation in the correlations from the overall group differences. The genu and splenium ROIs were chosen to limit the number of statistical tests. Due to the exploratory nature of these correlations, we examined the results without correction for the 16 multiple comparisons. For the FASD group, a significant correlation between the Working Memory index score and FA in the genu was observed (r = 0.43, p = 0.013). Also, significant inverse correlations were observed between MD in the splenium and the Perceptual Organization index score (r = −0.45, p = 0.008) and the Working Memory Index score (r = −0.38, p = 0.033). There were no significant correlations between the Verbal Comprehension or Processing Speed indices and either genu or splenium FA or MD. In order to place these findings for the FASD group in context, we conducted the same set of correlations in the control group and found no significant relationships. Although these analyses are only exploratory and do not show a perfect double-dissociation, they do indicate a relationship between white matter integrity and cognition, and they suggest some regional specificity in that only posterior regions of the callosum were associated with visual-perceptual skills.
Discussion
The current findings of white matter microstructural abnormalities in posterior corpus callosum are consistent with our earlier results (Wozniak et al., 2006) and with other published studies (Lebel et al., 2008; Li et al., 2009; Ma et al., 2005; Sowell et al., 2008a). Here, we report low FA in the posterior mid-body, isthmus, and splenium regions. Previously, we had observed abnormalities only in the isthmus region as evidenced by increased MD among children with FASD compared with controls. Collectively, the available DTI literature (cited above) clearly indicates that abnormalities are present in these posterior regions, as well as elsewhere in the callosum, including the genu and the body (Fryer et al., 2009). These findings appear to be relatively consistent, but differences in diagnostic groups, sample sizes, and specific DTI methodologies employed may account for some of the differences in results across the studies. The notable difference between our 2006 finding of high MD in the isthmus and our current finding of low FA in the isthmus may be related to differences in samples and in DTI methods. The 2006 study did not include full FAS cases, whereas the current study did. In addition, the 2006 study looked at midline corpus callosum only, whereas the current study examined entire tracts projecting through the corpus callosum and into the hemispheres. The DTI methods utilized in the current study represent improvements over the methods used in our 2006 study in several respects: the current study utilized 30-direction DTI versus 12-direction DTI in the previous study; the currently methodology is less susceptible to “edge effects” or partial-voluming effects at the boundaries of the callosum; and the current study examined larger, 3-dimensional tracts as opposed to a single slice at the midline.
Thus far, in children with FASD (and in many other neurodevelopmental disorders), DTI measures are proving to be very sensitive to underlying abnormalities in tissue integrity against a background of predictable changes with normal development (Gao et al., 2008; Hasan et al., 2008; Hermoye et al., 2006; Huang et al., 2006; Qiu et al., 2008). DTI measures are also demonstrating important links between microstructural white matter integrity and cognitive functioning in normal development (Fryer et al., 2008; Muetzel et al., 2008), acquired injuries (Wilde et al., 2006; Wozniak et al., 2007), and neurodevelopmental disorders (Alexander et al., 2007; Sundaram et al., 2008; Thakkar et al., 2008).
One challenge posed by the findings of white matter abnormalities in DTI studies of prenatal alcohol exposure is in understanding the nature of the underlying pathophysiology and its implications for individual cognition and behavior. As more DTI studies are performed in humans and in animals, we discover more about the sensitivity of the technique to different types of underlying pathology. In white matter structures such as the corpus callosum, FA values are high because the linear structure and tight packing of bundled axons restricts water molecule diffusion mostly to 1 direction (along the axons) (Beaulieu, 2002; Neil et al., 2002). Conversely, MD, which represents the MD in all 3 directions, is typically low in highly organized white matter. Although myelin status plays a role in anisotropy (and is reflected in FA and MD), it is not the dominant contributing factor as made clear by studies showing significant anisotropy in unmyelinated fibers (Beaulieu and Allen, 1994a,b), relatively small differences in anisotropy between myelinated and unmyelinated fibers (Gulani et al., 2001), and the presence of significant anisotropy in human newborn brains prior to major myelination stages (Huppi et al., 1998; Inder and Huppi, 2000). Although FA and MD do change predictably with brain development and are affected to an extent by changes in myelination (Beaulieu, 2002; Neil et al., 1998; Nomura et al., 1994), it is important to recognize that FA and MD are not measures of myelin status or myelination level. In the context of a neurodevelopmental disorder such as FASD, the observed FA and MD differences may reflect structural abnormalities in the axons themselves, differences in axonal packing, differences in white matter water content, and even gross abnormalities in tract organization such as that seen in the extreme forms of agenesis and partial agenesis of the corpus callosum.
Another challenge posed by recent DTI findings in FASD is integrating these results with those from macrostructural studies of gray matter and white matter volumes, cortical thickness, and other morphometrics in FASD and, ultimately, incorporating the findings into a larger understanding of the brain damage that results from prenatal alcohol exposure. Human and animal studies examining the topography of the corpus callosum with histochemical methods or DTI (Hofer et al., 2007; Huang et al., 2005; de Lacoste et al., 1985; Matsunami et al., 1994; Pandya et al., 1971) are relatively consistent in defining the regional organization of fibers passing through the callosum. These studies suggest the following general topographic organization to the corpus callosum: orbitofrontal fibers project through the rostrum; fibers from the frontal lobe project through the genu and a large part of the anterior body of the callosum; parietal lobe fibers project through a wide portion of the posterior body of the callosum as well as the posterior-superior portion of the splenium; fibers from the temporal lobe are concentrated in the superior region of the splenium; and occipital lobe fibers are found in the inferior portion of the splenium. Thus, the consistent findings of posterior corpus callosum abnormalities in DTI studies suggest that temporal-parietal-occipital regions and associated junction regions may be of particular interest for future macrostructural and functional studies. Relatedly, these findings suggest that additional exploration of primary visual processes, visual perception, and visual organization may be warranted in individuals with FASD.
Although the current study did not include tasks assessing primary visual processing, a general measure of visualperception and nonverbal reasoning was available in the form of the Perceptual Reasoning Index score from the Wechsler scales. Analyses were conducted in a post-hoc, exploratory manner and, therefore, need to be considered preliminary at this point. The data, which showed a significant inverse correlation between perceptual reasoning ability and MD in the splenium and an absence of correlation with MD in the genu, suggest that DTI measures may be related to aspects of cognitive functioning that are clinically relevant to this population. These data are consistent with the findings of at least one other study which identified a relationship between white matter microstructure (FA) in the splenium and a measure of visual-motor integration (Sowell et al., 2008a). The exploratory analyses from the current study also demonstrated that higher scores on measures of working memory correlated with higher FA in the genu and lower MD in the splenium. The relationship between working memory, which many consider to be a component of executive functioning, and genu FA is intriguing, as is the unexpected finding of a potential relationship between working memory and splenium microstructural integrity. Clearly, future studies with more specific measures of neurocognitive functions will be able to expand on these results, potentially yielding new insights into the broad range of deficits observed in this population.
Lastly, we also conducted exploratory correlational analyses of the relationship between regional corpus callosum integrity and facial dysmorphology. Although midline facial anomalies and midline brain anomalies such as corpus callosum abnormalities may occur as part of the same processes during embryogenesis, there remains much to be learned about the impact of alcohol on developing organisms during gestation (Sulik, 2005). Thus far, human DTI studies in FASD are mixed with respect to the relationship between brain measures and facial dysmorphology. Our current data, together with our initial study (Wozniak et al., 2006), showed no relationship between facial characteristics and DTI measures of callosal integrity. In contrast, when comparing alcohol-exposed children with and without facial dysmorphia, Fryer and colleagues (2009) found that children with FAS who had dysmorphia had significantly lower FA in the mid-body of the corpus callosum than those without dysmorphia. Similarly, Li and colleagues showed that a group of adults without dysmorphic facial characteristics fell in between the control group and a group with dysmorphic features in terms of posterior callosal FA, MD, and RD. To some extent, the specific method of characterizing and quantifying the facial abnormalities in FASD may have implications for analyses of relationships between facial dysmorphia and brain abnormalities. Future studies employing embryo models may ultimately provide the most accurate information about the link and/or independence of facial features and callosal abnormalities.
Future studies in FASD will benefit from examining connectivity with multiple imaging techniques including DTI and resting-state fMRI, a newer method of measuring connectivity in the brain by evaluating relationships in functional brain activity in distant regions (Broyd et al., 2008; Greicius, 2008; Raichle and Snyder, 2007). Combining DTI and resting-state fMRI may be particularly fruitful in light of studies demonstrating abnormalities in other neurodevelopmental disorders and studies showing relationships between the 2 types of connectivity measures (Fair et al., 2008; Johnston et al., 2008; Skudlarski et al., 2008; Uddin et al., 2008).
Conclusion
The existing DTI data show evidence of microstructural white matter abnormalities in individuals who were exposed prenatally to alcohol. The precise pathology underlying these neuroimaging abnormalities is not yet known, but could be related to one or more characteristics of white matter organization including axonal size, density, packing, water content, and myelination. Because these abnormalities appear to be related to cognitive functioning, they may be critical in understanding the origins of the common deficits seen in FASD, including visual-perceptual abnormalities, attention and executive functioning deficits, and behavioral and emotional dysregulation. The fact that these particular brain abnormalities are not correlated with dysmorphic facial features in FASD suggests that these 2 characteristics may provide independent information about the effects of exposure on the individual. This independence also highlights the potential limitations of facial characteristics in terms of their sensitivity to the underlying syndrome and limitations in their capacity as measures of syndrome severity. Future studies incorporating DTI measures may benefit from the inclusion of fMRI-based connectivity measures and from increased consideration for the normal changes that occur in DTI parameters with brain development.
Acknowledgments
This work was supported by the Dana Foundation, the Archie D. and Bertha H. Walker Foundation (#555911785), the National Institutes of Health (5P41RR008079, 5K12RR023247, P30-NS057091, and MO1-RR00400), and the MIND Institute.
References
- Alexander AL, Lee JE, Lazar M, Boudos R, DuBray MB, Oakes TR, Miller JN, Lu J, Jeong EK, McMahon WM, Bigler ED, Lainhart JE. Diffusion tensor imaging of the corpus callosum in Autism. Neuroimage. 2007;34:61–73. doi: 10.1016/j.neuroimage.2006.08.032. [DOI] [PubMed] [Google Scholar]
- Archibald SL, Fennema-Notestine C, Gamst A, Riley EP, Mattson SN, Jernigan TL. Brain dysmorphology in individuals with severe prenatal alcohol exposure. Dev Med Child Neurol. 2001;43:148–154. [PubMed] [Google Scholar]
- Ashtari M, Cervellione KL, Hasan KM, Wu J, McIlree C, Kester H, Ardekani BA, Roofeh D, Szeszko PR, Kumra S. White matter development during late adolescence in healthy males: a cross-sectional diffusion tensor imaging study. Neuroimage. 2007;35:501–510. doi: 10.1016/j.neuroimage.2006.10.047. [DOI] [PubMed] [Google Scholar]
- Astley SJ, Clarren SK. Diagnosing the full spectrum of fetal alcohol-exposed individuals: introducing the 4-digit diagnostic code. Alcohol Alcohol. 2000;35:400–410. doi: 10.1093/alcalc/35.4.400. [DOI] [PubMed] [Google Scholar]
- Autti-Ramo I, Autti T, Korkman M, Kettunen S, Salonen O, Valanne L. MRI findings in children with school problems who had been exposed prenatally to alcohol. Dev Med Child Neurol. 2002;44:98–106. doi: 10.1017/s0012162201001748. [DOI] [PubMed] [Google Scholar]
- Barnea-Goraly N, Menon V, Eckert M, Tamm L, Bammer R, Karchemskiy A, Dant CC, Reiss AL. White matter development during childhood and adolescence: a cross-sectional diffusion tensor imaging study. Cereb Cortex. 2005;15:1848–1854. doi: 10.1093/cercor/bhi062. [DOI] [PubMed] [Google Scholar]
- Basser PJ, Mattiello J, LeBihan D. MR diffusion tensor spectroscopy and imaging. Biophys J. 1994;66:259–267. doi: 10.1016/S0006-3495(94)80775-1. [DOI] [PMC free article] [PubMed] [Google Scholar]
- Basser PJ, Pajevic S, Pierpaoli C, Duda J, Aldroubi A. In vivo fiber tractography using DT-MRI data. Magn Reson Med. 2000;44:625–632. doi: 10.1002/1522-2594(200010)44:4<625::aid-mrm17>3.0.co;2-o. [DOI] [PubMed] [Google Scholar]
- Basser PJ, Pierpaoli C. Elucidating tissue structure by diffusion tensor MRI. August 19–25, 1995; Paper presented at the Proceedings of the International Society for Magnetic Resonance in Medicine, Third Scientfic Meeting and Exhibition; Nice, France. 1995. [Google Scholar]
- Beaulieu C. The basis of anisotropic water diffusion in the nervous system - a technical review. NMR Biomed. 2002;15:435–455. doi: 10.1002/nbm.782. [DOI] [PubMed] [Google Scholar]
- Beaulieu C, Allen PS. Determinants of anisotropic water diffusion in nerves. Magn Reson Med. 1994a;31:394–400. doi: 10.1002/mrm.1910310408. [DOI] [PubMed] [Google Scholar]
- Beaulieu C, Allen PS. Water diffusion in the giant axon of the squid: implications for diffusion-weighted MRI of the nervous system. Magn Reson Med. 1994b;32:579–583. doi: 10.1002/mrm.1910320506. [DOI] [PubMed] [Google Scholar]
- Behrens TE, Johansen-Berg H, Woolrich MW, Smith SM, Wheeler-Kingshott CA, Boulby PA, Barker GJ, Sillery EL, Sheehan K, Ciccarelli O, Thompson AJ, Brady JM, Matthews PM. Non-invasive mapping of connections between human thalamus and cortex using diffusion imaging. Nat Neurosci. 2003;6:750–757. doi: 10.1038/nn1075. [DOI] [PubMed] [Google Scholar]
- Ben Bashat D, Ben Sira L, Graif M, Pianka P, Hendler T, Cohen Y, Assaf Y. Normal white matter development from infancy to adulthood: comparing diffusion tensor and high b value diffusion weighted MR images. J Magn Reson Imaging. 2005;21:503–511. doi: 10.1002/jmri.20281. [DOI] [PubMed] [Google Scholar]
- Bonekamp D, Nagae LM, Degaonkar M, Matson M, Abdalla WM, Barker PB, Mori S, Horska A. Diffusion tensor imaging in children and adolescents: reproducibility, hemispheric, and age-related differences. Neuroimage. 2007;34:733–742. doi: 10.1016/j.neuroimage.2006.09.020. [DOI] [PMC free article] [PubMed] [Google Scholar]
- Bookstein FL, Sampson PD, Connor PD, Streissguth AP. Midline corpus callosum is a neuroanatomical focus of fetal alcohol damage. Anat Rec. 2002a;269:162–174. doi: 10.1002/ar.10110. [DOI] [PubMed] [Google Scholar]
- Bookstein FL, Sampson PD, Streissguth AP, Connor PD. Geometric morphometrics of corpus callosum and subcortical structures in the fetal-alcohol-affected brain. Teratology. 2001;64:4–32. doi: 10.1002/tera.1044. [DOI] [PubMed] [Google Scholar]
- Bookstein FL, Streissguth AP, Sampson PD, Connor PD, Barr HM. Corpus callosum shape and neuropsychological deficits in adult males with heavy fetal alcohol exposure. Neuroimage. 2002b;15:233–251. doi: 10.1006/nimg.2001.0977. [DOI] [PubMed] [Google Scholar]
- Broyd SJ, Demanuele C, Debener S, Helps SK, James CJ, Sonuga-Barke EJ. Default-mode brain dysfunction in mental disorders: A systematic review. Neurosci Biobehav Rev. 2008;33:279–296. doi: 10.1016/j.neubiorev.2008.09.002. [DOI] [PubMed] [Google Scholar]
- Centers for Disease Control and Prevention. Morb Mortal Wkly Rep. Vol. 54. 2005. Guidelines for identifying and referring persons with Fetal Alcohol Syndrome; pp. 1–115. [PubMed] [Google Scholar]
- Eluvathingal TJ, Hasan KM, Kramer L, Fletcher JM, Ewing-Cobbs L. Quantitative diffusion tensor tractography of association and projection fibers in normally developing children and adolescents. Cereb Cortex. 2007;17:2760–2780. doi: 10.1093/cercor/bhm003. [DOI] [PMC free article] [PubMed] [Google Scholar]
- Fair DA, Cohen AL, Dosenbach NU, Church JA, Miezin FM, Barch DM, Raiche ME, Petersen SE, Schlaggar BL. The maturing architecture of the brain's default network. Proc Natl Acad Sci U S A. 2008;105:4028–4032. doi: 10.1073/pnas.0800376105. [DOI] [PMC free article] [PubMed] [Google Scholar]
- Fryer SL, Frank LR, Spadoni AD, Theilmann RJ, Nagel BJ, Schweinsburg AD, Tapert SF. Microstructural integrity of the corpus callosum linked with neuropsychological performance in adolescents. Brain Cogn. 2008;67:225–233. doi: 10.1016/j.bandc.2008.01.009. [DOI] [PMC free article] [PubMed] [Google Scholar]
- Fryer SL, Schweinsburg BC, Bjorkquist OA, Frank LR, Mattson SN, Spadoni AD, Riley EP. Characterization of White Matter Microstructure in Fetal Alcohol Spectrum Disorders. Alcohol Clin Exp Res. 2009;33:1–8. doi: 10.1111/j.1530-0277.2008.00864.x. [DOI] [PMC free article] [PubMed] [Google Scholar]
- Gao W, Lin W, Chen Y, Gerig G, Smith JK, Jewells V, Gilmore JH. Temporal and spatial development of axonal maturation and myelination of white matter in the developing brain. AJNR Am J Neuroradiol. 2008;30:290–296. doi: 10.3174/ajnr.A1363. [DOI] [PMC free article] [PubMed] [Google Scholar]
- Greicius M. Resting-state functional connectivity in neuropsychiatric disorders. Curr Opin Neurol. 2008;21:424–430. doi: 10.1097/WCO.0b013e328306f2c5. [DOI] [PubMed] [Google Scholar]
- Gulani V, Webb AG, Duncan ID, Lauterbur PC. Apparent diffusion tensor measurements in myelin-deficient rat spinal cords. Magn Reson Med. 2001;45:191–195. doi: 10.1002/1522-2594(200102)45:2<191::aid-mrm1025>3.0.co;2-9. [DOI] [PubMed] [Google Scholar]
- Hasan KM, Kamali A, Kramer LA, Papnicolaou AC, Fletcher JM, Ewing-Cobbs L. Diffusion tensor quantification of the human midsagittal corpus callosum subdivisions across the lifespan. Brain Res. 2008;1227:52–67. doi: 10.1016/j.brainres.2008.06.030. [DOI] [PMC free article] [PubMed] [Google Scholar]
- Heiervang E, Behrens TE, Mackay CE, Robson MD, Johansen-Berg H. Between session reproducibility and between subject variability of diffusion MR and tractography measures. Neuroimage. 2006;33:867–877. doi: 10.1016/j.neuroimage.2006.07.037. [DOI] [PubMed] [Google Scholar]
- Hermoye L, Saint-Martin C, Cosnard G, Lee SK, Kim J, Nassogne MC, Menten R, Clapuyt P, Donohue PK, Hua K, Wakana S, Jiang H, van Zijl PC, Mori S. Pediatric diffusion tensor imaging: normal database and observation of the white matter maturation in early childhood. Neuroimage. 2006;29:493–504. doi: 10.1016/j.neuroimage.2005.08.017. [DOI] [PubMed] [Google Scholar]
- Hofer S, Merboldt KD, Tammer R, Frahm J. Rhesus monkey and human share a similar topography of the corpus callosum as revealed by diffusion tensor MRI in vivo. Cereb Cortex. 2007;18:1079–1084. doi: 10.1093/cercor/bhm141. [DOI] [PubMed] [Google Scholar]
- Huang H, Zhang J, Jiang H, Wakana S, Poetscher L, Miller MI, van Zijo PC, Hillis AE, Wytik R, Mori S. DTI tractography based parcellation of white matter: Application to the mid-sagittal morphology of corpus callosum. Neuroimage. 2005;26:195–205. doi: 10.1016/j.neuroimage.2005.01.019. [DOI] [PubMed] [Google Scholar]
- Hoyme HE, May PA, Kalberg WO, Kodituwakku P, Gossage JP, Trujillo PM, Buckley DG, Miller JH, Aragon AS, Khaole N, Viljoen DL, Jones KL, Robinson LK. A practical clinical approach to diagnosis of fetal alcohol spectrum disorders: clarification of the 1996 institute of medicine criteria. Pediatrics. 2005;115:39–47. doi: 10.1542/peds.2004-0259. [DOI] [PMC free article] [PubMed] [Google Scholar]
- Huang H, Zhang J, Wakana S, Zhang W, Ren T, Richards LJ, Yarowsky P, Donohue P, Graham E, van Zijl PC, Mori S. White and gray matter development in human fetal, newborn and pediatric brains. Neuroimage. 2006;33:27–38. doi: 10.1016/j.neuroimage.2006.06.009. [DOI] [PubMed] [Google Scholar]
- Huppi PS, Maier SE, Peled S, Zientara GP, Barnes PD, Jolesz FA, Volpe JJ. Microstructural development of human newborn cerebral white matter assessed in vivo by diffusion tensor magnetic resonance imaging. Pediatr Res. 1998;44:584–590. doi: 10.1203/00006450-199810000-00019. [DOI] [PubMed] [Google Scholar]
- Inder TE, Huppi PS. In vivo studies of brain development by magnetic resonance techniques. Ment Retard Dev Disabil Res Rev. 2000;6:59–67. doi: 10.1002/(SICI)1098-2779(2000)6:1<59::AID-MRDD8>3.0.CO;2-E. [DOI] [PubMed] [Google Scholar]
- Johnston JM, Vaishnavi SN, Smyth MD, Zhang D, He BJ, Zempel JM, Shimony JS, Snyder AZ, Raichle ME. Loss of resting interhemispheric functional connectivity after complete section of the corpus callosum. J Neurosci. 2008;28:6453–6458. doi: 10.1523/JNEUROSCI.0573-08.2008. [DOI] [PMC free article] [PubMed] [Google Scholar]
- Jones KL, Smith DW. Recognition of the fetal alcohol syndrome in early infancy. Lancet. 1973;2:999–1001. doi: 10.1016/s0140-6736(73)91092-1. [DOI] [PubMed] [Google Scholar]
- Kodituwakku PW. Defining the behavioral phenotype in children with fetal alcohol spectrum disorders: a review. Neurosci Biobehav Rev. 2007;31:192–201. doi: 10.1016/j.neubiorev.2006.06.020. [DOI] [PubMed] [Google Scholar]
- de Lacoste MC, Kirkpatrick JB, Ross ED. Topography of the human corpus callosum. J Neuropathol Exp Neurol. 1985;44:578–591. doi: 10.1097/00005072-198511000-00004. [DOI] [PubMed] [Google Scholar]
- Le Bihan D. Molecular diffusion, tissue microdynamics and microstructure. NMR Biomed. 1995;8:375–386. doi: 10.1002/nbm.1940080711. [DOI] [PubMed] [Google Scholar]
- Le Bihan D. Looking into the functional architecture of the brain with diffusion MRI. Nat Rev Neurosci. 2003;4:469–480. doi: 10.1038/nrn1119. [DOI] [PubMed] [Google Scholar]
- Lebel C, Rasmussen C, Wyper K, Walker L, Andrew G, Yager J, Beaulieu C. Brain diffusion abnormalities in children with fetal alcohol spectrum disorder. Alcoholism: Clinical and Experimental Research. 2008;23:1732–1740. doi: 10.1111/j.1530-0277.2008.00750.x. [DOI] [PubMed] [Google Scholar]
- Li L, Coles CD, Lynch ME, Hu X. Voxelwise and skeleton-based region of interest analysis of fetal alcohol syndrome and fetal alcohol spectrum disorders in young adults. Hum Brain Mapp. 2009 doi: 10.1002/hbm.20747. 101002/hbm20747. [DOI] [PMC free article] [PubMed] [Google Scholar]
- Liston C, Watts R, Tottenham N, Davidson MC, Niogi S, Ulug AM, et al. Frontostriatal microstructure modulates efficient recruitment of cognitive control. Cereb Cortex. 2006;16:553–560. doi: 10.1093/cercor/bhj003. [DOI] [PubMed] [Google Scholar]
- Ma X, Coles CD, Lynch ME, Laconte SM, Zurkiya O, Wang D, et al. Evaluation of corpus callosum anisotropy in young adults with fetal alcohol syndrome according to diffusion tensor imaging. Alcohol Clin Exp Res. 2005;29:1214–1222. doi: 10.1097/01.alc.0000171934.22755.6d. [DOI] [PubMed] [Google Scholar]
- Mabbott DJ, Noseworthy M, Bouffet E, Laughlin S, Rockel C. White matter growth as a mechanism of cognitive development in children. Neuroimage. 2006;33:936–946. doi: 10.1016/j.neuroimage.2006.07.024. [DOI] [PubMed] [Google Scholar]
- Matsunami K, Kawashima T, Ueki S, Fujita M, Konishi T. Topography of commissural fibers in the corpus callosum of the cat: a study using WGA-HRP method. Neurosci Res. 1994;20:137–148. doi: 10.1016/0168-0102(94)90031-0. [DOI] [PubMed] [Google Scholar]
- Mattson SN, Riley EP, Gramling L, Delis DC, Jones KL. Neuropsychological comparison of alcohol-exposed children with or without physical features of fetal alcohol syndrome. Neuropsychology. 1998;12:146–153. doi: 10.1037//0894-4105.12.1.146. [DOI] [PubMed] [Google Scholar]
- Mori S, Zhang J. Principles of diffusion tensor imaging and its applications to basic neuroscience research. Neuron. 2006;51:527–539. doi: 10.1016/j.neuron.2006.08.012. [DOI] [PubMed] [Google Scholar]
- Moseley ME, Cohen Y, Kucharczyk J, Mintorovitch J, Asgari HS, Wendland MF, Tsuruda J, Norman D. Diffusion-weighted MR imaging of anisotropic water diffusion in cat central nervous system. Radiology. 1990;176:439–445. doi: 10.1148/radiology.176.2.2367658. [DOI] [PubMed] [Google Scholar]
- Muetzel RL, Collins PF, Mueller BA, A MS, Lim KO, Luciana M. The development of corpus callosum microstructure and associations with bimanual task performance in healthy adolescents. Neuroimage. 2008;39:1918–1925. doi: 10.1016/j.neuroimage.2007.10.018. [DOI] [PMC free article] [PubMed] [Google Scholar]
- Neil J, Miller J, Mukherjee P, Huppi PS. Diffusion tensor imaging of normal and injured developing human brain - a technical review. NMR Biomed. 2002;15:543–552. doi: 10.1002/nbm.784. [DOI] [PubMed] [Google Scholar]
- Neil JJ, Shiran S, McKinstry R, Schefft G, Snyder A, Almli C, Akbudak E, Aronovitz J, Miller J, Lee B, Conturo T. Normal brain in human newborns: apparent diffusion coefficient and diffusion anisotropy measured by using diffusion tensor MR imaging. Radiology. 1998;209:57–66. doi: 10.1148/radiology.209.1.9769812. [DOI] [PubMed] [Google Scholar]
- Nomura Y, Sakuma H, Takeda K, Tagami T, Okuda Y, Nakagawa T. Diffusional anisotropy of the human brain assessed with diffusion-weighted MR: relation with normal brain development and aging. AJNR Am J Neuroradiol. 1994;15:231–238. [PMC free article] [PubMed] [Google Scholar]
- Olson EA, Collins PF, Hooper CJ, Muetzel R, Lim KO, Luciana M. White matter integrity predicts delay discounting behavior in 9- to 23-year-olds: a diffusion tensor imaging study. J Cogn Neurosci. 2008;21:1406–1421. doi: 10.1162/jocn.2009.21107. [DOI] [PMC free article] [PubMed] [Google Scholar]
- Pandya DN, Karol EA, Heilbronn D. The topographical distribution of interhemispheric projections in the corpus callosum of rhesus monkey. Brain Res. 1971;32:31–43. doi: 10.1016/0006-8993(71)90153-3. [DOI] [PubMed] [Google Scholar]
- Qiu D, Tan LH, Zhou K, Khong PL. Diffusion tensor imaging of normal white matter maturation from late childhood to young adulthood: voxel-wise evaluation of mean diffusivity, fractional anisotropy, radial and axial diffusivities, and correlation with reading development. Neuroimage. 2008;41:223–232. doi: 10.1016/j.neuroimage.2008.02.023. [DOI] [PubMed] [Google Scholar]
- Raichle ME, Snyder AZ. A default mode of brain function: a brief history of an evolving idea. Neuroimage. 2007;37:1083–1090. doi: 10.1016/j.neuroimage.2007.02.041. discussion 1097-1089. [DOI] [PubMed] [Google Scholar]
- Riley EP, Mattson SN, Sowell ER, Jernigan TL, Sobel DF, Jones KL. Abnormalities of the corpus callosum in children prenatally exposed to alcohol. Alcohol Clin Exp Res. 1995;19:1198–1202. doi: 10.1111/j.1530-0277.1995.tb01600.x. [DOI] [PubMed] [Google Scholar]
- Roebuck TM, Mattson SN, Riley EP. Interhemispheric transfer in children with heavy prenatal alcohol exposure. Alcohol Clin Exp Res. 2002;26:1863–1871. doi: 10.1097/01.ALC.0000042219.73648.46. [DOI] [PubMed] [Google Scholar]
- Salat DH, Tuch DS, Hevelone ND, Fischl B, Corkin S, Rosas HD, Dale AM. Age-related changes in prefrontal white matter measured by diffusion tensor imaging. Ann NY Acad Sci. 2005;1064:37–49. doi: 10.1196/annals.1340.009. [DOI] [PubMed] [Google Scholar]
- Sampson PD, Streissguth AP, Bookstein FL, Little RE, Clarren SK, Dehaene P, Hanson JW, Graham JM., Jr Incidence of fetal alcohol syndrome and prevalence of alcohol-related neurodevelopmental disorder. Teratology. 1997;56:317–326. doi: 10.1002/(SICI)1096-9926(199711)56:5<317::AID-TERA5>3.0.CO;2-U. [DOI] [PubMed] [Google Scholar]
- Schmithorst VJ, Wilke M, Dardzinski BJ, Holland SK. Correlation of white matter diffusivity and anisotropy with age during childhood and adolescence: a cross-sectional diffusion-tensor MR imaging study. Radiology. 2002;222:212–218. doi: 10.1148/radiol.2221010626. [DOI] [PMC free article] [PubMed] [Google Scholar]
- Schmithorst VJ, Wilke M, Dardzinski BJ, Holland SK. Cognitive functions correlate with white matter architecture in a normal pediatric population: a diffusion tensor MRI study. Hum Brain Mapp. 2005;26:139–147. doi: 10.1002/hbm.20149. [DOI] [PMC free article] [PubMed] [Google Scholar]
- Skudlarski P, Jagannathan K, Calhoun VD, Hampson M, Skudlarska BA, Pearlson G. Measuring brain connectivity: diffusion tensor imaging validates resting state temporal correlations. Neuroimage. 2008;43:554–561. doi: 10.1016/j.neuroimage.2008.07.063. [DOI] [PMC free article] [PubMed] [Google Scholar]
- Smith SM, Jenkinson M, Johansen-Berg H, Rueckert D, Nichols TE, Mackay CE, Watkins KE, Ciccarelli O, Cader MZ, Matthews PM, Behrens TE. Tract-based spatial statistics: voxelwise analysis of multi-subject diffusion data. Neuroimage. 2006;31:1487–1505. doi: 10.1016/j.neuroimage.2006.02.024. [DOI] [PubMed] [Google Scholar]
- Snook L, Paulson LA, Roy D, Phillips L, Beaulieu C. Diffusion tensor imaging of neurodevelopment in children and young adults. Neuroimage. 2005;26:1164–1173. doi: 10.1016/j.neuroimage.2005.03.016. [DOI] [PubMed] [Google Scholar]
- Sokol RJ, Delaney-Black V, Nordstrom B. Fetal alcohol spectrum disorder. JAMA. 2003;290:2996–2999. doi: 10.1001/jama.290.22.2996. [DOI] [PubMed] [Google Scholar]
- Sowell ER, Johnson A, Kan E, Lu LH, Van Horn JD, Toga AW, O'Connor MJ, Bookheimer SY. Mapping white matter integrity and neurobehavioral correlates in children with fetal alcohol spectrum disorders. J Neurosci. 2008a;28:1313–1319. doi: 10.1523/JNEUROSCI.5067-07.2008. [DOI] [PMC free article] [PubMed] [Google Scholar]
- Sowell ER, Mattson SN, Kan E, Thompson PM, Riley EP, Toga AW. Abnormal cortical thickness and brain-behavior correlation patterns in individuals with heavy prenatal alcohol exposure. Cereb Cortex. 2008b;18:136–144. doi: 10.1093/cercor/bhm039. [DOI] [PMC free article] [PubMed] [Google Scholar]
- Sowell ER, Mattson SN, Thompson PM, Jernigan TL, Riley EP, Toga AW. Mapping callosal morphology and cognitive correlates: Effects of heavy prenatal alcohol exposure. Neurology. 2001a;57:235–244. doi: 10.1212/wnl.57.2.235. [DOI] [PubMed] [Google Scholar]
- Sowell ER, Thompson PM, Mattson SN, Tessner KD, Jernigan TL, Riley EP, Toga AW. Voxel-based morphometric analyses of the brain in children and adolescents prenatally exposed to alcohol. Neuroreport. 2001b;12:515–523. doi: 10.1097/00001756-200103050-00018. [DOI] [PubMed] [Google Scholar]
- Sowell ER, Thompson PM, Mattson SN, Tessner KD, Jernigan TL, Riley EP, Toga AW. Regional brain shape abnormalities persist into adolescence after heavy prenatal alcohol exposure. Cereb Cortex. 2002;12:856–865. doi: 10.1093/cercor/12.8.856. [DOI] [PubMed] [Google Scholar]
- Sulik KK. Genesis of alcohol-induced craniofacial dysmorphism. Exp Biol Med (Maywood) 2005;230:366–375. doi: 10.1177/15353702-0323006-04. [DOI] [PubMed] [Google Scholar]
- Sundaram SK, Kumar A, Makki MI, Behen ME, Chugani HT, Chugani DC. Diffusion tensor imaging of frontal lobe in autism spectrum disorder. Cereb Cortex. 2008;18:2659–2665. doi: 10.1093/cercor/bhn031. [DOI] [PMC free article] [PubMed] [Google Scholar]
- Swayze VW, II, Johnson VP, Hanson JW, Piven J, Sato Y, Giedd JN, Mosnik D, Andreasen NC. Magnetic resonance imaging of brain anomalies in fetal alcohol syndrome. Pediatrics. 1997;99:232–240. doi: 10.1542/peds.99.2.232. [DOI] [PubMed] [Google Scholar]
- Thakkar KN, Polli FE, Joseph RM, Tuch DS, Hadjikhani N, Barton JJ, Manoach DS. Response monitoring, repetitive behaviour and anterior cingulate abnormalities in autism spectrum disorders (ASD) Brain. 2008;131(Pt 9):2464–2478. doi: 10.1093/brain/awn099. [DOI] [PMC free article] [PubMed] [Google Scholar]
- Uddin LQ, Kelly AM, Biswal BB, Margulies DS, Shehzad Z, Shaw D, Ghaffari M, Rotrosen J, Adler LA, Castellanos FX, Milham MP. Network homogeneity reveals decreased integrity of default-mode network in ADHD. J Neurosci Methods. 2008;169:249–254. doi: 10.1016/j.jneumeth.2007.11.031. [DOI] [PubMed] [Google Scholar]
- Wakana S, Caprihan A, Panzenboeck MM, Fallon JH, Perry M, Gollub RL, Hua K, Zhang J, Jiang H, Dubey P, Blitz A, van Zijl P, Mori S. Reproducibility of quantitative tractography methods applied to cerebral white matter. Neuroimage. 2007;36:630–644. doi: 10.1016/j.neuroimage.2007.02.049. [DOI] [PMC free article] [PubMed] [Google Scholar]
- Wechsler D. Wechsler Adult Intelligence Scale. Third. The Psychological Corporation; San Antonio, TX: 1997. [Google Scholar]
- Wechsler D. Wechsler Intelligence Scale for Children. Fourth. The Psychological Corporation; San Antonio, TX: 2003. [Google Scholar]
- Wilde EA, Chu Z, Bigler ED, Hunter JV, Fearing MA, Hanten G, Newsome MR, Scheibel RS, Li X, Levin HS. Diffusion tensor imaging in the corpus callosum in children after moderate to severe traumatic brain injury. J Neurotrauma. 2006;23:1412–1426. doi: 10.1089/neu.2006.23.1412. [DOI] [PubMed] [Google Scholar]
- Witelson SF. Hand and sex differences in the isthmus and genu of the human corpus callosum. A postmortem morphological study. Brain. 1989;112(Pt 3):799–835. doi: 10.1093/brain/112.3.799. [DOI] [PubMed] [Google Scholar]
- Wozniak JR, Krach L, Ward E, Mueller BA, Muetzel R, Schnoebelen S, et al. Neurocognitive and neuroimaging correlates of pediatric traumatic brain injury: a diffusion tensor imaging (DTI) study. Arch Clin Neuropsychol. 2007;22:555–568. doi: 10.1016/j.acn.2007.03.004. [DOI] [PMC free article] [PubMed] [Google Scholar]
- Wozniak JR, Lim KO. Advances in white matter imaging: a review of in vivo magnetic resonance methodologies and their applicability to the study of development and aging. Neurosci Biobehav Rev. 2006;30:762–774. doi: 10.1016/j.neubiorev.2006.06.003. [DOI] [PMC free article] [PubMed] [Google Scholar]
- Wozniak JR, Mueller BA, Chang P, Muetzel RL, Caros L, Lim KO. Diffusion tensor imaging in children with fetal alcohol spectrum disorders. Alcohol Clin Exp Res. 2006;30:1799–1806. doi: 10.1111/j.1530-0277.2006.00213.x. [DOI] [PMC free article] [PubMed] [Google Scholar]
- Wozniak JR, Mueller BA, Lim KO. Diffusion Tensor Imaging. In: Nelson CA, Luciana M, editors. Handbook of Developmental Cognitive Neuroscience. Second. MIT Press; Cambridge, MA: 2008. pp. 301–310. [Google Scholar]