Abstract
Interneurons coupled by both electrical gap-junctions (GJs) and chemical GABAergic synapses are major components of forebrain networks. However, their contributions to the generation of specific activity patterns, and their overall contributions to network function, remain poorly understood. Here we demonstrate, using computational methods, that the topological properties of interneuron networks can elicit a wide range of activity dynamics, and either prevent or permit local pattern formation. We systematically varied the topology of GJ and inhibitory chemical synapses within simulated networks, by changing connection types from local to random, and changing the total number of connections. As previously observed we found that randomly coupled GJs lead to globally synchronous activity. In contrast, we found that local GJ connectivity may govern the formation of highly spatially heterogeneous activity states. These states are inherently temporally unstable when the input is uniformly random, but can rapidly stabilize when the network detects correlations or asymmetries in the inputs. We show a correspondence between this feature of network activity and experimental observations of transient stabilization of striatal fast-spiking interneurons (FSIs), in electrophysiological recordings from rats performing a simple decision-making task. We suggest that local GJ coupling enables an active search-and-select function of striatal FSIs, which contributes to the overall role of cortical-basal ganglia circuits in decision-making.
1. Introduction
Networks of interneurons coupled by electrical gap-junctions (GJs) and inhibitory electrical synapses are vital features of many brain circuits. Interneurons in the neocortex (Bennett and Zukin 2004), visual cortex (Amitai et al 2002), and hippocampus (Buzsaki 2006) serve to coordinate and synchronize the activity of larger populations of neurons (Cardin et al 2009), and this synchronizing role is well described by computational models of interneuron networks (Hasegawa 2005, Koppel and Ermentrout 2004, Merriam et al 2005, Ostojic et al 2008, Pfeuty et al 2007). However, the activity of interneuron networks does not simply serve to set the pace of brain circuits. For example, recent studies have demonstrated unexpectedly asynchronous firing of GJ-coupled striatal fast-spiking interneurons (FSIs; Berke (2008)), and how such activity emerges from and is constrained by network connectivity is not well understood (Hjorth et al 2009).
We wish to extend the computational study of interneuron networks by systematically investigating the effects of network topology and GJ connection strength on the spatio-temporal activity patterns of interneuron networks. Differences in network and connection properties may allow interneuron networks to have distinct functions, and corresponding distinct activity patterns, in different brain regions. The first half of this paper is a general study on interneuron dynamics that covers a wide range of connection topologies and connection strengths. We introduce our reduced network model and the metrics we employ to quantify the observed patterns of network activity. We then use these metrics to study spatial network patterns and their temporal stability as a function of connectivity levels, connectivity strength and network macrostructure. The intent is for these studies to be applicable to any GJ-coupled networks of inhibitory neurons.
In the second half of this paper we use our computational analysis of interneuron networks to gain insight into observed firing patterns of striatal FSIs (Gage et al 2008). We show that subtle alterations in the input to the network can cause transitions from unstable to stable patterns, and we compare these observed transitions to results obtained in electrophysiological studies of striatum during action selection. In vivo these neurons receive direct inputs from the cortex (Ramanathan et al 2002), are coupled together by GJs on their dendrites (Kita et al 1990) and provide strong perisomatic GABAergic inputs to > 100 nearby striatal projection neurons (Koos and Tepper 1999). FSI-mediated inhibition appears to play an important role in the selection and suppression of actions (discussed in Berke (2008)), and a deficit in this cell population may contribute to Tourette Syndrome (Kalanithi et al 2005). Understanding the relationships between FSI anatomical connectivity, firing patterns and behavioral functions is therefore an important area of current research.
2. Materials and methods
2.1. Simulations
2.1.1. General network architecture
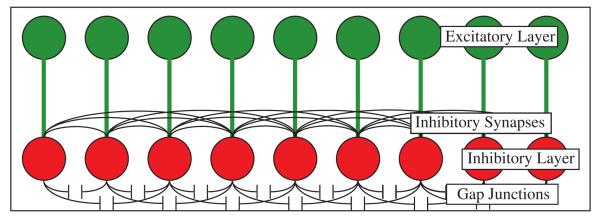
The interneuron network consists of 200 neurons arranged on a 1D lattice (figure 1). The network has periodic boundaries, forming a ring structure. The neurons were connected using the Small World paradigm (Watts and Strogatz 1998), where neurons are initially connected to all neighbors within a distance r; then connections are removed randomly and reconnected anywhere in the network with a probability of p. Thus, on average, every neuron has a 1 − p probability of connecting to its neighbors and a probability p of connecting to any other neurons in the network. Thus, for p = 0 we obtain solely local network connectivity; for p = 1 the connectivity is fully random.
Figure 1.
Network architecture. General network layout of the FSI interneuron layer (red) and coupled excitatory input layer (green). The interneuron layer is internally coupled via both inhibitory connections and GJ connections. The excitatory input layer has direct connections to corresponding neurons in the network.
To investigate the relative contributions of electrical and chemical networks, we modified connectivity parameters for the inhibitory and the GJ networks separately. For the synaptic inhibitory component, the wiring radius of inhibitory connections was set to (ri) = 5, 10, or 30 with a rewiring probability (pi) ranging from 0-1 in increments of 0.05. For the GJ component, radii started smaller, with the wiring radius of GJ connections (rg) = 3, 5, 10, or 30, and the rewiring probability (pg) again ranged from 0–1 in increments of 0.05.
Each simulation was run over 2 s and all measurements, unless otherwise stated, were the averaged values over ten independent simulations. Each independent simulation had distinct connectivity due to separate rewiring, random initial voltages, and driving patterns.
2.1.2. External network input
For homogenous driving (section 3.1), the interneuron network was stimulated by a layer of 200 uncoupled excitatory neurons, unidirectionally connected 1-to-1 with the interneurons. Each excitatory neuron fired as a random Poisson process with mean of 20 Hz. For non-homogeneous driving (section 3.2), in addition to the driving described above, a subpopulation of 20 contiguous excitatory neurons (id 90–110) were given additional properties. Either we increased the firing rate of this subset of neurons, by a factor ranging from 1 to 16, or we kept the firing rate identical to the rest of the population while increasing the correlation of firing times within this subset. The amount of correlation is quantified by a jitter (ms) which is the Gaussian deviation in firing times from the mean firing of neurons in this subset. A jitter of 0 will give perfectly correlated firing while a width near the average firing rate will return the same random firing pattern as all other neurons.
2.1.3. Inhibitory connections
To simulate the gross neuron dynamics of the inhibitory interneuron network, we used a leaky integrate-and-fire neuron model (Koch and Segev 1998):
| (1) |
Here, Vj is the membrane potential of the jth neuron, τm = 0.5 ms is the time constant; α is a leakage coefficient which is different for every cell, α ∈ [1, 1.3]; Iksyn is the synaptic current generated at the time of the spike, wsyn defines the chemical synapse coupling strength; Sjk is the synaptic connectivity (adjacency) matrix; I is a uniform external current which keeps the neurons readily excitable, I = 0.5; Rs is the neuron resistance Rs = 1.
The synaptic current is activated after the presynaptic neuron reaches a threshold Vthresh = 1 and fires an action potential. The presynaptic neuron is then returned to V = 0 and remains there for a refractory period tref = 5 ms. The synaptic current is of the form
| (2) |
where (t − tkspike) presynaptic neuron, τs = 3 ms is the slow time constant and τ f = 0.3 ms is the fast time constant. The variables τ s and τ f are chosen such that the IPSP lasts approximately 2 ms.
2.1.4. Electrical connections
The GJ connections differ from synaptic connections in several important ways. First, GJ connections are bidirectional: current can flow in either direction between two neurons. Second, they have no activating threshold: voltage-equilibrating ion flow occurs even at membrane voltages subthreshold for spiking. When spikes do occur, GJs can partly communicate this event in the form of a spikelet (Galaretta and Hestrin 2001, Gibson et al 2005), which is modeled via the addition of an excitatory term to the leaky-integrate-and-fire equation:
| (3) |
Here, ggap denotes the efficacy of GJ connections; Gjm is the gap-junction connectivity matrix, Vm is the potential of the mth presynaptic neuron and Vj is the potential of the postsynaptic neuron. The represents the spikelet and the σgap(Vm − Vj) is the voltage equilibrating, dissipative term. In all our simulations σgap = 1.
Inhibitory coupling constant wsyn = 2 for all simulations while the GJ coupling constants ggap ranged from 0–0.5, chosen to match the relative synaptic efficiencies observed in GJ interactions (Pfeuty et al 2007).
2.2. Definitions of spatial and temporal metrics
2.2.1. Spatially localized activation metric, Ω
To measure spatial pattern formation within the network, we computed the degree to which the firing of locally grouped subsets of neurons deviated from the mean population firing rate. Specifically, we calculate the average spike rate, R, for every neuron in the time window of bt = 400 ms. We then take a spatial sliding window of varying size bn ∈ [1, N] along the neuron number axis. R′ denotes the time-binned and neuron population-binned cell firing rates. We then compute the variance of these binned firing rates:
| (4) |
Thus, the variance will be large if there are localized neural groups that have significantly higher/lower mean spiking rates. Conversely, if the spiking frequency is uniform, the variance will tend to zero. Since we do not know the size of the localized groups a priori, the variance will depend on the spatial bin size bn, i.e. the maximum value of variance (σ2(bn)) will be reported for the bin size corresponding to the average size of activated groups. Thus, our measure of spatially localized activation is defined to be
| (5) |
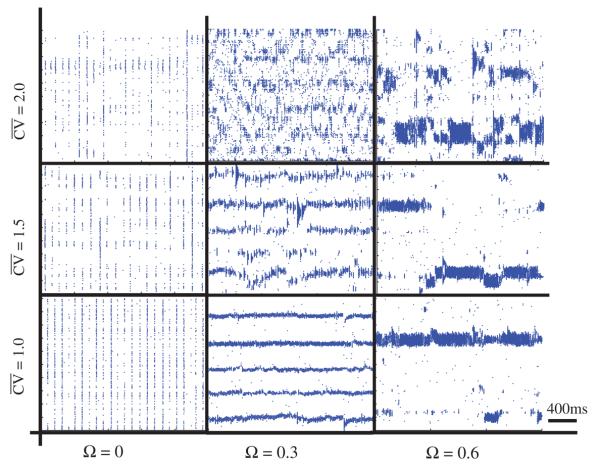
Figure 2 demonstrates different values of Ω for different activity patterns.
Figure 2.
Illustration of how the Ω and metrics can describe the key features of network activity. For each subplot, the neuron number is along the y-axis and timesteps along the x-axis with dots where the neuron has fired. In cases where locally distinct spatial patterns form, Ω has a correspondingly higher value. The subplots also show that more stable patterns are associated with lower values. In addition, all plots in the left column show examples of globally synchronous states (GSS), while the central and right columns demonstrate localized activation states (LAS).
2.2.2. Temporal Stability metric
To assess network stability we first measured the coefficient of variation of firing rates for each individual neuron over the time course of the simulation. This was defined as the standard deviation of inter-spike intervals (ISIs) divided by the mean ISI:
| (6) |
Here i is the index of each ISI and NISI is the total number of ISIs for a specific neuron. The overall stability measure is simply the mean for all neurons in the network. If the neurons show stable firing rates will be lower (figure 2).
2.3. Electrophysiological data acquisition and analysis
2.3.1. Recording striatal FSIs
Individual neurons were recorded extracellularly from the striatum of four rats implanted with tetrodes (four 12.5 μm nichrome wires twisted together) during performance of a simple choice task (Gage et al 2008). Thirty-nine striatal FSIs were identified using previously established waveform and activity criteria (Berke et al 2004, Berke 2008). Neural signals were sampled with high temporal precision (31250 samples s−1) and wide-band filtering (1–9000 Hz) to minimize distortions of waveform shape (Wiltschko et al 2008). During daily recording sessions, rats were placed in a dimly illuminated operant behavior box with an array of five nosepoke holes on one wall. The simple choice task required hungry rats to nosepoke an illuminated hole and hold there until receiving a ‘go’ signal (a white noise burst). During the hold period, an instruction cue was delivered to a speaker inside the operant box: a 250 ms tone of either high (4 kHz) or low (1 kHz) pitch. If the rats chose to move leftward after hearing the low tone, or rightward after the high tone, they were rewarded with a 45 mg sucrose pellet, which they collected from the wall opposite the nosepoke holes. The total hold time required to correctly complete the trial was pseudo-randomly selected to be between 900–1250 ms (uniform distribution), while the tone delay varied from 250–350 ms after initial nosepoke. If the rats failed to hold until the go signal, trials were aborted and a 10–15 s timeout period began (with houselights on). All recording sessions were made from rats that had already learned the task (mean: 74.4% correct trials).
2.3.2. Cumulative stability analysis of rat striatal FSIs and simulated data
To assess the stability of firing as rats were instructed which way to go, we examined spike times within 500 ms of the instruction cue. For each neuron, only trials with at least five spikes before and five spikes after event onset were included in the analysis. Altogether we included 828 trials in which rats were cued to make a rightward movement, with 22/39 neurons providing more than 10 stability shifts, and ½ of the neurons accounting for more than 95% of the recorded trials. For leftward movements we included 818 trials, with 22/39 neurons providing more than 10 stability shifts, and ½ of the neurons accounting for 94% of the recorded trials.
For each of these trials we calculated the pre- to post-cue shift in temporal stability, :
| (7) |
where i denotes the trial index. A positive thus represents an overall stabilization of the network after the cue, while a negative —its destabilization. We then calculated the mean stability shift over all trials for left- and right-movement choices:
| (8) |
To compute statistical significance of the observed mean shift in stability we created 1000 surrogate trials by randomly exchanging the sequences of pre- and post-cue spike trains for each trial. This process was repeated 1000 times, allowing us to obtain randomized distributions of the mean stability shift of the surrogate trials . We then computed the surrogate mean and standard deviation. The significance levels and scores were established assuming a Gaussian distribution around the surrogate mean. This analysis allowed us to determine whether the observed mean stability shifts are merely due to random fluctuations or represent a statistically significant event. For comparison, an identical calculation was performed on the spike trains obtained from the simulation—we repeatedly recorded activity of a single (and the same) neuron on different simulation runs.
3. Results
To better understand the dynamics of interneuron networks with both inhibitory synapses and GJ channels we used two separate connection topologies converging on the same neurons (figure 1). We observed that, contrary to many previous results that demonstrated the formation of predominantly synchronous states of activity (Hasegawa 2005, Koppel and Ermentrout 2004, Merriam et al 2005, Ostojic et al 2008, Pfeuty et al 2007), these interneuron networks are capable of a wide range of dynamical regimes and activity patterns. We show that by changing the topology of both the inhibitory and GJ connectivity, in addition to spatially uniform and synchronous activity, the network also exhibits highly nonuniform spatio-temporal patterns (figure 3). These states can be grossly divided into three groups.
Figure 3.
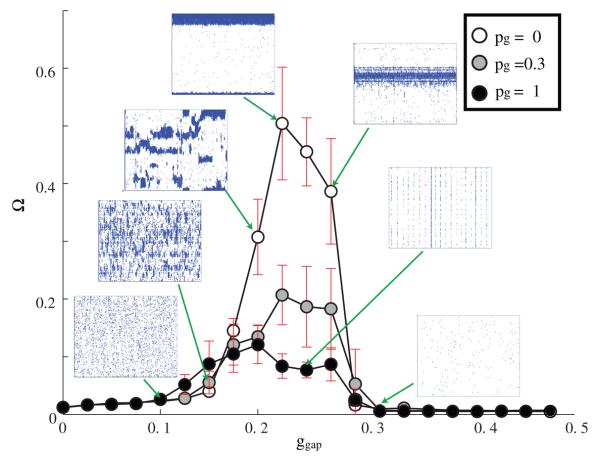
Qualitative changes in network activity arising from the topology of GJ connectivity. ggap versus Ω for ri = 30, pi = 1, rg = 5 and pg = 0 (white circles), 0.3 (gray circles), 1 (black circles). Selected raster plots depicts examples of network dynamics for different values of pg. As ggap increases so does Ω, to a peak value, before the network fails to sustain a pattern and Ω declines. The highest value of Ω occurs when pg = 0 (local connectivity) and declines as pg approaches 1 (random connectivity).
Localized activation state (LAS)
There are one or more well-defined groups exhibiting synchronous high frequency firing, while other regions of the network remain nearly silent (figure 3 center). These regions may be temporally stable throughout the simulation or change their position rapidly.
Random activation state (RAS)
The network exhibits low firing rates and random patterning predominantly driven by the input layer (figure 3, left).
Globally synchronous state (GSS)
A high fraction of the cells fires synchronously, with varying frequency dependent on overall network excitation (figure 3).
We investigated the emergence of these spatio-temporal patterns as a function of the underlying networks' topologies, connectivity strength and connectivity density. We assessed the spatial non-uniformity of network response and the temporal stability of network activity, using the Ω and metrics respectively (defined in section 2.2.1).
Finally, we compared the activity patterns obtained in our computational model with those observed experimentally, obtained from striatal FSI recordings of freely moving rats performing a decision task.
3.1. FSI network dynamics driven by homogenous input
3.1.1. Properties of electrical synapses and spatial pattern formation in the electrical-inhibitory network
In this section we investigated the spatial activation pattern of the network as a function of electrical connectivity parameters. We monitored changes in the SLA metric (Ω) as a function of connection topology (lines with colored circles) and electrical coupling strength ggap (x-axis; figure 3).
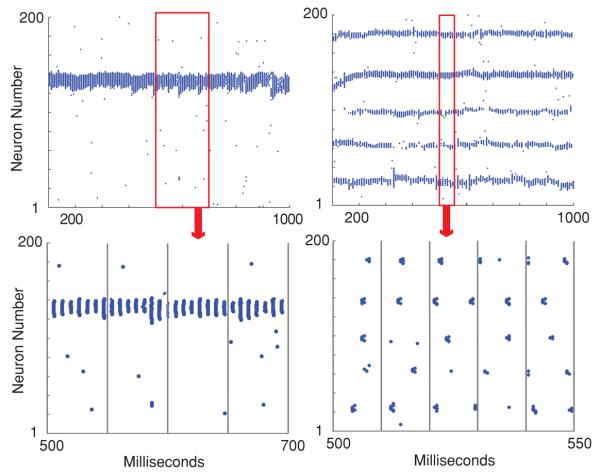
We observe that for fixed connectivity rg and for weak electrical coupling the network exhibits the RAS. This is due to the fact that the network activity is solely driven by the input layer that exhibits random homogenous activity patterns. When the GJ connectivity of the network increases to intermediate values of coupling strength, the network activity exhibits the highly non-uniform spatial pattern characteristic of the LAS. The observed pattern forms because of a GJ-mediated equilibration of the potentials, of locally connected interneurons. These local groups of neurons then become collectively active (quiescent) when a significant amount of excitation (inhibition) is input. Specifically, the local connectivity of GJs mediates the formation of discrete, high activity domains that inhibit other regions of the network. The firing frequency of neurons within these domains is well above the mean input frequency, while the rest of the network is relatively quiescent, firing significantly below the input frequency. Additionally, the neural activity is highly synchronized within each activated domains, with neurons firing within 3 ms of each other, but the multiple domains remain unsynchronized amongst each other (figure 4). The locations and sizes of the activated domains depend on the connectivity properties of both electrical and inhibitory networks. Moreover, the local, high activity pattern can be spatially stable (i.e. encompass the same group of cells) throughout the simulation, or change rapidly in time (see section 3.1.2 below).
Figure 4.
Inter-domain synchrony and lack of synchrony between domains. ri = 30, pi = 0 (right column), 1 (left column), rg = 5 and pg = 0. For the LAS regime the neurons within active regions are synchronous. However, if multiple regions are active (right column), the population subsets are not necessarily synchronous across the entire network.
For high values of electrical coupling, network activity becomes random and spatially uniform once again. In this case there is also significant reduction of the mean firing frequency, confirming previous findings in striatal FSI network simulations (Hjorth et al 2009). This is due to current shunting via GJs, which reduces the probability of neurons reaching action potential thresholds.
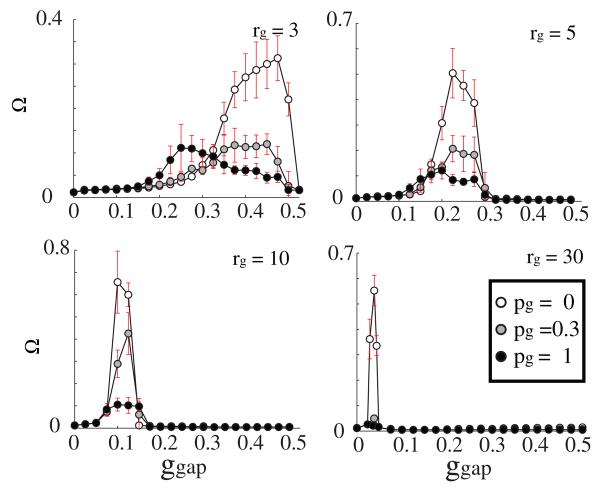
We then investigated the occurrence of the LAS, RAS and GSS as a function of electrical network connectivity (figures 5 and 6). We varied the GJ coupling, ggap ∈ [0, 0.5] and network topologies pg ∈ [0, 1] for three values of GJ connectivity, rg = 3, 5, 10, 30.
Figure 5.
Ω values obtained for various values of GJ coupling strength ggap, connection topology (pg = 0.0 (white), 0.3 (gray), 1 (black); rg = 3, 5, 10, 30), and connection distance rg. The chemical connectivity remains constant with parameters ri = 30, pi = 1). As rg increases, the corresponding ggap range that produces high values of Ω decreases and narrows. The top right panel is the same as in figure 3.
Figure 6.
Changes in spatial patterning (Ω) as a function of topology (pg) of the GJ network, for rg = 3, 5, 10 The connectivity of the inhibitory network is unchanged and is set to pi = 0, ri = 30. For rg = 3, 5, 10, ggap = 0.45, 0.21, 0.095 respectively, as chosen to give the highest Ω values (see figure 5).
The LAS patterning is clearly a function of locality of the electrical connections, with more local connections leading to the LAS state.
We observed that, as the total number of GJ connections (equal to 2rg per cell) increases, non-uniform patterning is obtained for lower values of electrical connection strengths, ggap, and theggaprange for LAS significantly narrows (figure 5). This is primarily due to the fact that the increased number of connections offsets the effects of coupling strength.
At the same time, as pg → 1, the network transitions to the synchronized state and the spatially resolved patterns no longer form (figure 6). The emergence of the GSS for more random connectivity patterns generally agrees with the in vitro experimental evidence observed in studies of interneurons in the cortex (Bartos et al 2007, Merriam et al 2005, Tamas et al 2000) as well as simulation studies (Hasegawa 2005, Hjorth et al 2006, Ostojic et al 2008, Pfeuty et al 2007).
This transition seems to take place for lower values of rewiring when the network connectivity is sparser. Additionally, as the network connectivity increases, there is an evident increase in the number of synchronously firing neurons per cycle (figure 6).
3.1.2. Topological effects of inhibitory connectivity on network patterning
We also more closely examined the properties of the formed patterns as a function of the structure of the inhibitory network connectivity. We varied the rewiring parameter and the connection density of the inhibitory synapses (i.e. pi ∈ [0, 1] and ri = 3, 5, 10, 30; figure 7).
Figure 7.
Spatial network patterning (Ω) as a function of inhibitory network topology (pi) for ri = 5, 10, 30. The connectivity of the GJ network is constant (pg = 0, rg = 5) and wsyn = 2. Local activation is observed for both local and random inhibitory coupling but its spatial characteristics change significantly.
We observed a dramatic change of the patterning as a function of the topology of the inhibitory network. The multiple activated regions observed for both local GJ and synaptic connectivities are replaced with a single active region when pi → 1. This is due to the fact that now activated regions generate global inhibition to the rest of the network, providing competition to each other (figure 7).
3.1.3. Excitatory chemical synapses do not support LAS formation
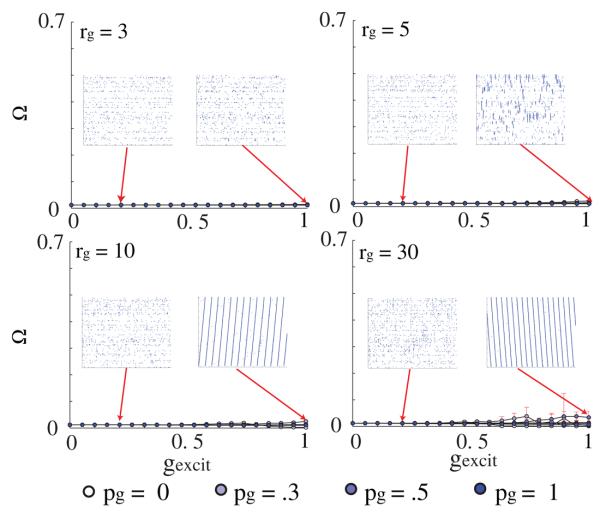
Finally, to confirm that the formation of the nonuniform spatio-temporal pattern is due to the sub-threshold equilibrating characteristic of electrical networks, and not primarily mediated by the chemical synapse excitatory-like interaction, we simulated networks with identical macrostructure properties and bidirectionality but with GJ connections replaced by excitatory connections (i.e. the sub-threshold equilibrating term was removed so that neural interactions were similar to these of the chemical synapses). We observed that, even for a significantly higher strength of connections (twofold), these networks were unable to form the LAS patterns (see insets figure 8). This demonstrates that, despite the excitatory network's ability to depolarize locally connected neurons, the lack of any equilibration properties cannot generate a LAS.
Figure 8.
Excitatory chemical connections cannot substitute for GJ in the formation of local active zones. Ω versus gexcit (excitatory connections instead of GJs) for varying the topology and connection strengths of the GJ network − ri = 30, pi = 1, rg = 3, 5, 10 and pg = 0, 0.3, 0.5, 1.0. There is no pattern formation, even as the connection strengths are increased to arbitrarily high values, twice the strength of the GJ networks.
3.1.4. Temporal pattern stability of LAS as a function of electrical and inhibitory network connectivity
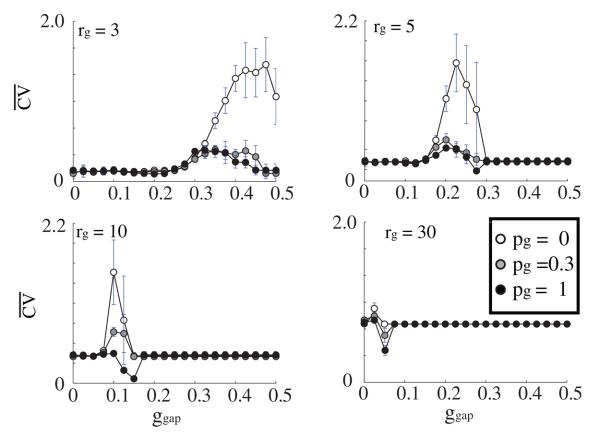
We also investigated the temporal stability of the observed patterns (figure 9). The overall shift in the CV peak(s) follows that of the Ω metric: as rg increases, the width of the peak narrows and occurs for smaller values of gg. For low values of ggap the network exhibits high stability (lower values of ). This is due to the fact that for the low coupling values the network activity is dominated by the input layer that provides random and uniform activation patterns (please refer to figure 3 for raster plot examples).
Figure 9.
Measurement of stability (Ω) versus GJ coupling strength (ggap) for varying topology (pg = 0.0 (white), = 0.3 (gray), = 1 (black)) and connectivity (rg = 3, 5, 10, 30) of the GJ network. The connectivity of the inhibitory network remains unchanged and is set to ri = 30 and pi = 1. For small rg the stability measure increases (the network becomes more unstable) as ggap increases. As the number of GJ connections increases the network is stable over a wide range of GJ coupling strengths.
For the higher values of GJ coupling, as the local regions of high activation form, the network shows decreased stability. This results from the rapid shifts of LAS regions which in turn are due to random local fluctuations of spike frequency and their temporal correlations. These fluctuations cause rapid formation of new LAS regions while shutting down the old ones.
However, especially for the high and random GJ connectivity regime, there is a narrow parameter range that for which stability of the patterning is increased. The reasons are twofold: (1) for the lower connectivity range, low values indicate decreased spatial fluctuations in the region of high activity (see the bottom-right panel of figure 2), and (2) for the high connectivity regime, this is due to high activation of the whole network that leads to high frequency GSS firing patterns.
3.2. Stabilization of network dynamics in response to non-homogenous inputs
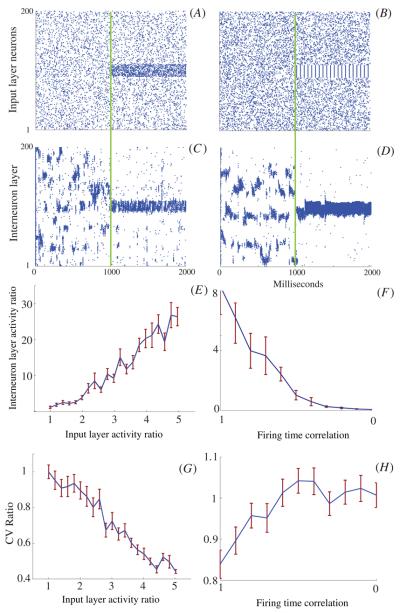
The results above were obtained with random, homogenous input to the interneuron network. We next investigated the consequences of perturbing this homogeneity, by increasing either input firing rate or input firing synchrony, in one region of the network (figure 10). The panels A and C show an example of increasing the input layer firing rate, in a specific region, without changing the firing rate elsewhere in the network and the resultant interneuron layer activity. The panels B and D depict changes in interneuron activity due to the introduction of correlations in the firing of the input layer.
Figure 10.
Response of the network to non-homogeneous input. The input layer is initially (0–1000 ms) driven with homogenous input leading to unstable spatio-temporal interneuron dynamics. Then the network is either driven with input with locally increased frequency (A), or correlated input of the same firing frequency (B). (C)and(D) both inputs elicit an increased frequency response in the corresponding interneurons, a decrease in firing rate in all other neurons, and an increase in the mean total stability of the network. (E) The input versus network response as a function of the ratio of activity for neurons (90–110) over the activity of all other neurons. An input layer activity ratio of 1 returns uniform a uniformly random firing rate across the network. (F) The interneuron network response versus the mean correlation of the firing pattern within the group of input neurons (1 means perfect correlation in firing and 0 correlation returns a random firing pattern). (G) The change in CV ratio, calculated from the actual CV divided by the CV obtained from uniform and uncorrelated input. The entire network stabilized as the interneuron layer activity ratio increased. (H) Similar to figure G, the network stabilized as the temporal correlations were higher. Each data point is the average of 50 independent simulations and the standard error is the error bar. For these simulations ri 30, pi = 1, rg = 5, pg = 0.
We found that relatively small manipulations of either parameter could produce a rapid stabilization of the FSI network activity and a significant amplification of the response (firing rate) of the corresponding network region (figures 10(E) and (F)) accompanied by the decrease in firing rate of other network regions. To quantify this effect we calculated the ratio of average firing frequency of neurons within the corresponding region and other parts of the network. In figure 10(E) a small 2–5 times increase in the noise level of specific input neurons can increase the ratio of FSI response 30-fold. In figure 10(F) a temporal correlation (synchrony) increase, with no increase in firing rate of the input neurons, can induce an eightfold FSI firing rate response. Both examples return expected ratio values of 1 when at nominal values (1 for noise ratio and 0 for the correlation, corresponding to random firing times). The ability of a GJ-coupled FSI network to detect and amplify small input asymmetries, in terms of a higher frequency or temporal coherence, and achieve a corresponding stable network activity pattern is a potentially highly useful feature. In the case of the striatum, it could be helpful in the selection and stabilization of planned courses of action. Decision-making involves the assessment of often equivocal or noisy evidence in order to make a commitment—a highly nonlinear, non-equivocal response (see section 4).
Additionally, a shift in temporal stability (CV) accompanied changes in both these parameters. Figure 10(G) demonstrates that as the selected region's activity ratio increases, so does the stability (CV decreases). For the temporal correlation shifts (figure 10(H)) we observed that this stabilization occurs at an even lower frequency response. This is not surprising however, as the nature of the temporally correlated input leads to a more temporally stable firing rate. In these figures we measured the CV ratio—or the relative CV shift as the actual CV value divided by the nominal CV value obtained from uniform and random input.
3.2.1. Stability analysis using experimental and simulated data from single neurons
To investigate whether such dynamics actually contribute to striatal function, we wished to compare our simulations to experimentally obtained spike trains from striatal neurons. We used a data set of FSIs recorded in rats performing a simple choice task (see section 2 and Gage et al (2008)). We compared periods of time immediately before and after presentation of an auditory cue that instructs animals which way to move (at a later time). Thus, before the cue onset, both left and right actions are equally probable for the animal, but following cue onset rats know which way they need to go to receive a reward. We assume here that the cue, and/or preparation of a specific movement, corresponds to preferential input of specific subsets of cortical inputs to striatal networks.
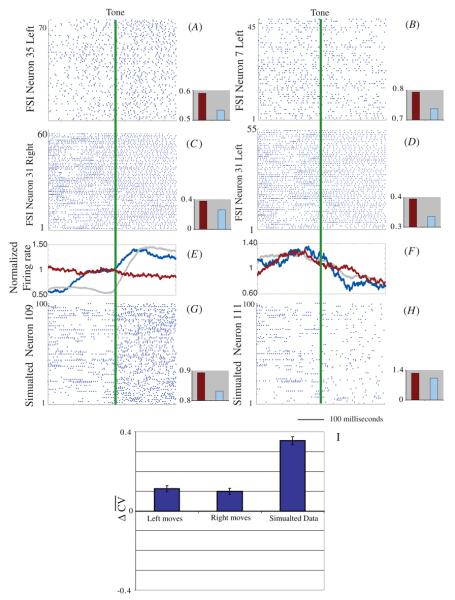
Employing the same measures used in the network simulations above would require the simultaneous recording of many FSIs, which is not technically feasible at the current time. Instead we exploited the fact that we had many behavioral trials for each individually recorded FSI and examined the stability of the firing pattern across repeated trials with the same instruction cue and movement. We also performed the same analysis for individual simulated FSIs over 100 independent trials. In both the model and experimental data, we observed a similar stabilization of firing pattern (figure 11). Additionally, both experimental and simulated neurons accompanied stabilization with a range of firing rate increases or decreases.
Figure 11.
Stabilization of both experimental and simulated data irrespective of firing rate changes. Experimental data from two neurons which showed an increase (A) and decrease (B) in firing rate. The epochs were calculated as 250 ms before and after the cue. Additionally, we show an experimental neuron which demonstrates a visually clear stabilization in firing pattern for left and right trials (C)and (D). Note that for these raster plots, lines represent the spikes of the same neuron on different trials, rather than spikes from different neurons on a single trial. For comparison we show 100 trials from two simulated neurons which show an increase (selected from inside the specific region) (G) and decrease (selected from outside the specific region) (H) in firing rate. The sliding binned (100 ms) firing rate is plotted in (E) and (F) for experimental (blue line neuron 35 and 7, red line neuron 31) and simulated (grey line) data. Inset bar plots show before (red) and after (light blue) the tone (or input shift for simulations) and are scaled to clearly see the differences. All individual examples show a stabilization (decrease in CV) for all samples, regardless of the increase or decrease in firing rate. (I) Cumulative stabilization of all simulated neurons, grouped for left and right trials, and simulated data . On average, the entire population shows a statistically significant mean stability shift.
We assessed the stabilization of firing for all experimentally recorded neurons (figure 11(I)) by comparing it to the surrogate generated trials (see section 2.3). Although striatal FSIs show diverse, behavior-linked, firing patterns in this and other tasks (Berke 2008, Gage et al 2008), we still found overall increased stabilization in the FSI population.
For all leftward movements 8/39 neurons showed a significant stabilization, 2/39 neurons showed a significant destabilization, 6/39 neurons showed a statistically insignificant stabilization, 7/39 neurons showed a statistically insignificant destabilization and 16/39 neurons had insufficient statistics. The mean shift for all 39 neurons was ΔCVleft = 0.11 and the surrogate trials gave (ΔCVsurrogate,left) = 0.00 ± .015, giving a Z score = 7.3 and P value = 2.87 × 10 −13. For all rightward movements 6/39 neurons showed a significant stabilization, 2/39 neurons showed a significant destabilization, 11/39 neurons showed a statistically insignificant stabilization, 5/39 neurons showed a statistically insignificant destabilization and 15/39 neurons had insufficient statistics. The mean shift for all 39 neurons was (ΔCVright) = 0.10 and the surrogate trials gave (ΔCVsurrogate,right) = 0.00 ± .016, giving a Z score = 6.3 and P value = 2.98 × 10⁻¹⁰.
We also analyzed the simulated data using an identical method. Like the experimental data, simulated neurons may show an increase in firing rate if that neuron is within the stimulated region (neurons 90–110, figure 10) or a decrease if it is located outside of it. Regardless of these firing rate changes however, the neurons exhibit an overall stabilization (left on right columns, figure 11). This effect is demonstrated in panels C and D of figure 10. For simulations, 1039/1352 trials showed a positive stability shift. The mean shift was (ΔCVsim = 0.36 and the surrogate trials gave (ΔCVsurrogate,sim) = 0.00 ± 0.020, giving a Z score = 18 and P value = 4.44 × 10⁻¹⁶.
4. Discussion
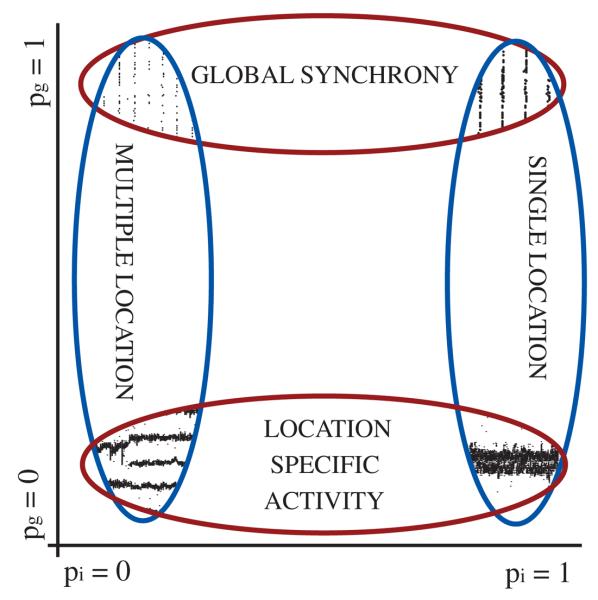
We found that neuronal networks in which nodes are coupled by both inhibitory chemical synapses and gap junctions can support a wide range of dynamic states that depend critically on network architecture. Although the random versus local nature of connectivity is a key parameter for both the chemical and electrical synapses, these two types of connection play non-interchangeable roles in setting network dynamics (schematically described in figure 12). In particular, relatively local connectivity of the electrical network mediates the formation of discrete domains of highly active synchronized neurons (LAS state). This type of pattern formation is in stark contrast to the globally synchronized state that is created by a more widely distributed GJ connectivity in interneuron networks (Koppel and Ermentrout 2004, Ostojic et al 2008, Pfeuty et al 2007).
Figure 12.
Summary of results on the interplay between topological conditions and LAS or GSS activity. Changes in the structure of inhibitory connectivity is plotted on the X-axis, while the structure of GJ connectivity is marked on Y-axis.
We further found that interneuron networks can show a sudden switch from unstable to stable temporal pattern formation, prompted by modest changes in the spatial distribution of input spiking rate or synchrony. We hypothesize that such dynamics may serve to support a ‘search-and-select’ function of interneuron networks that could be useful in various brain networks. Finally we examined the activity patterns of real striatal FSIs and found evidence for a comparable switch from unstable to stable firing as actions were selected. These results both support a role for striatal FSI dynamics in decision making, and begin to provide an functional explanation for anatomical observations of local GJ connectivity in the striatum (Fukuda 2009).
Interneuron network architectures vary between brain regions. For example, cortical and hippocampal CA1 GJ networks are much more uniformly distributed in structure without much variation along relevant spatial dimensions (Fukuda and Kosaka 2000, Fukuda et al 2006). In contrast, recent evidence shows that the striatal topology is highly irregular, with regions of higher and lower density and connectivity (Fukuda 2009). These differing network structures may result in distinctly different activity patterns of otherwise similar neurons. Our results support the idea that such structural differences result in distinct dynamic properties, that support distinct functional roles.
From a functional side, interneurons in the visual cortex (Amitai et al 2002, Fukuda et al 2006) and CA1 hippocampal formation (Bennett and Zukin 2004, Connors and Long 2004, Fukuda and Kosaka 2000) facilitate synchronization between their connected neurons by global population bursts (Connors and Long 2004, Pfeuty et al 2007, Tamas et al 2000). Conversely, while striatal FSIs have similar intrinsic properties to FSIs elsewhere, they behave quite idiosyncratically in their firing rate, synchronization (Berke 2008), and oscillatory entrainment (Berke 2009). Striatal FSIs may be participating in the formation of local microzones of enhanced activity, consistent with the idea that this structure processes information in a more parallel and fractured fashion than the integrated computational spaces established in hippocampus (Buzsaki 2006,Berke 2009).
These ideas will benefit from future studies on both the simulation and experimental sides. The conditions leading to spatial pattern formation should be further explored, for example by manipulating different parameters of inputs to simulated FSI networks and by incorporating features of projection neurons as well. Additional electrophysiological studies should reveal whether the stabilization of striatal FSIs occurs for a range of decision types, and by using a greater number of densely packed recording sites may be able to detect coordinated activity within very local microregions. New technologies are also opening the door to direct and selective manipulation of FSIs within networks (e.g. Cardin et al 2009) and thus will allow additional critical tests of the relationships between FSI network pattern formation and behavior.
Acknowledgments
This work was supported by the Tourette Syndrome Association (JB), the Whitehall Foundation (JB), the National Institute on Drug Abuse (R01 014318; JB), the NIH Molecular Biophysics Training grant (T32GM008270; TL) and NIH NIBIB grant EB008163 (MZ).
Abbreviations
- FSI
fast spiking interneuron
- GJ
gap junction
- GSS
globally synchronous state
- LAS
localized activation state
- RAS
random activation state
References
- Amitai Y, Gibson J, Beierlein M, Patrick S, Ho A, Connors B, Golomb D. The spatial dimensions of electrically coupled networks of interneurons in the neocortex. J. Neurosci. 2002;22:4142–52. doi: 10.1523/JNEUROSCI.22-10-04142.2002. [DOI] [PMC free article] [PubMed] [Google Scholar]
- Bartos M, Vida I, Jonas P. Synaptic mechanisms of synchronized gamma oscillations in inhibitory interneuron networks. Nat. Rev. Neurosci. 2007;8:45–56. doi: 10.1038/nrn2044. [DOI] [PubMed] [Google Scholar]
- Bennett M, Zukin R. Electrical coupling and neuronal synchronization in the mammalian brian. Neuron. 2004;41:495–511. doi: 10.1016/s0896-6273(04)00043-1. [DOI] [PubMed] [Google Scholar]
- Berke JD. Uncoordinated firing rate changes of striatal fast-spiking interneurons during behavioral task performance. J. Neurosci. 2008;28:10075–80. doi: 10.1523/JNEUROSCI.2192-08.2008. [DOI] [PMC free article] [PubMed] [Google Scholar]
- Berke JD. Fast oscillations in cortical-striatal networks switch frequency following rewarding events and stimulant drugs. Eur. J. Neurosci. 2009;30:848–59. doi: 10.1111/j.1460-9568.2009.06843.x. [DOI] [PMC free article] [PubMed] [Google Scholar]
- Berke JD, Okatan M, Skurski JA, Eichenbaum HB. Oscillatory entrainment of striatal neurons in freely-moving rats. Neuron. 2004;43:883–96. doi: 10.1016/j.neuron.2004.08.035. [DOI] [PubMed] [Google Scholar]
- Buzsaki G. Rhythms of the Brain. Oxford University Press; New York: 2006. [Google Scholar]
- Cardin JA, Carlén M, Meletis K, Knoblich U, Zhang F, Deisseroth K, Tsai LH, Moore CI. Driving fast-spiking cells induces gamma rhythm and controls sensory responses. Nature. 2009;459:663–7. doi: 10.1038/nature08002. [DOI] [PMC free article] [PubMed] [Google Scholar]
- Connors B, Long M. Electrical synapses in the mammalian brain. Ann. Rev. Neurosci. 2004;27:393–418. doi: 10.1146/annurev.neuro.26.041002.131128. [DOI] [PubMed] [Google Scholar]
- Fukuda T. Network architecture of gap junction-coupled neuronal linkage in the striatum. J. Neurosci. 2009;29:1235–43. doi: 10.1523/JNEUROSCI.4418-08.2009. [DOI] [PMC free article] [PubMed] [Google Scholar]
- Fukuda T, Kosaka T. Gap junctions linking the dendritic network of GABAergic interneurons in the hippocampus. J. Neurosci. 2000;20:1519–28. doi: 10.1523/JNEUROSCI.20-04-01519.2000. [DOI] [PMC free article] [PubMed] [Google Scholar]
- Fukuda T, Kosaka T, Singer W, Galuske R. Gap junctions among dendrites of cortical GABAergic neurons establish a dense and widespread intercolumnar network. J. Neurosci. 2006;26:3434–43. doi: 10.1523/JNEUROSCI.4076-05.2006. [DOI] [PMC free article] [PubMed] [Google Scholar]
- Gage GJ, Churchill MJ, Berke JD. Selective involvement of striatal fast spiking interneurons during the choice between two learned actions. Soc. Neurosci. Abstr. 2008;34:578–15. [Google Scholar]
- Galaretta M, Hestrin S. Electrical synapses between GABA-releasing interneurons. Nat. Rev. Neurosci. 2001;2:425–33. doi: 10.1038/35077566. [DOI] [PubMed] [Google Scholar]
- Gibson J, Beierlein M, Connors B. Functional properties of electrical synapses between inhibitory interneurons of neocortical layer 4. J. Neurophys. 2005;93:467–80. doi: 10.1152/jn.00520.2004. [DOI] [PubMed] [Google Scholar]
- Hasegawa H. Synchronization in small-world network of spiking neurons: diffusive versus sigmoid couplings. Phys. Rev. 2005;E 72:056139. doi: 10.1103/PhysRevE.72.056139. [DOI] [PubMed] [Google Scholar]
- Hjorth J, Blackwell K, Kotaleski J. Gap Junctions between striatal fast-spiking interneurons regulate spiking activity and synchronization as a function of cortical activity. J. Neurosci. 2009;29:5276–86. doi: 10.1523/JNEUROSCI.6031-08.2009. [DOI] [PMC free article] [PubMed] [Google Scholar]
- Hjorth J, Elias A, Kotaleski J. The significance of gap junction location in striatal fast spiking interneurons. Neurocomputing. 2006;70:1887–91. [Google Scholar]
- Kalanithi P, Zheng W, Kataoka Y, DiFiglia M, Grantz H, Saper C, Schwartz M, Leckman J, Vaccarino F. Altered parvalbumin-positive neuron distribution in basal ganglia of individuals with Tourette syndrome. PNAS. 2005;102:13307–12. doi: 10.1073/pnas.0502624102. [DOI] [PMC free article] [PubMed] [Google Scholar]
- Kita H, Kosaka T, Heizmann CW. Parvalbuminimmunoreactive neurons in the rat neostriatum: a light and electron microscopic study. Brain Res. 1990;536:1–15. doi: 10.1016/0006-8993(90)90002-s. [DOI] [PubMed] [Google Scholar]
- Koch C, Segev I. Methods in Neuronal Modeling. 2nd edn MIT Press; Cambridge: 1998. From Ions to Networks. [Google Scholar]
- Koos T, Tepper J. Inhibitory control of neostriatal projection neurons by GABAergic interneurons. Nat. Neurosci. 1999;2:467–72. doi: 10.1038/8138. [DOI] [PubMed] [Google Scholar]
- Koppel N, Ermentrout B. Chemical and electrical synapses perform complementary roles in the synchronization of interneuronal networks. PNAS. 2004;101:15482–7. doi: 10.1073/pnas.0406343101. [DOI] [PMC free article] [PubMed] [Google Scholar]
- Merriam E, Netoff T, Banks M. Bistable network behavior of layer I interneurons in the auditory cortex. J. Neurosci. 2005;25:6175–86. doi: 10.1523/JNEUROSCI.0512-05.2005. [DOI] [PMC free article] [PubMed] [Google Scholar]
- Ostojic S, Brunel N, Hakim V. Synchronization properties of networks of electrically coupled neurons in the presence of noise and heterogeneities. J. Comput. Neurosci. 2008;26:369–92. doi: 10.1007/s10827-008-0117-3. [DOI] [PubMed] [Google Scholar]
- Pfeuty B, Golomb D, Mato G, Hansel D. Inhibition potentiates the synchronizing action of electrical synapses. Front. Comput. Neurosci. 2007;1:1–8. doi: 10.3389/neuro.10.008.2007. [DOI] [PMC free article] [PubMed] [Google Scholar]
- Ramanathan S, Hanley JJ, Deniau JM, Bolam JP. Synaptic convergence of motor and somatosensory cortical afferents onto GABAergic interneurons in the rat striatum. J. Neurosci. 2002;22:8158–69. doi: 10.1523/JNEUROSCI.22-18-08158.2002. [DOI] [PMC free article] [PubMed] [Google Scholar]
- Tamas G, Buhl E, Lorincz A, Somogyi P. Proximally targeted GABAergic synapses and gap junctions synchronize cortical interneurons. Nat. Neurosci. 2000;3:366–71. doi: 10.1038/73936. [DOI] [PubMed] [Google Scholar]
- Watts D, Strogatz S. Collective dynamics of ‘small-world’ networks. Nature. 1998;393:440–2. doi: 10.1038/30918. [DOI] [PubMed] [Google Scholar]
- Wiltschko A, Gage G, Berke J. Wavelet filtering before spike detection preserves waveform shape and enhances single-unit discrimination. J. Neurosci. Methods. 2008;173:34–40. doi: 10.1016/j.jneumeth.2008.05.016. [DOI] [PMC free article] [PubMed] [Google Scholar]


