

Abstract
Characterization of interactions with phospholipids is an integral part of the in vitro profiling of drug candidates because of the roles the interactions play in tissue accumulation and passive diffusion. Currently used test systems may inadequately emulate the bilayer core solvation properties (immobilized artificial membranes - IAM), suffer from potentially slow transport of some chemicals (liposomes in free or immobilized forms), and require a tedious separation (if used for free liposomes). Here we introduce a well-defined system overcoming these drawbacks: nonporous octadecylsilica particles coated with a self-assembled phospholipid monolayer. The coating mimics the structure of the headgroup region, as well as the thickness and properties of the hydrocarbon core more closely than IAM. The monolayer has a similar transition temperature pattern as the corresponding bilayer. The particles can be separated by filtration or a mild centrifugation. The partitioning equilibria of 81 tested chemicals were dissected into the headgroup and core contributions, the latter using the alkane/water partition coefficients. The deconvolution allowed a successful prediction of the bilayer/water partition coefficients with the standard deviation of 0.26 log units. The plate-friendly assay is suitable for high-throughput profiling of drug candidates without sacrificing the quality of analysis or details of the drug-phospholipid interactions.
Keywords: phospholipid monolayer, phospholipid bilayer, octadecyl-silica microspheres, liposomes, in vitro profiling of drug candidates
INTRODUCTION
Interactions of drugs and other chemicals with phospholipid bilayers belong to the main determinants of their distribution in organisms. Several pharmacokinetic characteristics, e.g. passive transport rates,1 the tissue/blood partition coefficients,2 and the volumes of distribution,3 depend on the binding affinities of drugs to phospholipids. An assessment of phospholipid binding is an integral part of physicochemical profiling of drug candidates. In vitro, model phospholipid systems are used for monitoring drug-phospholipid interactions instead of biological membranes, with the aims to avoid complications caused by proteins and other membrane components, and improve reproducibility thanks to well-defined compositions. The model systems include free and gel-trapped liposomes, supported bilayers, and immobilized monolayers.
Liposomes
Liposomes are approximately spherical, pliable particles consisting of the aqueous center phase surrounded by one or more phospholipid bilayers separated by aqueous phases. The bilayers have similar structures as those in biological membranes. In membrane studies, the unilamellar vesicles are mostly used because of better-defined and simpler structures. Limitations like a complicated kinetics with difficult-to-predict duration of transport for some compounds,1 tedious separation,2,3 laborious spectroscopic data analysis due to the light scatter if the separation step is omitted,4-6 or stability of some preparations7 make liposomes less suitable for a high-throughput screening. Embedding of liposomes in gel beads8 alleviates the problem of liposome separation but introduces the risk of the matrix effects. Liposomes were non-covalently attached to a sensor chip and the interaction with drugs was analyzed using the surface plasmon resonance technology that reflects the changes in liposome mass caused by drug binding. This technique also provides the kinetics of association and dissociation with the bilayer.9 The use of pH-metric monitoring10,11 directly in liposome suspensions, while providing comparable results to methods with liposome separation, is limited to ionized compounds. A drawback common to free and immobilized liposomes is the long time needed to achieve the equilibrium for amphiphilic compounds: the flip-flop between the two interfaces of the bilayer can significantly slow down the partitioning process.1 Transport is also slow for compounds with extreme lipophilicities;1 however, the errors caused by a premature experiment termination are less significant due to weak interactions of hydrophilic compounds with phospholipids and to low aqueous solubilities of lipophilic compounds.
Supported bilayer systems
To alleviate the stability and separation problems of liposomes, supported phospholipid systems have been developed. The most commonly used solid supports are porous silica12,13 (Transil beads14), mica,15 glass16,17 (supported spherical vesicles18), quartz,19 organosulfate and organophosphate modified surfaces,20 polydimethylacrylamide hydrogel (Lipobeads),21 agar,22 metal (stainless steel,23 silver,24 platinum25) and metal-coated (gold,26 platinum25) or polymer-coated27 glass plates. The attachment of phospholipids is generally based on either chemisorption on the contact monolayer16,26,28 or a simple adhesion of the bilayer due to preferred planar conformation of the bilayer formed by certain phospholipid types.15 Supported bilayers are easy to separate from the drug solution. However, one of the main drawbacks still persists: they contain two headgroup regions, which can significantly prolong the equilibration time of amphiphilic molecules.
Supported monolayer systems
Elimination of the opposite headgroup region leads to a faster achievement of the equilibrium due to the removal of the slowest step, the flip-flop of amphiphilic molecules between individual bilayer leaflets. The price to pay for shorter experiments is a more complicated data processing because an estimate of the bilayer partitioning remains to be the ultimate goal of the monolayer studies. We will focus on the monolayers on solid supports, as they can be easily adapted for high-throughput experiments and, therefore, are more relevant to pre-clinical drug candidate screening.
Adsorbed monolayers
A multi-step immersion technique has been used to create layers of dimyristoylphosphatidylcholine (DMPC) on the surface of silica plates with covalently attached octadecyl chains.29 The uneven coverage of the hydrophobic surface and formation of multilamellar islands make this technique unsuitable for exact bilayer partitioning studies where a well-defined system is needed. The Langmuir-Blodgett technique30 produced a phospholipid monolayer on the surface of gold-coated plates with covalently attached octadecyl chains.31,32 The obtained monolayer was uniform and stable in both dry and re-hydrated forms. Alkylated glass plates were used to obtain a phospholipid monolayer by vesicle fusion.33 The comparatively small volume of phospholipids that are attached to planar supports may be insufficient for a measurable partitioning of less lipophilic compounds.
Covalently-bound monolayers
Phospholipids or their derivatives that are covalently immobilized to the surfaces of porous silica spheres (immobilized artificial membranes - IAM)34 were developed as column materials for high pressure liquid chromatography. The retention factors were used as descriptors for prediction of the trans-bilayer transport of chemicals.35-38 The liposome and IAM binding were correlated for some compounds39 and not correlated for other compounds.40 A systematically higher partitioning to IAMs than to liposomes was measured for several other series of compounds.8,41 In the molecular dynamics simulations,42 no structural differences were observed between the headgroup regions of phosphatidylcholine (PC) IAMs and the fluid bilayer. The 31P-NMR studies,43 however, indicated that the surface density of IAM headgroups is significantly lower than in fluid membranes. The decrease is ∼30% for the ether-linked PC and ∼40% for ester-linked PC.44 As a consequence, the partition coefficients estimated in ether- and ester-linked PC-IAMs were approximately 7 and 20 times higher, respectively, than those obtained in DMPC liposomes.44 The partitioning of ionized molecules seems to be affected by insufficient shielding of charges on the support material.45 The hydrocarbon core of IAMs differs from the bilayer core in two attributes: smaller thickness39 and lower rotational freedom of the fatty acyl chains.42 Moreover, the phospholipids in IAMs are immobilized to the rough surface of porous silica beads that may exhibit sharp edges, especially in the pores.46 At these spots, disturbances in the continuous interface that are not seen in the averaging NMR experiments may exist. The diffusion of chemicals in the pores may complicate the measurements.
Monolayers on nonporous alkylated microspheres
This communication describes a monolayer system that overcomes most of the aforementioned problems. The system consists of uniform nonporous octadecylated silica (ODS) particles with the diameter 1.5 μm that are coated with phospholipids. The coating is based on a spontaneous self-assembly of phospholipid molecules in the aqueous environment that is expected to lead to formation of a monolayer with a comparable packing density as seen in liposomes, as demonstrated for planar surfaces.31 The absence of the second interface eliminates the possibility of the time-consuming flip-flop process and leads to a significantly faster partitioning and simpler kinetics as compared to free or immobilized liposomes. The smooth surface of the non-porous particles is a prerequisite for formation of a defect-free monolayer. The hydrocarbon core, formed by phospholipid acyls and the octadecyl chains attached to the microspheres, is expected to be more similar to the bilayer core than the IAM core in thickness and the solvation properties. The used ODS-particles provide significantly larger surface area than planar systems. Easy separation of the particles from the medium is a prerequisite for a plate-friendly assay that is suitable for a routine testing with higher throughput than using liposomes or IAMs.
A comparison on purely geometrical basis shows that the bilayer partition coefficients can maximally achieve the doubled value of the monolayer partition coefficients, for compounds that bind predominantly in the headgroup region(s). If a greater precision of predicted bilayer data is needed, a deconvolution of the monolayer data into the headgroup and core contribution needs to be performed. A possible approach is described in this study.
MATERIALS AND METHODS
Chemicals and Materials
The ODS-particles with the diameter 1.5 μm were purchased from Micra Scientific (Darien, IL). DMPC was obtained from Avanti Polar Lipids (Alabaster, AL). Boric acid, sodium borate, and sodium chloride were purchased from VWR (Minneapolis, MN), and hexadecane from Sigma-Aldrich (St. Louis, MO). The chemicals, for which the partitioning to the monolayers and bilayers was measured, were obtained as follows. Polychlorinated biphenyls were purchased from VWR (Milford, MA). Inhibitors of matrix metalloproteinases (MMPIs) 1-3, 7-10, 14, and 15 (Table 2 below) were synthesized in-house by indium-mediated allylation of hydrazones.47 Compounds MMPI 4-6 and 11-13 (Table 2 below) were synthesized in-house as previously described.48 All other compounds were purchased from Sigma-Aldrich (St. Louis, MO).
Adsorbed monolayer preparation
The DMPC monolayer was deposited on the hydrophobic surface of the ODS-particles during their immersion in a sonicated suspension of DMPC vesicles. The suspension of DMPC vesicles was prepared by hydrating the powder DMPC in borate buffer49 (pH = 7.4) for 48 hours. The ODS-particles (500 mg) were mixed with DMPC vesicles (1 mg/mL of DMPC, 50 mL) in 125-mL conical flasks and sonicated in a water bath sonicator (150HT; VWR, Minneapolis, MN) at 40 °C for 8 hrs with vortexing every 30 minutes.
A slight upward shift in the transition temperature of phospholipids upon their adsorption to the surface of particles was expected due to the increase of the curvature diameter.50 The working temperature was set well above the transition temperature of DMPC vesicles51 (24°C) to ensure the fluid state even for the fraction of phospholipids adsorbed to the ODS- particles.
After sonication, the DMPC-coated ODS-particles were separated from the remaining DMPC vesicles by centrifugation at 2000 rpm (720×g, Allegra 21; Beckman Coulter, Fullerton, CA) for 2 minutes. These centrifugation conditions were used in all particle separations. To remove the traces of DMPC aggregates, the coated DMPC-ODS particles were washed twice with borate buffer (10 mL, pH = 7.4, 40 °C). After washing, the particles were distributed into the test tubes in the amounts that were used for partitioning measurements and kept shaking (Multi-tube vortexer, VWR, Minneapolis, MN) until they were used.
Adsorbed monolayer characterization
Several direct and indirect methods were used to determine the surface coverage, lamellarity, ordering of phospholipid molecules, and stability of particles and phospholipids under the experimental coating conditions.
Phosphate assay
The amount of DMPC attached to the ODS-particles as well as the residual DMPC amount in the solution after sonication were determined using the Anderson’s modification of the Bartlett’s phosphate assay.42 To analyze the adsorbed DMPC, the particles (about 20 mg) were separated from the buffer by centrifugation and DMPC was washed off the particles using mixture chloroform:methanol (1:1, 500 μL). The washed particles were separated by centrifugation and the phospholipid solution (200 μL) was used for analysis. To determine the non-absorbed DMPC amount, 50 and 100 μL samples of the DMPC solution after sonication with the particles were analyzed. The solvents in the DMPC solutions in the chloroform:methanol mixture and in the buffer were evaporated at 37°C under a gentle nitrogen stream and the solids were subjected to analysis.
Carbon analysis was carried out in a Skalar Primacs TOC Analyzer with a detection limit of 0.001 g of carbon and reproducibility ± 1.5%. The method involved combustion of the sample at 1000°C and analysis of the resulting CO2 in an oxygen stream by an infrared detector.
Differential scanning calorimetry (DSC) was used to determine transition temperatures in the immobilized monolayers (VP-DSC Microcalorimeter; MicroCal, LLC, Northampton, MA). To avoid long equilibration times at low temperatures and the risk of non-reproducible signals in the heating scans,50 the analysis started at the highest temperature, with the homogeneous fluid phase, and was done in the descendent temperature mode. The DMPC-ODS particles were equilibrated for 1 hr at 50°C and cooled down to 5°C with scanning rate 15°C/hr, using medium feedback, and filtering period 8. Phospholipids adsorbed to the particles as well as pure DMPC vesicles that went through the same sonication treatment as the phospholipid/particles mixture were analyzed.
NMR analysis
Solid state 31P-NMR was used to determine the number of phospholipid layers on the surface of particles.52 PrCl3 served as a chemical shift reagent. The DMPC concentration in the samples was 8.5 mM, and the total concentration of the shift reagent was 2 mM. The data were collected on a homebuilt 360 MHz spectrometer (Libra, Techmag, Houston, TX) with a DOTY 4mm magic angle spinning (MAS) probe (DOTY Scientific, Columbia, SC). A spinning rate of 6 KHz was used to average out the chemical shift anisotropy. Approximately 5000 scans were taken for the phospholipid coated particles, and 20,000 scans were taken for the coated particles with the shift reagent.
Scanning electron microscopy (SEM) helped assess the influence of the processing on the surface integrity of the DMPC-ODS-particles. The suspensions of coated and uncoated particles before and after sonication were applied to a glass support and the buffer was left to evaporate on air. The particles were coated with gold-palladium and examined under the microscope (JOEL SEM, Peabody, MA) at 3.0 kV and 11000× magnification.
Atomic force microscopy (AFM) provided images of particle surfaces after the coating. The suspension of particles was deposited on aluminum foil; the buffer was left to dry out overnight; and the surface of particles was scanned using AFM (Nanoscope IIIa; Digital Instruments, Santa Barbara, CA) in the contact mode, with a J scanner (125 m scan region).
Thin-layer chromatography (TLC) was used to monitor phospholipid integrity during the coating process. Silica plates (Whatman) were activated by running the chloroform:methanol (65:25) mixture and drying at 120°C for 25 min. The standard, buffer, and four samples (10 μL each) were applied to the activated plate that was run in the chloroform:methanol:water (65:25:4) mixture.53 The solution of DMPC in chloroform (8 mg/mL) was used as a standard. The samples were prepared by pre-concentrating the residual solution of DMPC in a buffer to 8 mg/mL by partial evaporation of the buffer at 37°C under a gentle stream of nitrogen. Three samples were taken from the solution of DMPC vesicles left after the monolayer adsorption. The fourth sample was taken from the control solution of DMPC vesicles that was sonicated without particles along with samples containing particles. The TLC plates were briefly dried, and phospholipids and their possible breakdown products were detected using Zinzade’s reagent consisting of sodium molybdate dehydrate (6.85 g), hydrazine sulfate (40 mg), sulfuric acid (250 mL), and distilled water (600 mL).53 After spraying with the reagent, the TLC plates were placed on a hot plate (200°C) for 24 hrs.
Mass spectrometry was used to further check the integrity of phospholipid molecules after sonication. The analyses were performed using an Esquire 3000 Plus Mass Spectrometer (Bruker Daltonics, Billerica, MA), operating in the positive ion electrospray ionization mode,54 with the following settings: the nebulizer 5.0 psi, dry gas flow 5.0 L/min, dry temperature 320° C, scanned m/z 50-1500. The samples were introduced by a syringe pump (Cole Parmer, Vernon Hills, IL) using the 500-μl SGE syringe with the infusion rate 120 μl/hr. Solutions of DMPC vesicles, which where sonicated with and without particles, were sampled, three times each. The former case represented the standard monolayer preparation procedure. All samples were diluted by deionized water containing 0.1% formic acid to make the final DMPC concentration of 5 μg/mL and compared with the fresh and intact DMPC solution of the same concentration and composition.
Partitioning of chemicals
Partitioning to monolayers
The required amount of the DMPC-ODS-particles was suspended in borate buffer (100 μL, pH=7.4) and equilibrated to 37°C overnight. The solution of the compound in the same buffer (37°C) was added to particles, briefly vortexed, and incubated in a water bath shaker (Model 2564; Forma Scientific, Marietta, OH) at 37°C and 140 rpm. The ratio of the amount of particles and the volume of drug solution was estimated so that the expected change in drug concentration in the buffer was between 5 and 95 %. For each compound, five samples were set up at the beginning of the experiment and withdrawn from the shaker at times varying from 0 to 2 hours. The experiments were carried out in the test tubes (13×100 mm, volume 9 mL) with screw caps and Teflon septa to prevent loss of chemicals. The equilibrium was reached for all studied compounds in less than 2 hours.
The particles were separated by centrifugation and the amount of the drug remaining in the solution was determined by UV spectroscopy (UV-1601 Spectrophotometer; Shimadzu Scientific Instruments, Columbia, MD). For compounds with solubility below the detection limits for UV spectroscopy (polychlorinated biphenyls - PCBs), gas chromatography with the mass spectrometry detector (GC/MS/MS Ion Trap, Saturn 2000; Varian, Palo Alto, CA) was used for analysis. The aqueous PCB concentrations were determined using direct solid-phase microextraction (SPME) with 7-μm polydimethylsiloxane (PDMS) fiber (Supelco, Bellefonte, CA) in a 4-mL sample with mechanical stirring under equilibrium (2-PCB) or nonequilibrium conditions (di- through pentachlorobiphenyls), or with headspace SPME extraction (57 °C, 28-mL sample) using 65 μm PDMS/divinylbenzene (DVB) fiber (Supelco, Bellefonte, CA) with sonication under nonequilibrium conditions (2,2′,3,4,4′,5,5′-PCB). Along with each sample, a control containing 100 μL of borate buffer instead of the particles was processed to account for possible evaporation of the chemical during incubation at 37°C.
For the majority of studied compounds, the transport kinetics was too fast to be analyzed in our setup. For non-volatile compounds or volatile compounds with fast evaporation, both with practically instantaneous partitioning, the partition coefficient was calculated as (method A):
| (1) |
Here and in other equations, c and V stand for concentrations and volumes, respectively, The Henry’s constant H characterizes the air/buffer equilibrium (H = 0 for non-volatile compounds). The subscripts indicate the aqueous phase (w), monolayer (m), and air in the headspace (a). The bracketed terms associated with c indicate the initial (0) or equilibrium (eq) concentrations.
The kinetic data were analyzed using two- or three-compartment models (Fig. 1), which are described by linear differential equations (2) - (4).
| (2) |
| (3) |
| (4) |
In all equations, t, S, A, l, and k represent the time, the surface area separating the monolayer and the aqueous phase, the surface area separating water and air, the evaporation rate constants, and the partitioning rate constants, respectively. The subscripts m, w, and a denote the monolayer, water, and air, respectively. The set of equations was integrated for cw and the initial experimental conditions: cw(0) = c0, cm(0) = ca(0) = 0. The integrated expressions for cw(t) were fitted to the experimental data,55 and the final partition coefficient was calculated as (method B):
| (5) |
FIG. 1.
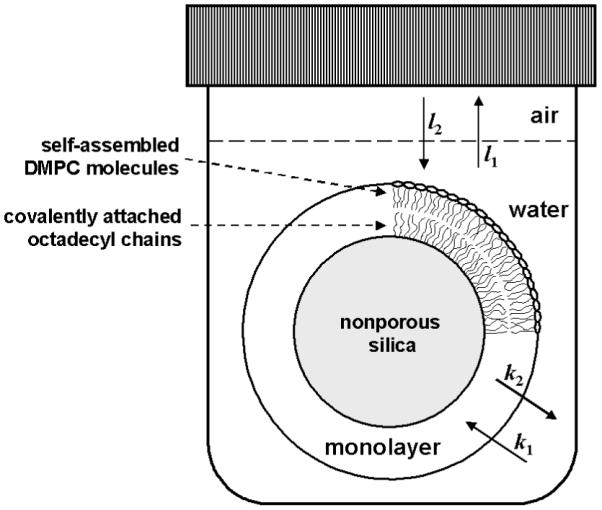
A model for description of drug partitioning between the aqueous phase and the phospholipid monolayer.
For non-volatile compounds, only the equilibrium between the particles and water was considered (l1 = l2 = 0), and equation (4) was omitted. The integrated expressions for cw(t) were fitted to the experimental data,55 and equation (5) was used to calculate the final partition coefficient (method C).
For volatile compounds with fast partitioning and a slow approach to the equilibrium due to evaporation, equation (2) was replaced by equation (6), into which the instant partitioning has been incorporated, and equation (3) was replaced by equation (7).
| (6) |
| (7) |
The set of equations (4), (6), and (7) was integrated for cw and the initial experimental conditions, cw(0) = c0, cm(0) = ca(0) = 0. The partition coefficient was one of the fitted parameters (method D).
All fits were performed by nonlinear regression analysis of experimental data according to the specified equations. In all cases, software Origin55 with the Marquardt algorithm was used.
Partitioning to liposomes
Partitioning of chemicals from the aqueous phase to the DMPC bilayer was monitored using isothermal titration calorimetry (VP-ITC, MicroCal, Northampton, MA). The unilamellar liposomes were prepared56 by extrusion through 0.10-μm polycarbonate filter using a mini-extruder (Avanti Polar Lipids, Alabaster, AL) at 37°C. The suspension for extrusion was obtained by hydration of powdered DMPC (12-28 mM) in borate buffer (pH=7.4) for 48 hours at 37°C with occasional vortexing. The extrusion was repeated 29 times to ensure an even size distribution of the vesicles (∼100 nm). The exact DMPC concentrations after the extrusion were determined by phosphate assay.
All solutions for calorimetry were degassed under vacuum (10 min) to eliminate air bubbles. The calorimeter cell with the volume of 1.4347 mL was filled with the solution of the tested compound in borate buffer (pH=7.4). The exact concentration of the compound was determined by UV spectrophotometry immediately before the experiment. The suspension of liposomes was injected via the titration syringe in aliquots of 10 μL. The temperature of the experiments was 37° C to keep the bilayer in the fluid state. For each experiment, several background titrations were performed: (i) borate buffer into the solution of the tested compound to account for the heat of the compound dilution; (ii) liposome suspension into borate buffer to account for the heat of dilution of the lipid; (iii) borate buffer into borate buffer to account for the apparent heat caused by differences between the temperatures of the solution in cell and in syringe.
Experimental data were processed as previously published.57 The heat generation or consumption after the i-th injection, δhi, was expressed as
| (8) |
where cD is the initial drug concentration in the cell, δcL is increase of lipid concentration in the cell due to an injection of lipid mixture, ΔHDw→b is the enthalpy of transfer of compound from water to bilayer, K is the mole-ratio partition coefficient expressed in units of reciprocal concentration, and Vcell is the volume of the drug solution in the cell. The dilution effect, due to the increase of the volume in the cell after each injection of lipid suspension, was taken into account with respect to both, drug and lipid concentrations. The values of K and ΔHDw→b parameters were obtained by fitting55 of equation (8) to experimental data. The fitted mole-ratio partition coefficient, K, was converted into the molar-concentration partition coefficient, P, as
| (9) |
assuming infinite dilution conditions in both liposomes and water.57 Subscripts b, w, D, and L represent bilayer, water, partitioned compound, and lipid, respectively. The volume of liposomes, VL, was calculated assuming lipid density of ∼1g/mL that was estimated from the properties of the DMPC molecules within the fluid bilayer.47 The term Kcw(1+KcL)/[1+K(cL+ cD)] represents mole-fraction partition coefficient.
Partitioning in alkane/water system was characterized in two ways: structure-based estimates were used if reliable and experimental determination of the partition coefficients was undertaken otherwise. The values of the alkane/water partition coefficients, Pa/w, are similar for different alkane phases, which are used as core surrogates.
For nonpolar compounds (Table 1 below), the Pa/w values were estimated from the Po/w values in the 1-octanol/water system. The use of this cost-saving approach was based on the following factors: (1) the correlation of the Pa/w and Po/w values is excellent because the nonpolar compounds do not form hydrogen-bonds causing deviations;58 (2) the Po/w values can be comparatively precisely predicted from structure, especially for simple nonpolar compounds;59 and (3) the selected ClogP prediction method59 takes into account non-additive contributions to lipophilicity for polychlorinated biphenyls, caused by the vicinity of chlorine substituents. The experimental hexane/water partition coefficients were collected from Table 1 of the precise study by Gobas et al.60 All 28 nonpolar molecules, i.e. those containing carbon, hydrogen, and halogens were included.
The Po/w values were retrieved from the MedChem collection61 for all compounds in Table 1 below and all 28 nonpolar compounds with the Pa/w values,60 except the values for four polybrominated biphenyls, 2,2′,3,3′-, 2,2′,3′,5′-, and 2,2′,3′,6-tetrachlorobiphenyls; and 2,2′,4,5,5′-pentachlorobiphenyl. These missing values were predicted from the excellent correlation of experimental logPo/w values on the ClogP values59 (slope = 0.967±0.016, intercept = 0.095±0.082, n = 47, r2 = 0.988, and SD = 0.135). There were altogether five overpredicted outliers, which can be classified into two groups. The errors of hexabromobenzene and octachloronaphthalene could be caused by the inability of the method to account for large clusters of neighboring halogens. Three most lipophilic compounds with 7, 8, and 10 chlorines and the ClogP values exceeding 8.1 might have flawed experimental Po/w values, which is a well known phenomenon for very lipophilic chemicals.62 There is some overlap between the two outlier groups: decachlorobiphenyl could be a member of the first group and octachloronaphthalene would fit in the second group. None of the mentioned attributes of the outliers is found in eight compounds, for which the Po/w values were predicted.
For the correlation between hexane/water and 1-octanol/water partitioning, mostly experimental data were used: the logPa/w values were from the Gobas et al. study60 and the logPo/w values were the most reliable (star) values from the MedChem collection,61 supplemented by the predicted values for four polybrominated biphenyls as described in the previous paragraph. Octachloronaphthalene and decachlorobiphenyl were excluded for the reasons described in the previous paragraph. The correlation of logPa/w on logPo/w was very good, just the most lipophilic compounds in the data set, hexabrominated and hexachlorinated biphenyls (positions 2, 2′, 4, 4′, 6, and 6′ in both cases), were slightly underpredicted. If these two compounds were omitted, the correlation had the following parameters: slope = 0.978±0.033, intercept = 0.217±0.150, n = 24, r2 = 0.975, SD = 0.205. The omission did not significantly improve the statistical characteristics, and only slightly increased the slope and decreased the intercept. The slope is very close to unity and the intercept is slightly above zero. These regression coefficient values are in close agreement with the notion that the nonpolar compounds are only partitioning in the nonpolar phase of 1-octanol and do not enter the aggregates of water molecules hydrating the hydroxyl groups of 1-octanol. The water aggregates make the overall volume of the nonpolar phase by about 4% smaller than the overall volume of 1-octanol;63 therefore, the Po/w values are slightly smaller than the Pa/w values, in accordance with the slightly positive intercept. This equation was used to calculate the logPa/w values, which are listed in Table 1 below, along with the experimentally available values.
The experimental values for the majority of polar compounds (Table 2 below) were determined in this study by the shake-flask method. Hexadecane and de-ionized water were mutually saturated by stirring in the same flask for 8 hours before the experiments. For each compound, five samples were set up at the beginning of the experiment and incubated at 25°C on an orbital shaker. Samples were withdrawn from the shaker at the times varying from 0 to two days and the amount of the compound left in the aqueous phase was determined by UV spectroscopy (UV-1601; Shimadzu Scientific Instruments, Columbia, MD). The experiments were carried out in test tubes (13×100 mm, volume 9 mL) with screw caps and Teflon septa in order to prevent the loss of compounds after evaporation. Along with each sample, a control containing only the compound dissolved in the aqueous phase was processed to account for possible evaporation of the compound.
For all measured compounds, the equilibrium has been reached within the timescale of the experiment and so the equilibrium data analysis (equation (1) with Vm replaced by Va) was used to determine the partitioning of the compound.
RESULTS AND DISCUSSION
Monolayer preparation
DMPC was the phospholipid of choice for the monolayer system because it contains the most abundant mammalian headgroup and fatty acid chains that are well defined and stable to oxidation. The phospholipid monolayer was deposited on the ODS-particles with a hydrophobic surface formed by octadecyl chains. The octadecyl surface does not interact with water; even vigorous vortexing could not get the intact, DMPC-free ODS-particles into suspension. Upon repetitive sonication/vortexing cycles with phospholipid vesicles, phospholipids were adsorbed to the surface of the ODS-particles. A spontaneous formation of a phospholipid monolayer, with headgroups facing water and acyl chains interacting with the alkylated surface, was expected based upon similar behavior of phospholipids interacting with planar hydrophobic substrates.31,33 Soon after the start of sonication, the surface of coated ODS-particles became hydrophilic, and particles easily immersed into the aqueous phase. The wettability of the particles was used as an early indication of their coating with phospholipid molecules; however, as a detailed analysis unveiled, no regular monolayer was formed initially.
A series of kinetic experiments was carried out to determine the optimal conditions (DMPC/ODS ratio, time of sonication) for the coating process to obtain a complete, even, and reproducible phospholipid monolayer. With increasing DMPC/ODS ratios, less time was necessary for immersion of the particles into the aqueous phase. However, at higher DMPC/ODS ratios, the phosphate assays64 determined the adsorbed phospholipid amounts that were higher than expected for a monolayer, at the time of the immersion of particles into the aqueous phase. Additional sonication time was needed to obtain uniform monolayer coverage. The deposited phospholipid amounts for various lipid concentrations after 7.5 hrs of sonication did not significantly differ between the samples with various DMPC/ODS ratios and were in a close agreement with the expected amount (see below). The actual phospholipid concentration did not play a significant role in obtaining a continuous monolayer as long as the DMPC/ODS ratio was sufficient to completely cover the surface of particles.
Monolayer characterization
The phosphate and carbon assays were used to determine the amount of adsorbed phospholipids. These results were compared with the phospholipid amounts that were expected to form a continuous monolayer based on the properties of the ODS-particles (diameter 1.5 μm and density 2.05 g/mL) and DMPC molecules within the fluid bilayer (surface area 54.9 Å2/phospholipid47). The phosphate assay showed that 91 ± 11 % of the monolayer-forming amount of DMPC was deposited on the surface of particles. The carbon assay was performed on intact and phospholipid-coated ODS-particles. In both cases, 100±3 % of theoretical amount of carbon was detected. Both intact and phospholipid-coated ODS-particles were analyzed in duplicate, and both analyses on each sample provided the same carbon content. The phosphate and carbon assays showed that the amount of phospholipid attached to the surface of ODS-particles corresponds well with the expected amount needed to form a continuous monolayer. These results are in agreement with those for planar monolayers.31
Organization of the monolayer is important for the emulation of phospholipid solvation properties in the bilayer. DSC was used to determine the transition temperature(s) of DMPC adsorbed to the particles (Fig. 2). For the DMPC vesicles, the published data65 (in parentheses) were closely reproduced, with the pre-transition temperature at 13.92 (14) °C and the main transition at 22.09 (24) °C. The DMPC monolayer, along with the octadecyl chains attached to particles, exhibits an upward shift of the entire spectrum, with the pre-transition at 23.07 °C and the main transition at 32.35 °C. This phenomenon can be explained by the difference in the monolayer curvature. The sonication is expected to produce small unilamellar vesicles66 with 25-100 nm diameters (no data shown). Since the particles have a diameter at least 15 times larger, this difference could lead to a significant increase in the transition temperature.50 The upward shift is similar to the data observed in dipalmitoylphosphatidylcholine vesicles,67 so it could also be caused by a more ordered packing of phospholipids adsorbed to the particles than in the liposomes. The intact, DMPC-free ODS-particles could not be analyzed by DSC because they do not form an aqueous suspension due to a very limited wettability.
FIG. 2.
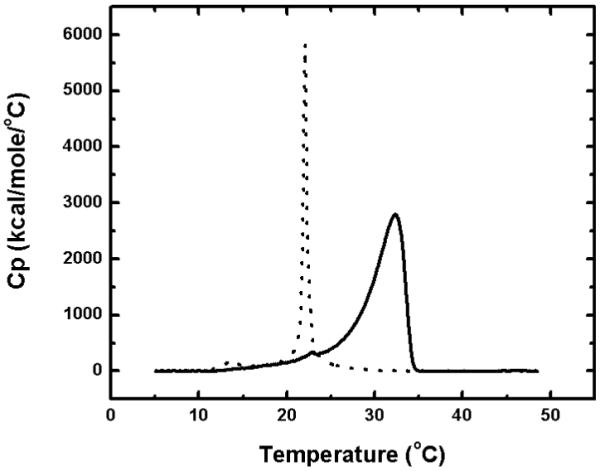
DSC analysis of DMPC monolayers adsorbed on the surface of non-porous ODS-particles (solid line) and small unilamellar DMPC vesicles (dotted line).
The DSC data were also used to determine the temperature at which the partitioning of chemicals was measured, to ensure that the phospholipids were in the fluid state. The temperature five degrees above the determined transition temperature of the monolayer phospholipids was selected for the partitioning experiments, to avoid the formation of domains of fluid and gel phases68 around the transition temperature, when the bilayer is more permeable to chemicals than in the gel or fluid states.69-73
NMR was used to determine the lamellarity of the adsorbed phospholipid layer (Fig. 3). The nature of the sample dictated that solid-state MAS NMR be utilized to acquire a phosphorus NMR signal. The 31P signal was detected by the solid-state MAS technique. PrCl3 was chosen as a shift reagent because the shifted peak is sharper than using Eu3+ and, in contrast to Mn2+, it remains visible.52 Shift reagents cannot penetrate the phospholipid layer therefore they exclusively change the chemical shift of the surface phosphate groups that are in contact with the surrounding aqueous solution. For the phospholipid-coated particles without the shift reagent, a single, narrow resonance at 2.44 ppm was observed (referenced to 85% phosphoric acid). The addition of PrCl3 resulted in a downfield shift by 20 ppm, which was also previously reported for PC vesicles.44 As shown in Fig. 3, with the addition of PrCL3, only one peak was observed, suggesting that the shift reagent interacted with all available phosphate groups and, thus, a single phospholipid monolayer has been formed on the surface of the particles. The resultant peak was significantly broadened. Relaxation effects of shift reagents shift NMR signals and do not broaden them. Hence, it is unlikely that the broadening is a relaxation effect. An explanation for the observed peak shape could be an inhomogeneous concentration of the shift reagent in the sample tube. The MAS experiments were performed in 4-mm rotor tubes (without the use of spherical glass beads). After data acquisition, the coated DMPC-ODS-particles were seen pelleted around the sides of the tube with an aqueous channel in the middle. This phenomenon is not surprising as the ODS-particles have much higher density (2.05 g/mL) than the aqueous solution and the centrifugal force experienced during a 6-kHz rotation would be quite strong. This plating effect could lead to a concentration gradient of liquid that is highest in the middle of the sample and lowest on the edges, thus introducing a spread of chemical shifts that are dependent upon the local concentration of PrCl3.
FIG. 3.
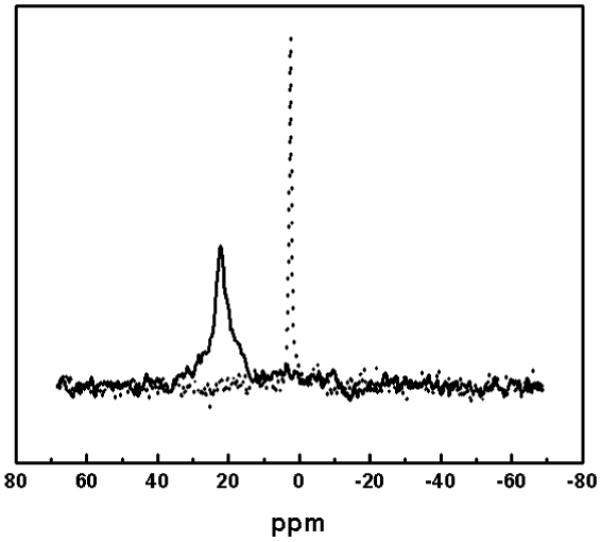
31P-NMR spectra of phospholipid-coated ODS-particles with (solid line) and without (dotted line) PrCl3 as a shift reagent
Mechanical stability of particles under the conditions of prolonged sonication and vortexing applied during the monolayer adsorption was examined using SEM and AFM. Neither of the used methods detected any surface damage, broken particles, or other artifacts. SEM was used to view particles before sonication, after sonication with the phospholipid vesicles, and after sonication in borate buffer. All samples showed smooth particles with uniform size distribution. AFM was used to view particles after sonication with phospholipid vesicles. As in the case of SEM, only smooth particles of the uniform size have been found.
Chemical stability of DMPC in the sonication process was examined using TLC and mass spectrometry. A comparison of the samples before and after sonication showed that even prolonged sonication at an increased temperature did not have any measurable effect on the stability of the used phospholipid and no breakdown products were detected.
Partitioning of chemicals to monolayer
A set of about 80 chemicals was assembled based on the overlap of the following criteria: (1) a broad range of lipophilicity, (2) availability of the alkane/water partition coefficients, and (3) price and availability of the chemical. Preferred were the compounds with published DMPC bilayer/water partition coefficients, which were measured at temperature at least 30° C, well above the transition temperature of 22-24° C, to ensure that no rafts of gel and fluid phase were present in the liposome preparations.
The monolayer/water partition coefficients (Pm/w) in the supported DMPC monolayers on the surface of non-porous ODS-particles were determined using the concentrations of chemicals remaining in the medium, after separation of the particles by mild centrifugation. Distribution of chemicals in the monolayers is much faster than in other experimental systems containing complete bilayers (liposomes and vesicles), where the flip-flop process can take days for some chemicals.74,75 In our proof-of-the-concept study, an analysis of simple nonpolar compounds, which usually easily evaporate, was necessary to establish the correlation for the partitioning into the core, given in equation (11) below. The experiments were performed over up to two-hour periods. In drug candidate profiling, the compounds are usually much less volatile and the exposure time can be shortened to 20 minutes (Fig. 4), so the evaporation experiments can be omitted in their screening.
FIG. 4.
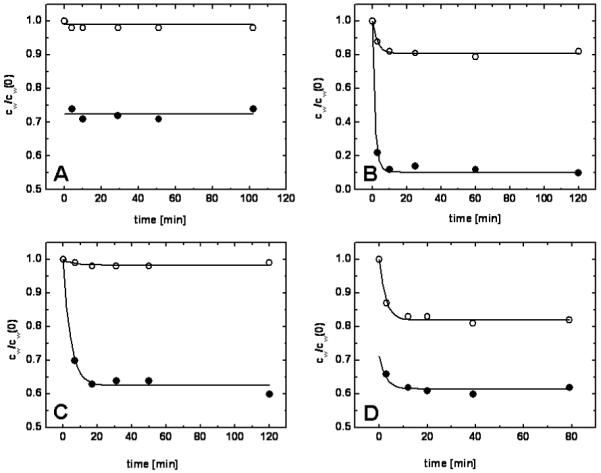
Kinetics of partitioning for different types of compounds. Solid circles represent samples, open circles represent controls, solid lines represent fits of integrated Eqs. 2-7. A - non-volatile compound with fast partitioning (4-chloro-3-methylphenol; equation (1), logPm/w=2.73); B- volatile compound with slow partitioning (2,2′,5,5′-tetrachlorobiphenyl, equations (2)-(5), l1=0.291, l2=0.524, k1=0.014, k2=4 ×10⁻⁸, logPm/w=5.54); C - non-volatile compound with slow partitioning (2-hydroxybiphenyl; equations (2)-(5), l1=l2=0, k1=1.2×10⁻⁴, k2=8.1×10⁻⁸, logPm/w=3.17); D - volatile compound with fast partitioning (naphthalene; equations (4), (6), and (7), l1=0.082, l2=1.730, logPm/w=3.17).
For compounds with fast partitioning (Fig. 4A), both non-volatile and volatile with quickly reached evaporation equilibrium, the overall partition coefficient Pm/w was calculated directly from the differences in the compound concentrations in the control and the sample using method A and equation (1). For the non-volatile compounds with a measurable kinetics of partitioning (Fig. 4C), the Pm/w value was calculated from equation (5) as the ratio of the transport rate constants (method C) obtained by fitting equations (2) and (3), with l1 = l2 = 0, integrated for cw and the given initial conditions, to experimental data. For the volatile compounds, the fast and slow kinetics of partitioning could not be distinguished by monitoring the decrease of compound concentration in the samples because the evaporation was usually the slower process. For this purpose, the mode of partitioning was decided based on the quality of the fit of the two equations. The slow-partitioning data (Fig. 4B) were fitted by integrated equations (2) - (4) and the partition coefficient Pm/w was calculated from the optimized transport rate constants by method B, using equation (5). For fitting the fast partitioning data (Fig. 4D), method D with integrated equations (4), (6), and (7) was used. For compounds with fast partitioning (Figs. 4A,D), the fitted lines for the samples did not meet the fitted lines for the controls in point representing the time t = 0 due to the practically instant achievement of the equilibrium. The results for all measured compounds are listed in Tables 1 and 2.
Table 1.
Partition Coefficients P for 49 Nonpolar Compounds
| compound | logP a/wb | logP in DMPC/water a | ||||
|---|---|---|---|---|---|---|
| liposomes | c/we (calc.) | monolayer | ||||
| b/wc (exp.) | b/wd (calc.) | m/w (exp.) | methodf | |||
| benzene | 2.06 | - | 2.06 | 2.28 | 2.43 | D |
| toluene | 2.75 | - | 2.60 | 2.82 | 2.43 | D |
| chlorobenzene | 3.00 | 2.81 | 2.80 | 3.02 | 3.15 | A |
| p-xylene | 3.25 | 2.98 | 2.99 | 3.22 | 3.49 | D |
| naphthalene | 3.41 | - | 3.12 | 3.34 | 3.19 | D |
| 4-chlorotoluene | 3.47 | - | 3.17 | 3.39 | 3.06 | D |
| o-dichlorobenzene | 3.60 | - | 3.27 | 3.49 | 3.28 | D |
| p-dichlorobenzene | 3.81 | - | 3.43 | 3.65 | 3.22 | D |
| m-dichlorobenzene | 3.70 | - | 3.35 | 3.57 | 3.22 | D |
| biphenyl | 4.08 | - | 3.64 | 3.87 | 3.61 | B |
| 1,3,5-trichlorobenzene | 4.53 | 3.95 | 4.00 | 4.22 | 3.71 | A |
| anthracene | 4.23 | - | 3.76 | 3.98 | 4.08 | A |
| phenanthrene | 4.74 | - | 4.16 | 4.38 | 4.12 | D |
| 2-chlorobiphenyl | 4.65 | - | 4.09 | 4.31 | 4.49 | B |
| 2,2′-dichlorobiphenyl | 5.08 | - | 4.43 | 4.65 | 4.37 | A |
| 2,3-dichlorobiphenyl | 5.08 | - | 4.43 | 4.65 | 4.85 | A |
| 2,3′-dichlorobiphenyl | 5.13 | - | 4.47 | 4.69 | 4.24 | A |
| 2,4-dichlorobiphenyl | 5.4 | - | 4.68 | 4.90 | 4.91 | A |
| 2,4′-dichlorobiphenyl | 5.2 | - | 4.52 | 4.75 | 4.85 | A |
| 2,5-dichlorobiphenyl | 5.26 | - | 4.57 | 4.79 | 4.91 | A |
| 2,6-dichlorobiphenyl | 5.09 | - | 4.44 | 4.66 | 4.37 | A |
| 3,5-dichlorobiphenyl | 5.38 | 4.52 | 4.67 | 4.89 | 4.79g | N/A |
| 4,4′-dichlorobiphenyl | 5.67 | 4.78 | 4.89 | 5.11 | 5.02g | N/A |
| 2,2′,5-trichlorobiphenyl | 5.69 | - | 4.91 | 5.13 | 4.91 | C |
| 2,2′,3-trichlorobiphenyl | 5.41 | - | 4.69 | 4.91 | 5.26 | A |
| 2,2′,4-trichlorobiphenyl | 5.85 | - | 5.03 | 5.26 | 5.06 | A |
| 2,2′,6-trichlorobiphenyl | 5.58 | - | 4.82 | 5.04 | 4.70 | A |
| 2,3′,5-trichlorobiphenyl | 5.85 | - | 5.03 | 5.26 | 4.74 | A |
| 2,3,6-trichlorobiphenyl | 5.76 | - | 4.96 | 5.19 | 5.00 | A |
| 2,3′,4-trichlorobiphenyl | 5.76 | - | 4.96 | 5.19 | 5.10 | A |
| 2,3′,6-trichlorobiphenyl | 5.54 | - | 4.79 | 5.01 | 5.00 | A |
| 2,4,5-trichlorobiphenyl | 5.76 | 5.16 | 4.96 | 5.19 | 5.09g | N/A |
| 2,4,6-trichlorobiphenyl | 5.8 | 4.71 | 5.00 | 5.22 | 5.12g | N/A |
| 2,4′,6-trichlorobiphenyl | 5.84 | - | 5.03 | 5.25 | 5.26 | A |
| 2,2′,3,3′-tetrachlorobiphenyl | 6.12 | 5.40 | 5.25 | 5.47 | 5.37g | N/A |
| 2,2′,3,5′-tetrachlorobiphenyl | 6.23 | - | 5.33 | 5.55 | 5.47 | A |
| 2,2′,3,6-tetrachlorobiphenyl | 6 | - | 5.15 | 5.37 | 4.99 | A |
| 2,2′,4,5-tetrachlorobiphenyl | 5.88 | 5.55 | 5.06 | 5.28 | 5.18g | N/A |
| 2,2′,5,5′-tetrachlorobiphenyl | 6.28 | - | 5.37 | 5.59 | 5.69 | B |
| 2,3,3′,6-tetrachlorobiphenyl | 6.04 | - | 5.18 | 5.41 | 5.47 | A |
| 2,3,4,5-tetrachlorobiphenyl | 6.49 | 5.44 | 5.54 | 5.76 | 5.66g | A |
| 2,2′,4,5,5′-pentachlorobiphenyl | 6.91 | - | 5.87 | 6.09 | 5.68 | B |
| 2,3,4,5,6-pentachlorobiphenyl | 6.81 | 5.90 | 5.79 | 6.01 | 5.91g | A |
| 2,2′,3,3′,4,4′-hexachlorobiphenyl | 7.38 | 6.09 | 6.24 | 6.46 | 6.36g | A |
| 2,2′,3,3′,6,6′-hexachlorobiphenyl | 7.18 | 5.90 | 6.08 | 6.30 | 6.21g | A |
| 2,2′,4,4′,6,6′-hexachlorobiphenyl | 6.5 | 5.98 | 5.54 | 5.77 | 5.67g | A |
| 2,2′,3,4,4′,5,5′-heptachlorobiphenyl | 8.03 | 6.33 | 6.75 | 6.97 | 6.92 | B |
| 2,2′,3,3′,4,5,5′,6-octachlorobiphenyl | 8.58 | 6.18 | 7.18 | 7.40 | 7.30g | A |
| decachlorobiphenyl | 9.69 | 6.17 | 8.05 | 8.27 | 7.40 | A |
The phases are alkanes (a), monolayer (m), bilayer (b), and core (c), each in contact with water (w). The values are measured in this study unless noted otherwise.
For polychlorinated biphenyls and 4-chlorotoluene, recalculated from the 1-octanol/water system to the hexane/water system. For the first three compounds, di- and tri-chloro-benzenes: published values in the hexane/water system.60 For p-xylene, naphthalene, biphenyl, and phenanthrene: published values in the hexadecane/water system.84 For anthracene, the published value from the alkane/water system was used.84
Calculated from equation (10) using the Pc/w values and Vh/Vc volume ratio 2:3. The Ph/w values are assumed to be negligibly small.
Calculated using equation (11) with coefficients α=0.664 and β=0.785.
Data processing method A: for volatile chemicals with fast evaporation or nonvolatile chemicals, both with fast transport, using equation (1); B: for volatile chemicals with slow transport, using equations (2)-(5); C: for nonvolatile chemicals with slow transport, using equations (2), (3), (5); and D: for volatile chemicals with fast transport, using equations (4), (6), (7). N/A - the data were not fitted, monolayer/water partition coefficient was calculated directly from equilibrium concentrations using equation (1)
Estimated from equation (10) using the Pc/w values and Vh/Vc volume ratio 4.11. The Ph/w values are assumed to be negligibly small
Table 2.
Partition Coefficients P for 32 Polar Molecules
| compound | logP a/w | logP in DMPC/water a | ||||||
|---|---|---|---|---|---|---|---|---|
| c/wb | liposomes | Monolayer | ||||||
| b/w (exp.) | h/wc (calc.) | b/wd (calc.) | m/w (exp.) | h/we (calc.) | methodf | |||
| 4-amino-3-methylphenol | -2.63 | -1.40 | 2.11 | 2.51 | 2.11 | 1.80 | 2.51 | A |
| aniline | -0.05g | 0.62 | 1.63h | 2.00 | 2.63 | 2.32 | 3.02 | A |
| 9-anthracenemethanol | 1.99 | 2.23 | 3.50 | 3.88 | 3.50 | 3.21 | 3.88 | A |
| 2-allylphenol | 0.46 | 1.03 | 3.06h | 3.46 | 2.80 | 2.50 | 3.20 | A |
| benzocaine | 0.13 | 0.77 | 2.27 | 2.66 | 2.46 | 2.16 | 2.85 | A |
| 4-biphenylcarboxaldehyde | 3.01 | 3.03 | 3.14 | 3.27 | 3.13 | 3.08 | 3.25 | A |
| 4-chloro-3-methylphenol | 0.31g | 0.91 | 3.34h | 3.74 | 3.04 | 2.73 | 3.43 | A |
| cinnamamide | 1.24 | 1.64 | 1.86 | 2.06 | 1.72 | 1.68 | 1.82 | A |
| 1,5-dihydroxynaphthalene | -2.80 | -1.53 | 2.71 | 3.11 | 2.46 | 2.15 | 2.86 | D |
| indapamide | -2.18 | -1.05 | 2.47 | 2.87 | 2.27 | 1.96 | 2.67 | D |
| 1-naphthaldehyde | 2.21 | 2.40 | 2.80 | 3.08 | 2.77 | 2.62 | 3.04 | C |
| nifedipine | 1.05 | 1.49 | 3.72 | 4.12 | 3.21 | 2.91 | 3.60 | D |
| 3-nitroaniline | -0.61g | 0.19 | 2.17h | 2.57 | 2.49 | 2.18 | 2.88 | A |
| nitrobenzene | 1.45g | 1.80 | 2.01h | 2.21 | 1.80 | 1.80 | 1.79 | A |
| 2-hydroxybiphenyl | 1.42 | 1.78 | 3.46h | 3.85 | 3.45 | 3.15 | 3.84 | C |
| quinoline | 1.26g | 1.65 | 1.67h | 1.69 | 1.90 | 1.79 | 2.11 | A |
| 2,4,5-trichloroaniline | 2.14 | 2.34 | 4.16h | 4.55 | 3.60 | 3.31 | 3.98 | C |
| MMPI-1i | -0.34 | 0.40 | 1.91 | 2.30 | 2.47 | 2.16 | 2.86 | D |
| MMPI-2 | 0.60 | 1.14 | 2.57 | 2.96 | 2.82 | 2.52 | 3.21 | D |
| MMPI-3 | 0.28 | 0.88 | 2.80 | 3.19 | 2.77 | 2.47 | 3.17 | D |
| MMPI-4 | 1.22 | 1.62 | 3.61 | 4.01 | 3.60 | 3.29 | 3.99 | D |
| MMPI-5 | 1.51 | 1.85 | 2.75 | 3.11 | 3.02 | 2.74 | 3.40 | D |
| MMPI-6 | 1.44 | 1.79 | 2.70 | 3.06 | 2.93 | 2.65 | 3.31 | D |
| MMPI-7 | -0.97 | -0.10 | 2.54 | 2.94 | 2.82 | 2.51 | 3.22 | D |
| MMPI-8 | 0.25 | 0.86 | 2.27 | 2.66 | 2.26 | 1.97 | 2.65 | A |
| MMPI-9 | -0.32 | 0.41 | 1.93 | 2.32 | 2.45 | 2.14 | 2.84 | A |
| MMPI-10 | 0.28 | 0.88 | 3.10 | 3.50 | 3.12 | 2.81 | 3.51 | A |
| MMPI-11 | -0.88 | -0.03 | 3.72 | 4.12 | 3.86 | 3.55 | 4.26 | A |
| MMPI-12 | 1.85 | 2.12 | 3.66 | 4.05 | 3.62 | 3.32 | 4.01 | A |
| MMPI-13 | -1.45 | -0.47 | 3.50 | 3.90 | 3.60 | 3.29 | 4.00 | A |
| MMPI-14 | 0.25 | 0.86 | 2.50 | 2.89 | 2.42 | 2.12 | 2.81 | A |
| MMPI-15 | -1.53 | -0.54 | 2.22 | 2.62 | 2.21 | 1.90 | 2.61 | D |
The phases are alkanes (a), monolayer (m), bilayer (b), core (c), and the headgroup region (h), each in contact with water (w). The values are measured in this study unless noted otherwise.
Calculated using equation (11) with coefficients α=0.664 and β=0.785.
Calculated using rearranged equation (10), with Pb/w and Pc/w values, and the headgroup/core volume ratio 2:3.
Calculated using equation (10) with Pc/w, Ph/w values obtained from the monolayer data, and Vh/Vc volume ratio 2:3.
Calculated using rearranged equation (10), with Pb/w and Pc/w values, and the headgroup/core volume ratio 1:4.11.
See note f in Table 1.
Published values in the alkane/water system, except 4-choro-3-methylphenol, for which the hexadecane/water value was used.84
Published values.82
Matrix metalloproteinase inhibitors, synthesized in-house, structures summarized in Table 3.
Estimation of partitioning to headgroup and core regions
The deconvolution of the overall partition coefficients into their headgroup and core components is important for two reasons. First, the headgroups/water and core/water partition coefficients are necessary for the prediction of the bilayer partitioning that, in turn, is needed to estimate membrane and tissue accumulation,2 as well as the volume of distribution3 in pharmacokinetics. Second, the intermediate strength of the interactions of chemicals with each bilayer region is a pre-requisite for a fast trans-bilayer transport and too high or too low partition coefficients lead to a transport slow-down.1
Solvation in individual regions of phospholipid bilayers and monolayers is a complex process. The outcome is interplay of the cavity formation energy, interactions of compounds with phospholipid parts, electrostatic interactions with membrane and dipole potentials, and entropy terms.76 We are taking a simplified approach, aiming at a coarse difference between the partitioning to the core and other positions, using alkanes as surrogates imitating the solvation in the core. In this framework, the partitioning of chemicals in phospholipid monolayers and bilayers includes adsorption in the headgroup region and accumulation in the core:
| (10) |
The partition coefficient, Px/w (x = m or b for the monolayer or the bilayer, respectively), is the weighed sum of the headgroups/water and core/water partition coefficients, Ph/w and Pc/w, respectively; c are the concentrations and V are the volumes of the phases given by the subscript: h - the headgroup region, c - the core, and x - the entire monolayer or bilayer. The concentration in the headgroup region includes the molecules that are completely solvated there and also the molecules that interact with both the headgroups and the core in a surfactant-like manner.
Based on experimental data77 and molecular dynamics calculations,78 the volume ratio of a headgroup region and a half of the core formed by fatty acyl chains of DMPC in the monolayer was estimated as 1:1.5. In addition to the acyl chains, the hydrophobic core in the monolayer contains octadecyl chains attached to the particles. The thickness of the monolayer formed by self-assembled octadecyl chains on glass33 and silica79,80 supports measured by ellipsometry,80 X-ray reflectivity,79 and AFM33 was found to be 23, 26, and 30 Å, respectively. The values of the measured core/water and headgroup/water partition coefficients of the studied compounds did not vary significantly using the three different values (data not shown), therefore the average value of 26.3 Å was used in further analyses. Considering this thickness of the octadecyl chain monolayer, the ratio of volumes of the headgroup region and the hybrid phospholipid/octadecyl hydrophobic core was found to be 1:4.11.
Partitioning to the core region
For nonpolar compounds, containing no charges, no hydrogen bond donors nor acceptors, the accumulation in the headgroup region is assumed to be negligible, i.e. Ph/w = 0 in equation (10), and the measured partitioning only consists of accumulation in the core. For these chemicals, the measured monolayer/water partition coefficient, Pm/w, depends only on the core/water partition coefficient, Pc/w. The latter can be estimated from the alkane/water partition coefficient, Pa/w, using equation (11) relating the partition coefficients in two solvent systems, which are capable of similar interactions with the studied compounds:81
| (11) |
The values of empirical coefficients α and β were determined using 36 pairs (Pm/w, Pa/w) and 15 pairs (Pb/w, Pa/w) for a series of 47 nonpolar compounds consisting of only aromatic hydrocarbons and their halogenated derivatives. Experimental values of Pb/w and Pm/w (Table 1) were used. The Vx/Vc ratios were 5/3 for liposomes77,78 and 5.11/4.11 for monolayers. The fit of equation (11) provided the optimized coefficient values of α = 0.644 ± 0.145 and β = 0.785 ± 0.027. The quality of the fit was excellent (Fig. 5), as documented by the statistical indices: number of data points n = 49 (hepta-, octa-, and decachlorobiphenyls excluded because no reliable Pa/w values were available), the squared correlation coefficient R2 = 0.945, and SD = 0.240. No specific trends for the P values for the core/water partitioning in the DMPC liposomes and in the monolayers can be discerned in Fig. 5. This observation suggests that the solvation properties of the hydrophobic cores in the two systems are similar.
FIG. 5.

The core/water partition coefficients of nonpolar compounds (Table 1), calculated using equations (11) from the partition coefficients for DMPC liposomes (open points) and DMPC monolayers (full points), as dependent on the alkane/water partition coefficients.
Partitioning to the headgroup region
The values of experimentally determined partition coefficients in unilamellar DMPC liposomes (measured in this study or obtained from literature82) and DMPC monolayers for a series of 32 polar compounds are summarized in Table 2. The optimized coefficients α and β for equation (11) were used to estimate the Pc/w values for the series. The Ph/w values were consequently obtained separately from the monolayer and bilayer data using rearranged equation (10). The estimated logPc/w, and both logPh/w values are also listed in Table 2. Based on the correlation for the core/water partitioning of nonpolar compounds, measured in for monolayers and liposomes (Fig. 5), the solvation properties in the cores of the two systems are considered similar. For all compounds except aniline (discussed below), a reasonable agreement was obtained also for calculated headgroup/core partition coefficients (Table 2).
Prediction of bilayer/water partition coefficients
For the suggested use in the drug profiling process, the partitioning is measured with the monolayer microspheres and alkane/water partition coefficients are either determined experimentally in a high-throughput setting83 or estimated from structure.84,85 The core/water partition coefficients are estimated from the Pa/w values using the calibrated equation (11). The headgroup/water partitioning is estimated from the experimental monolayer data using the estimated Pc/w values using rearranged equation (10) and the Vh/Vc volume ratio 1:4.11. Finally, the bilayer partition coefficients are calculated from the estimated Ph/w and Pc/w using equation (10) and the Vh/Vc volume ratio 2:3.
The results are summarized in Table 2. The agreement between experimental and estimated bilayer partition coefficients is satisfactory, as can be seen for both polar and nonpolar compounds in Figure 6. The only significant difference between the measured and estimated liposome partition coefficients was found for aniline (1.00 on logarithmic scale). This could be explained by possible amphiphilic character and a higher binding of aniline to the headgroup region, which can significantly slow down the transport.74,75 The 30-minute period that was allowed for partitioning to liposomes82 might not be sufficient for reaching the equilibrium, thus leading to an underestimated measured bilayer partition coefficients. If aniline is excluded, the bilayer partition coefficients can be estimated with the standard deviation of 0.26 logarithmic units.
FIG. 6.

Comparison of bilayer/water partition coefficient determined in liposomes and calculated using the monolayer/water and alkane/water partition coefficients. The data are valid for polar (points, Table 2) and nonpolar compounds (crosses, Table 1). The liposome data were either measured in this study (full points) or published (open points and crosses). The identity line is plotted to guide the eye.
Prospects for high-throughput screening
The presented novel phospholipid monolayer system is assumed to have the core thickness and solvation properties similar to those of the bilayer because it is formed by the self-assembly of phospholipid molecules and octadecyl chains. In contrast, the widely used bilayer surrogate IAM that is formed by phospholipid molecules that are covalently bound to porous silica microspheres, has the core thickness of about half of that in the bilayer. Moreover, the fatty acyl chains in IAM exhibit a restricted mobility due to their covalent attachment. In comparison with liposomes, the presented system is easier to work with, while providing the data comparable to the data reported for liposomes.
As the data analysis showed, the variations in the thickness of hydrophobic core up to 7 Å do not translate into significant differences in the determined partition coefficients of studied chemicals. This observation opens the possibility to use shorter phospholipids with low transition temperatures for the monolayer formation and simplify the measurement which could be performed at room temperature. The change in the core volume can be easily accounted for in the calculations. Possible problems with sufficiency of the core volume for solvating larger molecules would need to be examined.
The phospholipid monolayer system is suitable for high-throughput screening due to the speed at which the equilibirium is achieved and the ease of separation. Based on our data (e.g., Fig. 4), the incubation time 20 minutes can be recommended, to ensure equilibrium conditions of the measurement. For polar drug-like chemicals, with low volatility, the short exposure time makes the control experiment on evaporation unnecessary in most cases. The used volumes and amounts can be proportionally scaled down to the quantities fitting the plate wells. The required mild centrifugation can be performed in well plates. Overall, this method is capable of providing a sizable throughput without sacrificing the details of drug-bilayer interactions which, until now, could accurately be obtained only by slow and cumbersome analyses of liposome partitioning.
The measured monolayer partition coefficients are important properties for the estimation of the tissue/blood partition coefficients, the volumes of distribution, passive renal clearance, passive absorption rates, and other parameters necessary for prediction of the in vivo pharmacokinetic characteristics of the suitable drug candidates. These characteristics are currently estimated using less proper surrogates.86 It can be expected that the precision of the estimates for pharmacokinetic characteristics will increase significantly with the use of relevant drug properties.
The data analysis can easily be adjusted to the complexity of information that is required. In the initial screens where a fast identification of compounds with suitable partitioning is the main goal, the equlibirum analysis can be performed using equation (1). In later stages, where the details of partitioning are needed to narrow the few tens or hudreds of possible candidates down to a small number of potential lead compounds, details of the partitioning kinetics of can be obtained by fitting the time-dependent changes of drug concentrations in aqueous phase using eqautions (2)-(5) or (4), (6), and (7).
Table 3.
Structures of Tested Inhibitors of Matrix Metalloproteinases (MMPIs) and More Complex Molecules
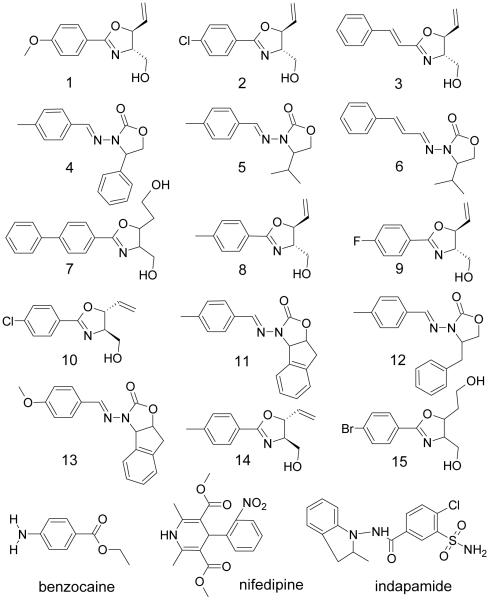
|
Acknowledgment
This work was supported in part by the NIH NCRR grants 1 PP20 RR 15566 and 1 P20 RR 16471, as well as NIH Research Service Award Postdoctoral Fellowship GM20298 to G.F.
References
- 1.Balaz S. Lipophilicity in trans-bilayer transport and subcellular pharmacokinetics. Perspect Drug Discov Design. 2000;19:157–177. [Google Scholar]
- 2.Luxnat M, Galla HJ. Partition of chlorpromazine into lipid bilayer membranes: the effect of membrane structure and composition. Biochim Biophys Acta. 1986;856:274–282. doi: 10.1016/0005-2736(86)90037-4. [DOI] [PubMed] [Google Scholar]
- 3.Zachowski A, Durand P. Biphasic nature of the binding of cationic amphipaths with artificial and biological membranes. Biochim Biophys Acta. 1988;937:411–416. doi: 10.1016/0005-2736(88)90263-5. [DOI] [PubMed] [Google Scholar]
- 4.Kitamura K, Imayoshi N, Goto T, Shiro H, Mano T, Nakai Y. Second-derivative spectrophotometric determination of partition coefficients of chlorpromazine and promazine between lecithin bilayer vesicles and water. Anal Chim Acta. 1995;304:101–106. [Google Scholar]
- 5.Takegami S, Kitamura K, Takahashi K, Kitade T. Partition of N-monodemethylated phenothiazine drugs to phosphatidylcholine bilayer vesicles studied by second-derivative spectrophotometry. J Pharm Sci. 2002;91:1568–1572. doi: 10.1002/jps.10121. [DOI] [PubMed] [Google Scholar]
- 6.Pola A, Michalak K, Burliga A, Motohashi N, Kawase M. Determination of lipid bilayer/water partition coefficient of new phenothiazines using the second derivative of absorption spectra method. Eur J Pharm Sci. 2004;21:421–427. doi: 10.1016/j.ejps.2003.10.007. [DOI] [PubMed] [Google Scholar]
- 7.Casals E, Galan AM, Escolar G, Gallardo M, Estelrich J. Physical stability of liposomes bearing hemostatic activity. Chem Phys Lipids. 2003;125:139–146. doi: 10.1016/s0009-3084(03)00086-0. [DOI] [PubMed] [Google Scholar]
- 8.Liu XY, Yang Q, Hara M, Nakamura G, Miyake J. A novel chromatographic solid support with immobilized unilamellar liposomes for model analysis of solute-membrane interaction: Comparison with analysis using immobilized artificial membranes and free liposomal membranes. Mater Sci Eng C. 2001;17:119–126. [Google Scholar]
- 9.Danelian E, Karlen A, Karlsson R, Winiwarter S, Hansson A, Lofas S, Lennernas H, Hamalainen MD. SPR biosensor studies of the direct interaction between 27 drugs and a liposome surface: correlation with fraction absorbed in humans. J Med Chem. 2000;43:2083–2086. doi: 10.1021/jm991156g. [DOI] [PubMed] [Google Scholar]
- 10.Avdeef A, Box KJ, Comer JEA, Hibbert C, Tam KY. pH-metric logP 10. Determination of liposomal membrane-water partition coefficients of ionizable drugs. Pharm Res. 1998;15:209–215. doi: 10.1023/a:1011954332221. [DOI] [PubMed] [Google Scholar]
- 11.Balon K, Riebesehl BU, Müller BW. Drug liposome partitioning as a tool for the prediction of human passive intestinal absorption. Pharm Res. 1999;16:882–888. doi: 10.1023/a:1018882221008. [DOI] [PubMed] [Google Scholar]
- 12.Raedler J, Strey H, Sackmann E. Phenomenology and kinetics of lipid bilayer spreading on hydrophilic surfaces. Langmuir. 1995;11:4539–4548. [Google Scholar]
- 13.Reimhult E, Hook F, Kasemo B. Temperature dependence of formation of a supported phospholipid bilayer from vesicles on SiO2. Phys Rev E. 2002;66:051905/1–051905/4. doi: 10.1103/PhysRevE.66.051905. [DOI] [PubMed] [Google Scholar]
- 14.Loidl-Stahlhofen A, Eckert A, Hartmann T, Schottner M. Solid-supported lipid membranes as a tool for determination of membrane affinity: high-throughput screening of a physicochemical parameter. J Pharm Sci. 2001;90:599–606. doi: 10.1002/1520-6017(200105)90:5<599::aid-jps1016>3.0.co;2-n. [DOI] [PubMed] [Google Scholar]
- 15.Leonenko ZV, Carnini A, Cramb DT. Supported planar bilayer formation by vesicle fusion: the interaction of phospholipid vesicles with surfaces and the effect of gramicidin on bilayer properties using atomic force microscopy. Biochim Biophys Acta. 2000;1509:131–147. doi: 10.1016/s0005-2736(00)00288-1. [DOI] [PubMed] [Google Scholar]
- 16.Tamm LK, Boehm C, Yang J, Shao Z, Hwang J, Edidin M, Betzig E. Nanostructure of supported phospholipid monolayers and bilayers by scanning probe microscopy. Thin Solid Films. 1996;284-285:813–816. [Google Scholar]
- 17.Cremer PS, Boxer SG. Formation and spreading of lipid bilayers on planar glass supports. J Phys Chem B. 1999;103:2554–2559. [Google Scholar]
- 18.Bayerl TM, Bloom M. Physical properties of single phospholipid bilayers adsorbed to micro glass beads. A new vesicular model system studied by deuterium nuclear magnetic resonance. Biophys J. 1990;58:357–362. doi: 10.1016/S0006-3495(90)82382-1. [DOI] [PMC free article] [PubMed] [Google Scholar]
- 19.Johnson SJ, Bayerl TM, McDermott DC, Adam GW, Rennie AR, Thomas RK, Sackmann E. Structure of an adsorbed dimyristoylphosphatidylcholine bilayer measured with specular reflection of neutrons. Biophys J. 1991;59:289–294. doi: 10.1016/S0006-3495(91)82222-6. [DOI] [PMC free article] [PubMed] [Google Scholar]
- 20.Ekeroth J, Konradsson P, Hoeoek F. Bivalent-Ion-Mediated Vesicle Adsorption and Controlled Supported Phospholipid Bilayer Formation on Molecular Phosphate and Sulfate Layers on Gold. Langmuir. 2002;18:7923–7929. [Google Scholar]
- 21.Ng CC, Cheng YL, Pennefather PS. Properties of a self-assembled phospholipid membrane supported on Lipobeads. Biophys J. 2004;87:323–331. doi: 10.1529/biophysj.103.030627. [DOI] [PMC free article] [PubMed] [Google Scholar]
- 22.Ziegler W, Gaburjakova J, Gaburjakova M, Sivak B, Rehacek V, Tvarozek V, Hianik T. Agar-supported lipid bilayers - basic structures for biosensor design. Electrical and mechanical properties. Colloid Surface A. 1998;140:357–367. [Google Scholar]
- 23.Hianik T, Snejdarkova M, Rehak M, Passechnik VI, Sokolikova L, Sivak B, Ivanov SA. Electrostriction of lipid bilayers on a solid support and peculiarity of membranes from archaeal lipids. Thin Solid Films. 1996;284-285:817–821. [Google Scholar]
- 24.Hianik T, Dlugopolsky J, Gyeppessova M, Sivak B, Tien HT. Ottova-Leitmannova A Stabilization of bilayer lipid membranes on solid supports by trehalose. Bioelectroch Bioener. 1996;39:299–302. [Google Scholar]
- 25.Hianik T, Dlugopolsky J, Passechnik VI, Sargent DF, Ivanov SA. Electrostriction and membrane potential of lipid bilayers on a metal support. Colloid Surface A. 1996;106:109–118. [Google Scholar]
- 26.Steinem C, Janshoff A, Ulrich WP, Sieber M, Galla HJ. Impedance analysis of supported lipid bilayer membranes: A scrutiny of different preparation techniques. Biochim Biophys Acta. 1996;1279:169–180. doi: 10.1016/0005-2736(95)00274-x. [DOI] [PubMed] [Google Scholar]
- 27.Naumann CA, Prucker O, Lehmann T, Ruehe J, Knoll W, Frank CW. The polymer-supported phospholipid bilayer: Tethering as a new approach to substrate-membrane stabilization. Biomacromolecules. 2002;3:27–35. doi: 10.1021/bm0100211. [DOI] [PubMed] [Google Scholar]
- 28.Stephens SM, Dluhy RA. In-situ and ex-situ structural analysis of phospholipid-supported planar bilayers using infrared spectroscopy and atomic force microscopy. Thin Solid Films. 1996;284-285:381–386. [Google Scholar]
- 29.Brechling A, Sundermann M, Kleineberg U, Heinzmann U. Characterization of DMPC bilayers and multilamellar islands on hydrophobic self-assembled monolayers of ODS/Si(100) and mixed ODS-DDS/Si(100) Thin Solid Films. 2003;433:281–286. [Google Scholar]
- 30.Smith DPE, Bryant A, Quate CF, Rabe JP, Gerber Ch, Swalen JD. Images of a lipid bilayer at molecular resolution by scanning tunneling microscopy. P Natl Acad Sci USA. 1987;84:969–972. doi: 10.1073/pnas.84.4.969. [DOI] [PMC free article] [PubMed] [Google Scholar]
- 31.Meuse CW, Krueger S, Majkrzak CF, Dura JA, Fu J, Connor JT, Plant AL. Hybrid bilayer membranes in air and water: infrared spectroscopy and neutron reflectivity studies. Biophys J. 1998;74:1388–1398. doi: 10.1016/S0006-3495(98)77851-8. [DOI] [PMC free article] [PubMed] [Google Scholar]
- 32.Love JC, Estroff LA, Kriebel JK, Nuzzo RG, Whitesides GM. Self-assembled monolayers of thiolates on metals as a form of nanotechnology. Chem Rev. 2005;105:1103–1170. doi: 10.1021/cr0300789. [DOI] [PubMed] [Google Scholar]
- 33.Winger TM, Chaikof EL. Synthesis and characterization of supported phospholipid monolayers: A correlative investigation by radiochemical titration and atomic force microscopy. Langmuir. 1998;14:4148–4155. [Google Scholar]
- 34.Pidgeon C, Venkataram UV. Immobilized artificial membrane chromatography: supports composed of membrane lipids. Anal Biochem. 1989;176:36–47. doi: 10.1016/0003-2697(89)90269-8. [DOI] [PubMed] [Google Scholar]
- 35.Pidgeon C, Ong SW, Liu HL, Qiu XX, Pidgeon M, Dantzig AH, Munroe J, Hornback WJ, Kasher JS, Glunz L, Szczerba T. IAM chromatography: An in vitro screen for predicting drug membrane permeability. J Med Chem. 1995;38:590–594. doi: 10.1021/jm00004a004. [DOI] [PubMed] [Google Scholar]
- 36.Ong S, Liu H, Qiu X, Bhat G, Pidgeon C. Membrane partition coefficients chromatographically measured using immobilized artificial membrane surfaces. Anal Chem. 1995;67:755–762. doi: 10.1021/ac00100a011. [DOI] [PubMed] [Google Scholar]
- 37.Barbato F, la Rotonda MI, Quaglia F. Chromatographic indices determined on an immobilized artificial membrane (IAM) column as descriptors of lipophilic and polar interactions of 4-phenyldihydropyridine calcium channel blockers with biomembranes. Eur J Med Chem. 1996;31:311–318. [Google Scholar]
- 38.Barbato F, la Rotonda MI, Quaglia F. Interactions of nonsteroidal antiinflammatory drugs with phospholipids: Comparison between octanol/buffer partition coefficients and chromatographic indexes on immobilized artificial membranes. J Pharm Sci. 1997;86:225–229. doi: 10.1021/js960233h. [DOI] [PubMed] [Google Scholar]
- 39.Yang CY, Cai SJ, Liu HL, Pidgeon C. Immobilized artificial membranes - Screens for drug membrane interactions. Adv Drug Deliv Rev. 1996;23:229–256. [Google Scholar]
- 40.Taillardat-Bertschinger A, Martinet CAM, Carrupt PA, Reist M, Caron G, Fruttero R, Testa B. Molecular factors influencing retention on immobilized artificial membranes (IAM) compared to partitioning in liposomes and n-octanol. Pharm Res. 2002;19:729–737. doi: 10.1023/a:1016156927420. [DOI] [PubMed] [Google Scholar]
- 41.Ong S, Pidgeon C. Thermodynamics of solute partitioning into immobilized artificial membranes. Anal. Chem. 1995;67:2119–2128. doi: 10.1021/ac00109a034. [DOI] [PubMed] [Google Scholar]
- 42.Sheng Q, Schulten K, Pidgeon C. Molecular dynamics simulation of immobilized artificial membranes. J Phys Chem. 1995;99:11018–11027. [Google Scholar]
- 43.Ong S, Qiu X, Pidgeon C. Solute interactions with immobilized artificial membranes. J Phys Chem. 1994;98:10189–10199. [Google Scholar]
- 44.Ong S, Liu H, Pidgeon C. Immobilized-artificial-membrane chromatography: measurements of membrane partition coefficient and predicting drug membrane permeability. J. Chromatogr A. 1996;728:113–128. doi: 10.1016/0021-9673(95)00837-3. [DOI] [PubMed] [Google Scholar]
- 45.Escher BI, Schwarzenbach RP, Westall JC. Evaluation of liposome-water partitioning of organic acids and bases. 2. Comparison of experimental determination methods. Environ Sci Technol. 2000;34:3962–3968. [Google Scholar]
- 46.Ong S, Cai SJ, Bernal C, Rhee D, Qiu X, Pidgeon C. Phospholipid immobilization on solid surfaces. Anal Chem. 1994;66:782–792. doi: 10.1021/ac00078a004. [DOI] [PubMed] [Google Scholar]
- 47.Cook GR, Maity BC, Kargbo R. Highly diastereoselective indium-mediated allylation of chiral hydrazones. Org Letters. 2004;6:1741–1743. doi: 10.1021/ol0496172. [DOI] [PubMed] [Google Scholar]
- 48.Cook GR, Manivannan E, Underdahl T, Lukacova V, Zhang Y, Balaz S. Synthesis and evaluation of novel oxazoline MMP inhibitors. Bioorg Med Chem Letters. 2004;14:4935–4939. doi: 10.1016/j.bmcl.2004.07.023. [DOI] [PubMed] [Google Scholar]
- 49.Cortesi R, Esposito E, Gambarin S, Telloli P, Menegatti E, Nastruzzi C. Preparation of liposomes by reverse-phase evaporation using alternative organic solvents. J Microencapsul. 1999;16:251–256. doi: 10.1080/026520499289220. [DOI] [PubMed] [Google Scholar]
- 50.Brumm T, Jorgensen K, Mouritsen OG, Bayerl TM. The effect of increasing membrane curvature on the phase transition and mixing behavior of a dimyristoyl-sn-glycero-3-phosphatidylcholine/distearoyl-sn-glycero-3-phosphatidylcholine lipid mixture as studied by Fourier transform infrared spectroscopy and differential scanning calorimetry. Biophys J. 1996;70:1373–1379. doi: 10.1016/S0006-3495(96)79695-9. [DOI] [PMC free article] [PubMed] [Google Scholar]
- 51.Plant AL, Brigham BM, Petrella EC, O’Shannessy DJ. Phospholipid/alkanethiol bilayers for cell-surface receptor studies by surface plasmon resonance. Anal Biochem. 1995;226:342–348. doi: 10.1006/abio.1995.1234. [DOI] [PubMed] [Google Scholar]
- 52.Frohlich M, Brecht V, Peschka-Suss R. Parameters influencing the determination of liposome lamellarity by 31P-NMR. Chem Phys Lipids. 2001;109:103–112. doi: 10.1016/s0009-3084(00)00220-6. [DOI] [PubMed] [Google Scholar]
- 53.Kates M. Techniques in Lipidology: Isolation, Analysis and Identification of Lipids. North-Holland Publishing Company; Amsterdam: 1975. [Google Scholar]
- 54.Fang J, Barcelona MJ. Structural determination and quantitative analysis of bacterial phospholipids using liquid chromatography/electrospray ionization/mass spectrometry. J Microbiol Methods. 1998;33:23–35. [Google Scholar]
- 55.Origin. MicroCal Software; Northampton, MA, USA: 1999. version 7.0. [Google Scholar]
- 56.MacDonald RC, MacDonald RI, Menco BP, Takeshita K, Subbarao NK, Hu LR. Small-volume extrusion apparatus for preparation of large, unilamellar vesicles. Biochim Biophys Acta. 1991;1061:297–303. doi: 10.1016/0005-2736(91)90295-j. [DOI] [PubMed] [Google Scholar]
- 57.Heerklotz H, Seelig J. Titration calorimetry of surfactant-membrane partitioning and membrane solubilization. Biochim Biophys Acta. 2000;1508:69–85. doi: 10.1016/s0304-4157(00)00009-5. [DOI] [PubMed] [Google Scholar]
- 58.Seiler P. Interconversion of lipophilicities from hydrocarbon/water systems into the octanol/water system. Eur J Med Chem. 1974;9:473–479. [Google Scholar]
- 59.Leo A, Weininger D. ClogP for SGI Platform. Biobyte Corp; Claremont, CA: 1999. version 4.0. [Google Scholar]
- 60.Gobas FAPC, Lahittete JM, Garofalo G, Shiu WY, Mackay D. A novel method for measuring membrane-water partition coefficients of hydrophobic organic chemicals: comparison with 1-octanol-water partitioning. J Pharm Sci. 1988;77:265–272. doi: 10.1002/jps.2600770317. [DOI] [PubMed] [Google Scholar]
- 61.Hansch C, Leo A. Exploring QSAR: Fundamentals and Applications in Chemistry and Biology. American Chemical Society; Washington, DC: 1995. [Google Scholar]
- 62.de Bruijn J, Busser F, Seinen W, Hermens J. Determination of octanol/water partition coefficients for hydrophobic organic chemicals with the “slow-stirring” method. Environ Toxicol Chem. 1989;8:499–512. [Google Scholar]
- 63.Margolis SA, Levenson M. Certification by the Karl Fischer method of the water content in SRM 2890, Water Saturated 1-Octanol, and the analysis of associated interlaboratory bias in the measurement process. Fresenius J Anal Chem. 2000;367:1–7. doi: 10.1007/s002160051589. [DOI] [PubMed] [Google Scholar]
- 64.Anderson RL, Davis S. An organic phosphorus assay which avoids the use of hazardous perchloric acid. Clin Chim Acta. 1982;121:111–116. doi: 10.1016/0009-8981(82)90216-9. [DOI] [PubMed] [Google Scholar]
- 65.Silvius JR. Thermotropic phase transitions of pure lipids in model membranes and their modifications by membrane proteins. In: Jost PC, Griffith OH, editors. Lipid-Protein Interactions. Wiley and Sons; New York: 1982. pp. 239–281. [Google Scholar]
- 66.Poste G. The interaction of lipid vesicles (liposomes) with cultured cells and their use as carriers for drugs and macromolecules. In: Gregoriadis G, Allison AC, editors. Liposomes in Biological Systems. Wiley; New York: 1980. pp. 101–152. [Google Scholar]
- 67.Linseisen FM, Hetzer M, Brumm T, Bayerl TM. Differences in the physical properties of lipid monolayers and bilayers on a spherical solid support. Biophys J. 1997;72:1659–1667. doi: 10.1016/S0006-3495(97)78811-8. [DOI] [PMC free article] [PubMed] [Google Scholar]
- 68.Mouritsen OG, Jorgensen K. Micro-, nano- and meso-scale heterogeneity of lipid bilayers and its influence on macroscopic membrane properties. Mol Membr Biol. 1995;12:15–20. doi: 10.3109/09687689509038490. [DOI] [PubMed] [Google Scholar]
- 69.Corvera E, Mouritsen OG, Singer MA, Zuckermann MJ. The permeability and the effect of acyl-chain length for phospholipid bilayers containing cholesterol: Theory and experiment. Biochim Biophys Acta. 1992;1107:261–270. doi: 10.1016/0005-2736(92)90413-g. [DOI] [PubMed] [Google Scholar]
- 70.Sabra MC, Jorgensen K, Mouritsen OG. Lindane suppresses the lipid-bilayer permeability in the main transition region. Biochim Biophys Acta. 1996;1282:85–92. doi: 10.1016/0005-2736(96)00042-9. [DOI] [PubMed] [Google Scholar]
- 71.Trandum C, Westh P, Jorgensen K, Mouritsen OG. A thermodynamic study of the effects of cholesterol on the interaction between liposomes and ethanol. Biophys J. 2000;78:2486–2492. doi: 10.1016/S0006-3495(00)76793-2. [DOI] [PMC free article] [PubMed] [Google Scholar]
- 72.Trandum C, Westh P, Mouritsen OG, Jorgenson K. Association of ethanol with lipid membranes containing cholesterol sphingomyelin and ganglioside: a titration calorimetry study. Biochim Biophys Acta. 1999;1420:179–188. doi: 10.1016/s0005-2736(99)00092-9. [DOI] [PubMed] [Google Scholar]
- 73.Trandum Ch, Westh P, Jorgensen K, Mouritsen OG. A calorimetric investigation of the interaction of short chain alcohols with unilamellar DMPC liposomes. J Phys Chem B. 1999;103:4751–4756. [Google Scholar]
- 74.Serra MV, Kamp D, Haest CW. Pathways for flip-flop of mono- and di-anionic phospholipids in the erythrocyte membrane. Biochim Biophys Acta. 1996;1282:263–273. doi: 10.1016/0005-2736(96)00066-1. [DOI] [PubMed] [Google Scholar]
- 75.Middelkoop E, Lubin BH, Op den Kamp JA, Roelofsen B. Flip-flop rates of individual molecular species of phosphatidylcholine in the human red cell membrane. Biochim Biophys Acta. 1986;855:421–424. doi: 10.1016/0005-2736(86)90087-8. [DOI] [PubMed] [Google Scholar]
- 76.Pohorille A, Wilson MA. Excess chemical potential of small solutes across water-membrane and water-hexane interfaces. J Chem Phys. 1996;104:3760–3773. doi: 10.1063/1.471030. [DOI] [PubMed] [Google Scholar]
- 77.Kucerka N, Kiselev MA, Balgavy P. Determination of bilayer thickness and lipid surface area in unilamellar dimyristoylphosphatidylcholine vesicles from small-angle neutron scattering curves: a comparison of evaluation methods. Eur Biophys J. 2004;33:328–334. doi: 10.1007/s00249-003-0349-0. [DOI] [PubMed] [Google Scholar]
- 78.Hauser H, Pascher I, Pearson RH, Sundell S. Preferred conformation and molecular packing of phosphatidylethanolamine and phosphatidylcholine. Biochim Biophys Acta. 1981;650:21–51. doi: 10.1016/0304-4157(81)90007-1. [DOI] [PubMed] [Google Scholar]
- 79.Wasserman SR, Whitesides GM, Tidswell IM, Ocko BM, Pershan PS, Axe JD. The structure of self-assembled monolayers of alkylsiloxanes on silicon: A comparison of results from ellipsometry and low-angle X-ray reflectivity. J Am Chem Soc. 1989;111:5852–5861. [Google Scholar]
- 80.Angst DL. Moisture absorption characteristics of organosiloxane self-assembled monolayers. Langmuir. 1991;7:2236–2242. [Google Scholar]
- 81.Collander R. The partition of organic compounds between higher alcohols and water. Acta Chem Scand. 1951;5:774–780. [Google Scholar]
- 82.Vaes WHJ, Ramos EU, Hamwijk C, van Holsteijn I, Blaauboer BJ, Seinen W, Verhaar HJM, Hermens JLM. Solid phase microextraction as a tool to determine membrane/water partition coefficients and bioavailable concentrations in in vitro systems. Chem Res Toxicol. 1997;10:1067–1072. doi: 10.1021/tx970109t. [DOI] [PubMed] [Google Scholar]
- 83.Wohnsland F, Faller B. High-throughput permeability pH profile and pigh-throughput alkane/water log P with artificial membranes. J Med Chem. 2001;44:923–930. doi: 10.1021/jm001020e. [DOI] [PubMed] [Google Scholar]
- 84.Abraham MH, Chadha HS, Whiting GS, Mitchell RC. Hydrogen bonding. 32. An analysis of water-octanol and water-alkane partitioning and the delta log P parameter of seiler. J Pharm Sci. 1994;83:1085–1100. doi: 10.1002/jps.2600830806. [DOI] [PubMed] [Google Scholar]
- 85.Caron G, Ermondi G. Calculating virtual log P in the alkane/water system (log PNalk) and its derived parameters Δlog PNoct-alk and log DpHalk. J Med Chem. 2005;48:3269–3279. doi: 10.1021/jm048980b. [DOI] [PubMed] [Google Scholar]
- 86.Poulin P, Theil FP. Prediction of pharmacokinetics prior to in vivo studies. 1. Mechanism-based prediction of volume of distribution. J Pharm Sci. 2002;91:129–156. doi: 10.1002/jps.10005. [DOI] [PubMed] [Google Scholar]
- 87.Dulfer WJ, Govers HAJ. Membrane water partitioning of polychlorinated biphenyls in small unilamellar vesicles of four saturated phosphatidylcholines. Environ Sci Technol. 1995;29:2548–2554. doi: 10.1021/es00010a014. [DOI] [PubMed] [Google Scholar]