Abstract
Structure-based predictions of binding affinities of ligands binding to proteins by coordination bonds with transition metals, covalent bonds, and bonds involving charge re-distributions are hindered by the absence of proper force fields. This shortcoming affects all methods which use force-field-based molecular simulation data on complex formation for affinity predictions. One of the most frequently used methods in this category is the Linear Response (LR) approach of Åquist, correlating binding affinities with van der Waals and electrostatic energies, as extended by Jorgensen’s inclusion of solvent-accessible surface areas. All these terms represent the differences, upon binding, in the ensemble averages of pertinent quantities, obtained from molecular dynamics (MD) or Monte Carlo simulations of the complex and of single components. Here we report a modification of the LR approach by: (1) the replacement of the two energy terms through the single-point QM/MM energy of the time-averaged complex structure from an MD simulation; and (2) a rigorous consideration of multiple modes (mm) of binding. The first extension alleviates the force-field related problems, while the second extension deals with the ligands exhibiting large-scale motions in the course of an MD simulation. The second modification results in the correlation equation that is nonlinear in optimized coefficients, but does not lead to an increase in the number of optimized coefficients. The application of the resulting mm QM/MM LR approach to the inhibition of zinc-dependent gelatinase B (matrix metalloproteinase 9) by 28 hydroxamate ligands indicates a significant improvement of descriptive and predictive abilities.
Keywords: affinity, binding energy, enzyme inhibition, ligand-macromolecule binding, matrix metalloproteinases, metalloproteins, Linear Response approach, molecular dynamics, prediction, QM/MM
Introduction
The continuously growing number of protein structures and protein structural models, resulting from the knowledge of genomes, represents enormous promise for development of drugs and other bioactive compounds. Full utilization of the potential requires an armory of computational methods for prediction of ligand-protein binding affinities. Structure-based prediction methods with various levels of accuracy and speed are available today: fast docking and scoring approaches [1, 2] for reduction of vast chemical libraries to several hundreds of probable binders, the second-pass methods selecting a dozen or so compounds with a high probability of success, and the most sophisticated methods like Free Energy Perturbation [3] and Thermodynamic Integration [4], which can e.g. discern the affinity of closely related analogs.
In recent years, most developments have been seen in the second category of methods, which are based on decomposition of the binding free energy. The methods usually use conformational sampling of the ligand-receptor complex and of free reactants by Molecular Dynamics (MD) or Monte Carlo (MC) simulations, although the use of multiple structures corresponding to energy minima [5] or single optimized structures to speed up the calculations have also been advocated [6, 7]. Other differences appear in the following areas: the treatment of solvent (explicit [8], continuum [6, 9], or in vacuo [6, 10]), estimation of the electrostatic component of solvation energies (linearized Poisson-Boltzman equation [5, 6, 10–13], the generalized Born model [9, 12, 14], or the pair-wise Coulomb relations in explicit solvent [15]), and the parameter optimization (used [16] or not used [5, 13]).
We prefer to use Linear Response (LR) method [8] and, especially, its extended variant [17], because they contain 3–5 adjustable coefficients, which, in our opinion, account for the differences between the simulated and experimental systems better than other approaches. The LR decomposition of the free energy of binding, ΔGb, reads:
| (1) |
where K is the association constant, R is the universal gas constant, T is temperature, E denotes the energy (van der Waals energy and electrostatic energy, scaled by separate coefficients α and β [8, 17] or overall QM/MM energy scaled by α [18]), PSA and NPSA represent polar and nonpolar solvent-accessible surface areas [17], and γ, δ, and κ are adjustable coefficients. The angle brackets denote the ensemble averages and Δ indicates the difference between the ensemble averages in the bound and free ligand states. The ensemble averages of the energies and the surface areas can be replaced by the respective quantities calculated for the time-averaged structures [10].
The MD simulations are often trapped in local minima close to the starting conformations. To obtain a better sampling of the conformational space, strategies as replica exchange MD [19] or local replica exchange MD [20] were devised. Alternatively, predominant states can be analyzed as in the approach called Mining Minima [21]. Some ligands exhibit extensive movements and need much longer MD simulations to equilibrate than the rest of compounds. To reduce the cost, these ligands can be included in the LR correlations by treating them as assuming several binding modes, as described in our multi-mode (mm) approach [22].
A natural question emerges, whether the QM/MM energies can also be successfully used in the mm approach. To examine this possibility, the mm QM/MM LR method was applied to a set of 28 diverse hydroxamate inhibitors [23] of gelatinase B (MMP-9), a member of the family of matrix metalloproteinases (MMPs). MMPs participate in remodeling of extracellular matrix and are implicated in cancer, metastases, arthritis, and other diseases [24].
Background and Methods
To provide the theoretical background for the correlation equation underlying the mm QM/MM LR approach, the description of binding equilibria as well as the replacement of the ensemble averages of van der Waals and electrostatic energies are briefly reviewed. The computational protocol is described.
Multi-Mode Binding Equilibria
Reversible 1:1 binding of the i-th ligand Li in m mutually exclusive orientations or conformations (modes) to the receptor site R can be schematically written as
| (2). |
Individual equilibria are characterized by the partial association constants Kij. The ligand is present as a single species in the receptor surroundings. The apparent association constant Ki for this process is, on the concentration basis, defined as
| (3). |
Eq. (3) is in accordance with the Mining Minima approach to calculation of free energies [5], as well as with other published analyses of formally analogous situations: the rigorous statistical thermodynamic description [25] and equilibrium treatment [26, 27] of the multi-mode interactions of ligands with proteins, and kinetic analyses of reversible uni-molecular reactions leading to different products [28] or isomers [29].
Each partial association constant Kij can be expressed using Eq. (1), with the same values of the adjustable coefficients α, β, γ, and κ. The apparent association constant Ki can then be correlated with the simulation results by a combination of Eq. (1), now with the subscript ij representing the j-th binding mode of the i-th compound), and Eq. (3):
| (4) |
In addition to predicting the binding affinity, Eq. (4) can also select the most dominant bound conformation(s) of the ligand out of the set of hypothetical conformations. Individual exponentials in Eq. (4) represent the partial association constants Kij of binding modes as defined in Eq. (2) and Eq. (3). After the coefficients in Eq. (4) are optimized, the Boltzmann probability of each bound conformation is easily calculated as Kij/ΣKij.
The QM/MM Binding Energy
The use of molecular mechanics (MM) for the description of the ligand-receptor interactions requires similarity of chemical bonds in free and bound systems. Once the bonds change upon binding, most commonly when covalent or coordination bonds are formed or even when polarizability causes a different charge distribution for ligand-receptor complex, the use of standard force fields becomes problematic. Two possible solutions to this problem are represented by the development of more sophisticated force fields or by the use of quantum mechanical (QM) methods. For large ligand-receptor systems, combination QM/MM methods are frequently used, with the QM domain including the changing bonds and the MM domain covering the rest of the receptor molecules.
The use of the time-averaged structures in place of the ensemble averages in the LR equations makes the use of QM/MM methods straightforward: the energy of the relaxed time-averaged structures can be used instead of the van der Waals and electrostatic energies in Eq. (1). We have recently shown that this modification of the LR approach with electrostatic and van der Waals energies improves both descriptive and predictive abilities of the correlation [18].
Computational Protocol
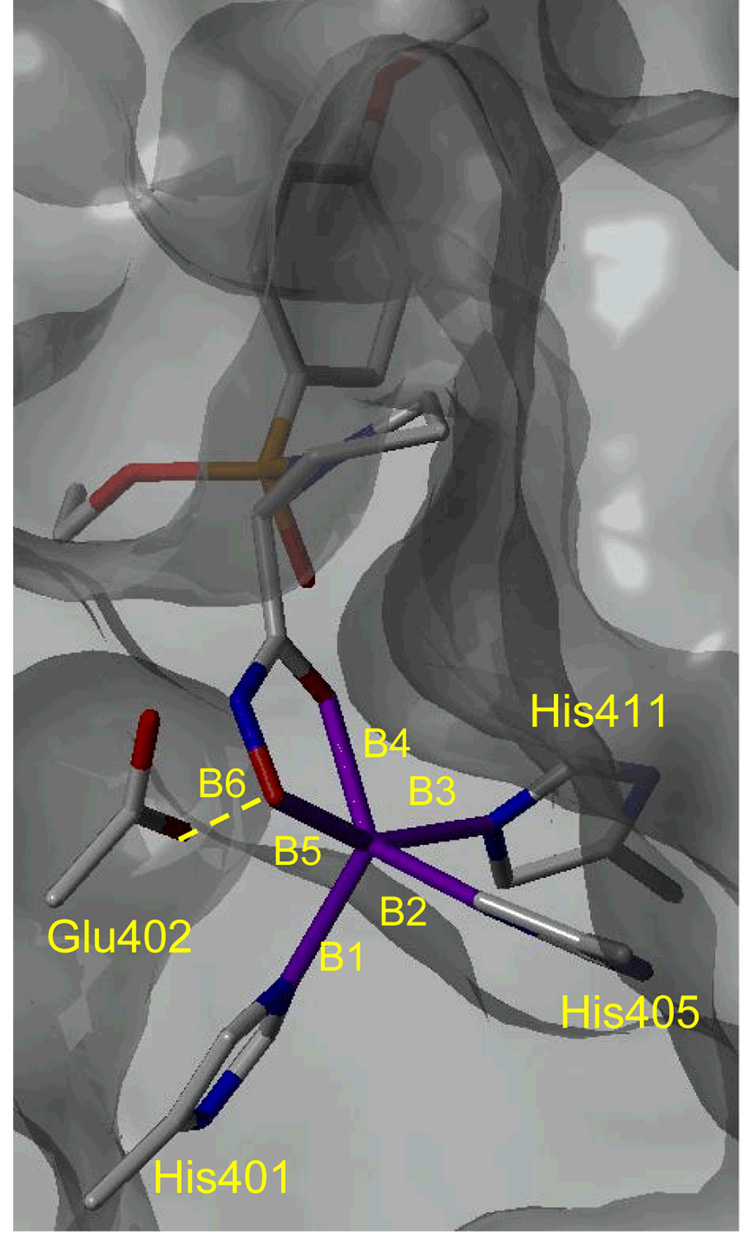
The computation details were described previously [18, 22]. Briefly, the protocol consisted of: (1) FlexX docking of the ligands to the processed structure of MMP-9 taken from the Protein Data Bank [30] (file 1GKC [31]), with the pose selected primarily on the basis of acceptable distances between the catalytic zinc and the hydroxamate atoms; (2) QM/MM minimization of the selected poses, with the QM region including the ligand, tha catalytic zinc, Glu402 and the His triad as shown in Figure 1; (3) 200-ps MD simulation of the complex with the zinc bonds restricted; and (4) calculation of single-point QM/MM energies of the complex in the time-averaged structures from the simulations.
Figure 1.
The average lengths and standard deviations (Å) of the bonds (in magenta) between Zn and coordinating atoms: B1=2.120±0.022, B2=2.156±0.011, B3=2.253±0.016, B4=2.029±0.018, and B5=2.089±0.012 for all studied compounds. The hydrogen-bond lengths between Glu402 and O1 of the hydroxamate group were characterized by B6=2.604±0.065. The average bond angles O1-Zn-N in His401, His405 and His411 are 121.77±14.81°, 135.58±8.95°, and 82.06±1.65°, respectively. The average bond angles O2-Zn-N in the same order are 101.55±1.89°, 95.07±2.13°, and 155.23±2.98°, respectively. The average bond angle of O2-Zn-O1 is 79.66±0.61°. The smallest inhibitor 28 (Table S1, supplementary information) shown in the time-averaged position after 200-ps MD simulations. The surface of the MMP-9 is shown in gray.
The van der Waals, electrostatic energies, and surface area terms were calculated using the corresponding time-averaged structures of the complex and the free ligand for eight 25-ps intervals of the 200-ps MD simulations. The time-averaged structure for each interval represented a binding mode: 0–25 ps - mode 1, 25–50 ps - mode 2, … 175–200 ps - mode 8. The structures of the compounds and inhibitory activities, both experimental [23] and calculated by individual equations, are given in supporting information (Table S1).
Results and Discussion
The QM/MM optimization of the best FlexX poses showed that the hydroxamate groups of all 28 derivatives created, along with the histidine triad of MMP-9, rather similar trigonal bipyramidal coordination spheres around the catalytic zinc [18] (Figure 1). Glu402 formed the hydrogen bonds with the nonionized hydroxyl group of the hydroxamates. The QM/MM approach, in general, handles the zinc-ligand charge transfer, bond length changes, polarization, and ionization of the ligands upon binding to zinc better than advanced force fields.
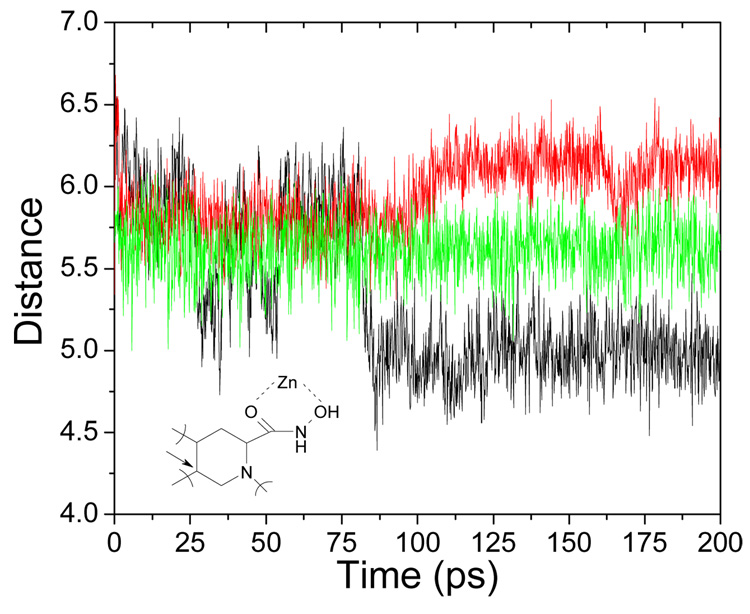
The ligand behavior differed more in the 200-ps simulations following 100-ps equilibrations with harmonically restrained zinc-binding groups (Figure 2). Most ligands were well equilibrated (as ligand 27, structure in Table S1 in supplementary information), but some ligands showed large-scale motions (e.g. ligands 22 and especially 7). The multi-mode approach was implemented to account for the instabilities. The LR terms in Eq. (1) and Eq. (4), which were calculated for the minimized and time-averaged structures from the MD data (supplementary information, Tables S2 and S3, respectively) did not exhibit colinearities: the highest mutual correlation coefficient was r2 = 0.193. As the last parameter, the single-point QM/MM energies for the time-averaged structures resulting from the 200-ps MD simulations were calculated. In all studied cases, the used time-averaged structures were close to at least one structure recorded in the simulation.
Figure 2.
The distance (Å) between Zn and the carbon atom indicated by the arrow for compounds 7 (black), 22 (red), and 27 (green) throughout the MD simulation. Structures of studied compounds are given in Table S1 in supplementary information.
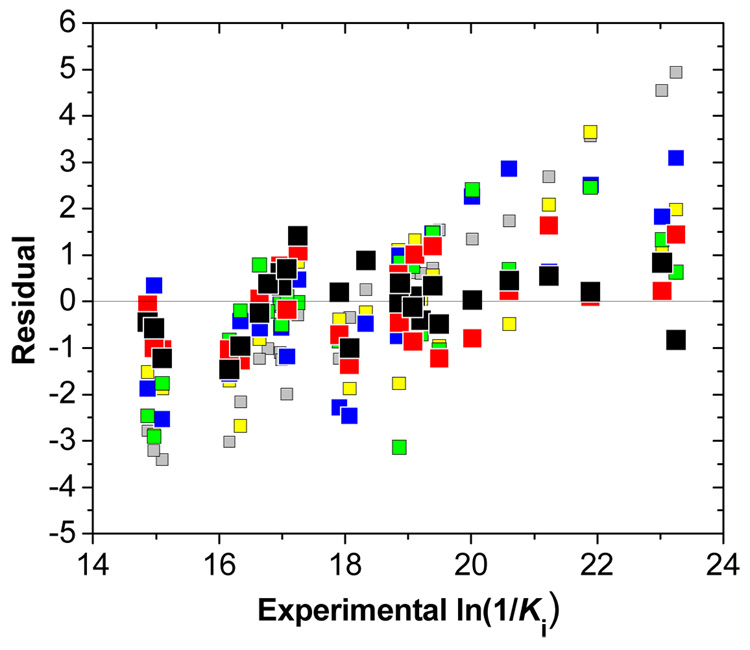
All statistically significant results of the fits of Eq. (1) and Eq. (4) to the data for the one-mode and multi-mode LR approaches with classical and QM/MM energy parameters are summarized in Table 1. In all cases, the dependent variable was ln (1/Ki) because the reported Ki values [23] are the inhibition constants, not the association constants. The quality of individual fits can be assessed using the statistical indices in Table 1 and also the plot of residuals vs. the experimental activities for individual equations (Figure 3). The FlexX docking, while providing good starting geometries, did not allow the FlexX scoring function to discriminate between individual binding affinities. For both MM and QM/MM minimizations (Eq. (1), lines 2 and 3 in Table 1), the QM/MM, van der Waals, and electrostatic terms were statistically not significant and the coefficient errors were higher than the optimized coefficient values. Moreover, the coefficients for the QM/MM and van der Waals terms had negative values. The optimized structures, regardless whether obtained by MM or QM/MM minimization, probably did not represent well the bound conformations and the results were discouraging (r2 = 0.508 and 0.514), in contrast to other reports [7].
Table 1.
Optimized coefficients and statistical indices of correlation equations.
| Eq. | Sampling | aα × 10−2 | bβ × 10−2 | γ × 10−2 | δ × 10−2 | κ | SD | r2 | RMSE | |
|---|---|---|---|---|---|---|---|---|---|---|
| LOOc | LSOd | |||||||||
| - | FlexXe | 0.161 ± 0.146 | NAf | NA | NA | −13.43 ± 4.598 | 2.224 | 0.044 | 2.278 | 2.294 |
| 1 | MM Minimization | NSg | NS | 3.841 ± 1.854 | 1.450 ± 0.377 | −9.582 ± 2.297 | 1.627 | 0.508 | 1.727 | 1.733 |
| 1 | QM/MM Minimization | NS | NA | 3.815 ± 1.573 | 2.380 ± 0.634 | −7.552 ± 2.236 | 1.618 | 0.514 | 1.712 | 1.795 |
| 1 | MD+QM/MM (200 ps)h | NS | NS/NA | NS | 1.824 ± 0.299 | −13.59 ± 0.840 | 1.458 | 0.589 | 1.539 | 1.506 |
| 4i | MD (8×25 ps) | 1.142 ± 0.784 | 0.721 ± 0.642 | 2.124 ± 1.015 | 1.564 ± 0.235 | −6.275 ± 1.244 | 0.956 | 0.844 | 1.031 | 1.075 |
| 4j | MD+QM/MM (8×25 ps) | 0.389 ± 0.076 | NA | 3.161 ± 0.682 | 1.492 ± 0.172 | −6.401 ± 0.945 | 0.730 | 0.905 | 0.817 | 0.827 |
Characterizes electrostatic energy [Eq. (1)].
Leave-one-out cross-validation.
Leave-several-out cross-validation: random selection of 6-member test set, repeated 200 times.
The correlation between ln(1/Ki) and the FlexX scores, with the slope α and the intercept κ.
NA – not applicable.
NS – non-significant coefficient.
These results are valid for both MD and QM/MM energies (LR and QM/MM LR approaches), because none of the energy terms was significant.
The mm LR approach.
The mm QM/MM LR approach.
Figure 3.
Plot of residuals (experimental minus calculated activities) obtained from FlexX docking (grey), MM minimization (yellow), QM minimization (blue), LR and QM/MM LR approach (green), mm LR approach (red), and mm QM/MM LR approach (black) vs experimental activity (Ki is in M). The coefficients and statistical indices for individual approaches are summarized in this order in Table 1.
Both MD and MD+QM/MM one-mode treatments resulted in the same equation (line 4 in Table 1), because all the energy-related coefficients were insignificant. The coefficient errors for the electrostatics and PSA terms were almost equal to the optimized coefficient values. The sign of the coefficient for the van der Waals term was negative and the error was higher than the coefficient. Inclusion of the statistically insignificant terms led to negligible or moderate improvements in the correlations: for MM minimization, r2=0.516; for QM/MM minimization, r2=0.520; and for the one-mode treatment, r2 = 0.625 (MD) and r2 = 0.630 (MD + QM/MM). Conformational sampling using 200-ps MD simulations did not improve the statistics significantly (r2 = 0.589). We showed previously [18, 32] that these correlations can be amended by a careful selection of the used intervals of MD simulations.
The interval selection is automated in the multi-mode approaches resulting in Eq. (4), which provide a real breakthrough in the performance, explaining 84% of the variance with the MD energy parameters, and 90% with the QM/MM parameter (Table 1, the last two lines). The improvement caused by the inclusion of the QM/MM energies into the multi-mode LR approach is significant and results in the best description of the data. All three terms included in Eq. (4) for the mm QM/MM LR approach exhibited significant contributions to the correlation. The residuals (Figure 3) are the lowest among the used approaches, and seem to be randomly distributed.
The robustness of the regression Eq. (1) and Eq. (4) and their predictive abilities were probed by leave-one-out (LOO) and leave-several-out (LSO) cross-validation procedures. The latter approach, using a random selection of a 6-member test set that was repeated 200 times, provided a thorough evaluation. The predictivity of the mm QM/MM LR approach is better than with other approaches (Table 1, the last line). The RMSE values using LOO (0.817) and LSO (0.827) cross-validations were comparable to the SD value (0.730), which is equivalent to the RMSE value without any compound omission.
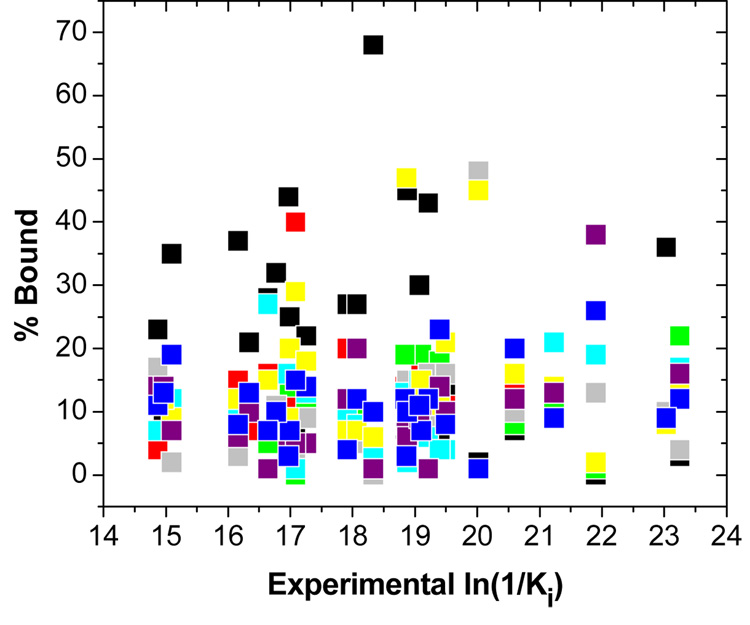
The prevalences of individual simulation intervals representing the binding modes for the studied ligands can be calculated as Kij/ΣKij, where the partial association constants Kij, as defined in Eq. (2) and Eq. (3), correspond to individual exponentials in Eq. (4). The prevalences are summarized in Table S4 in the supporting information, and plotted against inhibitory activities in Figure 4. Apparently, the number of binding modes is not related to the activity, contrary to the notion that weak binders have a frustrated energy landscapes leading to multiple binding modes [33]. It should be noted, however, that the least active compound 28 (structure in Table S1 in the supporting information) does not have a clearly dominating mode, and all the modes exhibit about equal (10–14%) contributions to the binding. All but one compounds have the major binding mode representing less than 50% of bound molecules. In 60% of the cases, mode 1 is the dominant binding mode. Major outliers in one-mode treatment (compounds 2, 3, 6, 15, 21, 22, 25, and 28, Table S1 in the supporting information) are predicted accurately by the multi-mode treatment.
Figure 4.
Plot of prevalencies of individual modes vs experimental ln(1/Ki) values, calculated from the best mm QM/MM LR correlation (the last line in Table 1). Individual modes m1 - m8, representing time-averaged structures for consecutive 25-ps MD simulations, are shown in black, red, green, gray, cyan, yellow, purple, and blue colors, respectively.
The presented mm QM/MM LR approach, combining MD simulations and QM/MM methods, exhibits very good descriptive and predictive abilities for the studied inhibition of MMP-9 by hydroxamate ligands. If further studies confirm the applicability of the approach, it can become a useful addition to the armory of the approaches to the structure-based prediction of binding affinities. The two novel features of the mm QM/MM LR approach become especially handy in the following situations. The multi-mode treatment automates the selection of suitable simulation intervals for compounds undergoing significant large-scale movements. The QM/MM energy provides superior descriptions of the binding energies if the ligand-macromolecule complex is formed by coordination, covalent or polarizable bonds rather than by standard weak interactions.
Supplementary Material
Acknowledgment
This work was supported in part by the NIH NCRR grants 1P20RR15566 and 1P20RR16471, as well as by the access to resources of the Computational Chemistry and Biology Network and the Center for High Performance Computing, both at the North Dakota State University.
Footnotes
Dedicated to Yvonne C. Martin on the occasion of her round birthday and retirement
References
- 1.Muegge I, Rarey M. Rev Comput Chem. 2001;17:1. [Google Scholar]
- 2.Leach AR, Shoichet BK, Peishoff CE. J Med Chem. 2006;49:5851. doi: 10.1021/jm060999m. [DOI] [PubMed] [Google Scholar]
- 3.Kollman P. Chem Rev. 1993;93:2395. [Google Scholar]
- 4.van Gunsteren WF. In: Computer Simulation of Biomolecular Systems. van Gunsteren, Weiner PK, editors. Leiden: Escom; 1989. pp. 27–59. [Google Scholar]
- 5.Chang CE, Gilson MK. J Am Chem Soc. 2004;126:13156. doi: 10.1021/ja047115d. [DOI] [PubMed] [Google Scholar]
- 6.Huang D, Caflisch A. J Med Chem. 2004;47:5791. doi: 10.1021/jm049726m. [DOI] [PubMed] [Google Scholar]
- 7.Kuhn B, Gerber P, Schulz-Gasch T, Stahl M. J Med Chem. 2005;48:4040. doi: 10.1021/jm049081q. [DOI] [PubMed] [Google Scholar]
- 8.Åqvist J, Medina C, Samuelsson JE. Protein Eng. 1994;7:385. doi: 10.1093/protein/7.3.385. [DOI] [PubMed] [Google Scholar]
- 9.Zhou R, Friesner RA, Ghosh A, Rizzo RC, Jorgensen WL, Levy RM. J Phys Chem B. 2001;105:10388. [Google Scholar]
- 10.Zoete V, Michielin O, Karplus M. J Comput Aid Mol Des. 2003;17:861. doi: 10.1023/b:jcam.0000021882.99270.4c. [DOI] [PubMed] [Google Scholar]
- 11.Kollman PA, Massova I, Reyes C, Kuhn B, Huo S, Chong L, Lee M, Lee T, Duan Y, Wang W, Donini O, Cieplak P, Srinivasan J, Case DA, Cheatham TE. Acc Chem Res. 2000;33:889. doi: 10.1021/ar000033j. [DOI] [PubMed] [Google Scholar]
- 12.Srinivasan J, Cheatham TE, III, Cieplak P, Kollman PA, Case DA. J Am Chem Soc. 1998;120:9401. [Google Scholar]
- 13.Kuhn B, Kollman PA. J Med Chem. 2000;43:3786. doi: 10.1021/jm000241h. [DOI] [PubMed] [Google Scholar]
- 14.Rizzo RC, Toba S, Kuntz ID. J Med Chem. 2004;47:3065. doi: 10.1021/jm030570k. [DOI] [PubMed] [Google Scholar]
- 15.Smith MBK, Hose BM, Hawkins A, Lipchock J, Farnsworth DW, Rizzo RC, Tirado RJ, Arnold E, Zhang W, Hughes SH, Jorgensen WL, Michejda CJ, Smith RH. J Med Chem. 2003;46:1940. doi: 10.1021/jm020271f. [DOI] [PubMed] [Google Scholar]
- 16.Tounge BA, Reynolds CH. J Med Chem. 2003;46:2074. doi: 10.1021/jm020513b. [DOI] [PubMed] [Google Scholar]
- 17.Carlson HA, Jorgensen WL. J Phys Chem. 1995;99:10667. [Google Scholar]
- 18.Khandelwal A, Lukacova V, Comez D, Kroll DM, Raha S, Balaz S. J Med Chem. 2005;48:5437. doi: 10.1021/jm049050v. [DOI] [PMC free article] [PubMed] [Google Scholar]
- 19.Swendsen RH, Wang JS. Phys Rev Lett. 1986;57:2607. doi: 10.1103/PhysRevLett.57.2607. [DOI] [PubMed] [Google Scholar]
- 20.Cheng X, Cui G, Hornak V, Simmerling C. J Phys Chem B. 2005;109:8220. doi: 10.1021/jp045437y. [DOI] [PMC free article] [PubMed] [Google Scholar]
- 21.Head MS, Given JA, Gilson MK. J Phys Chem A. 1997;101:1609. [Google Scholar]
- 22.Khandelwal A, Lukacova V, Kroll DM, Raha S, Comez D, Balaz S. J Phys Chem A. 2005;109:6387. doi: 10.1021/jp051105x. [DOI] [PMC free article] [PubMed] [Google Scholar]
- 23.Sawa M, Kiyoi T, Kurokawa K, Kumihara H, Yamamoto M, Miyasaka T, Ito Y, Hirayama R, Inoue T, Kirii Y, Nishiwaki E, Ohmoto H, Maeda Y, Ishibushi E, Inoue Y, Yoshino K, Kondo H. J Med Chem. 2002;45:919. doi: 10.1021/jm0103211. [DOI] [PubMed] [Google Scholar]
- 24.Overall CM, Kleifeld O. Nat. Rev. Cancer. 2006;6:227. doi: 10.1038/nrc1821. [DOI] [PubMed] [Google Scholar]
- 25.Wang J, Szewczuk Z, Yue SY, Tsuda Y, Konishi Y, Purisima EO. J Mol Biol. 1995;253:473. doi: 10.1006/jmbi.1995.0567. [DOI] [PubMed] [Google Scholar]
- 26.Balaz S, Hornak V, Haluska L. Chemom Intell Lab Syst. 1994;24:185. [Google Scholar]
- 27.Hornak V, Balaz S, Schaper KJ, Seydel JK. Quant Struct Act Rel. 1998;17:427. [Google Scholar]
- 28.Jullien L, Proust A, LeMenn JC. J Chem Educ. 1998;75:194. [Google Scholar]
- 29.Smith WR, Missen RW. Chemical Reaction Equilibrium Analysis: Theory and Algorithms. New York: John Wiley and Sons; 1982. [Google Scholar]
- 30.Berman HM, Westbrook J, Feng Z, Gilliland G, Bhat TN, Weissig H, Shindyalov IN, Bourne PE. Nucleic Acids Res. 2000;28:235. doi: 10.1093/nar/28.1.235. [DOI] [PMC free article] [PubMed] [Google Scholar]
- 31.Rowsell S, Hawtin P, Minshull CA, Jepson H, Brockbank SMV, Barratt DG, Slater AM, McPheat WL, Waterson D, Henney AM, Pauptit RA. J Mol Biol. 2002;319:173. doi: 10.1016/S0022-2836(02)00262-0. [DOI] [PubMed] [Google Scholar]
- 32.Khandelwal A, Lukacova V, Kroll DM, Comez D, Raha S, Balaz S. QSAR Comb Sci. 2004;23:754. [Google Scholar]
- 33.Rejto PA, Verkhivker GM. Proc Natl Acad Sci. 1996;93:8945. doi: 10.1073/pnas.93.17.8945. [DOI] [PMC free article] [PubMed] [Google Scholar]
Associated Data
This section collects any data citations, data availability statements, or supplementary materials included in this article.


