


Abstract
Nucleic acid-binding proteins are involved in a great number of cellular processes. Understanding the mechanisms underlying these proteins first requires the identification of specific residues involved in nucleic acid binding. Prediction of NA-binding residues can provide practical assistance in the functional annotation of NA-binding proteins. Predictions can also be used to expedite mutagenesis experiments, guiding researchers to the correct binding residues in these proteins. Here, we present a method for the identification of amino acid residues involved in DNA- and RNA-binding using sequence-based attributes. The method used in this work combines the C4.5 algorithm with bootstrap aggregation and cost-sensitive learning. Our DNA-binding model achieved 79.1% accuracy, while the RNA-binding model reached an accuracy of 73.2%. The NAPS web server is freely available at http://proteomics.bioengr.uic.edu/NAPS.
INTRODUCTION
Nucleic acid-binding (NA-binding) proteins are involved in a great number of cellular processes. Protein–DNA interactions are an integral part of the gene regulation process and are also responsible for DNA repair. Protein–RNA interactions are directly involved with activities such as protein synthesis, the regulation of gene expression, and mRNA processing. Both DNA- and RNA-binding proteins are essential to the replication of specific types of viruses. Understanding the mechanisms underlying these proteins first requires the identification of specific residues involved in nucleic acid binding. Prediction of NA-binding residues can provide practical assistance in the functional annotation of NA-binding proteins. Predictions can also be used to expedite mutagenesis experiments, guiding researchers to the correct binding residues in these proteins. Identifying such residues is a complex and difficult problem. The characteristic traits of a residue, which enable its binding, are largely unknown. Whether or not certain characteristics of its neighbors affect a residue’s binding capability is also poorly understood, further complicating the issue. For these reasons machine learning has often been employed in an attempt to discover precisely which residues confer binding functionality.
NA-binding proteins almost always contain a smaller number of binding than non-binding residues. This means that any residue-level data set calculated from these proteins will be unbalanced in terms of these two classes, and thus prediction results will be unbalanced in terms of sensitivity and specificity due to degeneracy (1), or the tendency during prediction for a classifier to assign examples to the most common class. For instance, if binding residues made up the positive class in a training set and non-binding residues comprised the negative class, validation results would reveal much lower sensitivity than specificity, indicating that less true positive examples had been found. To get around this problem, many in the past have removed a number of non-binding residues from the data set in order to achieve a class balance. However, balancing a training set would seem to remove important information about the non-binding class and prevent the classifier from developing a clear distinction between the two types of examples, and this has in fact been shown to result in a less robust model and to cause poor test performance (1,2). Therefore, results using models built with balanced training sets may not actually provide reliable results. Ideally, we would like to provide machine learning classifiers with as much of the data set as possible in order to increase accuracy, while avoiding the problem of degeneracy. One way to do this is to force the developed classifier to apply a weight to the examples in the underrepresented class. This method, called cost-sensitive learning or costing, has been used in previous research to improve prediction. Sorzano et al. (3) used a Naïve Bayes algorithm to improve recognition of particles in images from cryo-electron microscopy experiments. Fan et al. (4) used their own version of costing to improve accuracy for intrusion detection systems. Stolfo et al. (5) employed a cost-based method to improve fraud detection in financial transactions.
The NAPS web server uses ensemble classifiers based on C4.5 (6), bootstrap aggregation (7) and a cost-sensitive learning algorithm (8) to predict binding residues within DNA- and RNA-binding proteins. Given a protein sequence, the server returns a list of binding and non-binding residues within the protein along with a score, which measures the confidence in the prediction. In comparison with five other commonly used algorithms for NA-binding residue prediction, we find that our ensemble method performs better for sequence-based prediction of both DNA and RNA binding. Additionally, we built our classifiers over several DNA- and RNA-binding protein data sets from previous works and found that we are able to improve on the previously published results.
METHOD
The NAPS server prediction models were created using the Malibu Machine Learning Workbench (http://proteomics.bioengr.uic.edu/malibu) (9), which was developed in-house. Malibu features a collection of algorithms primarily focused on supervised learning problems and is comprised of both third-party and native implementations. Our models were constructed using a modified version of the C4.5 decision tree algorithm. One of the biggest advantages of decision trees is the fact that, unlike some other classification algorithms such as support vector machines (SVM) and neural networks, the decision tree represents rules that can be understood such that some knowledge may be gleaned from the output. Other advantages of this algorithm include its ability to handle large data sets without requiring data preprocessing, to handle missing values, and to avoid overfitting. Additionally, if the attributes used in classification are discrete values, this method is very computationally efficient. One of the disadvantages of the decision tree algorithm is that small changes to the data set may result in a different feature being chosen at a certain node, which will affect the structure of the tree in subsequent nodes. By modifying the algorithm as described below, we aim to address this disadvantage.
C4.5 with bagging, or bootstrap aggregating (7), attempts to offset the instability of the C4.5 decision tree by building many different trees from the training data set using random sampling with replacement through a uniform probability distribution. The resulting classifier then uses majority voting to decide to which class the example belongs. When used in combination with an unstable classifier such as a decision tree, bagging can help to improve accuracy by reducing variance. For our models, out-of-bag partitioning was used for parameter selection and the accuracy metric was used to choose the best model. We ran 500 bagging iterations and used 10-fold, stratified cross-validation to test our models.
Our final models combined the bagging method (described above) with cost-sensitive learning. Cost-sensitive learning is useful for problems in which, as is the case with nucleic acid-binding residue prediction, one class is more highly represented than the other. The costing algorithm determines the importance of an example by considering its class label and performs an importance-weighted classification by applying weights to each class based on class distribution (8). The final classifier is created from an average of multiple rounds of rejection sampling. For each round, we constructed a model by first selecting residues in the data set. We investigated two types of residue selection, one in which a random sampling was taken from all proteins in the data set and the other in which the samples came only from within individual proteins. We found that both methods created very similar results. In the final analysis, we used the former.
We used 10-fold, stratified cross-validation over the training set for one run during both the selection and the validation cycles. We applied a weight, which was equal to the class distribution, to the positive class of the data set. Two hundred costing iterations were performed. Net accuracy was used to select the best parameters for the model. See Supplementary Data for details on the data sets used to build our models.
THE NAPS WEB SERVER
The NAPS web server (http://proteomics.bioengr.uic.edu/NAPS) takes a DNA- or RNA-binding protein sequence as input and returns a list of residues, the predicted class (binding or non-binding), and a score indicating the classifier’s confidence in the decision (Figure 1). The model classifier assigns a confidence score between 0 and 1 for each residue in the test protein. This score reflects the level of certainty in the assigned class with 0.5 as the threshold. Residues with a confidence score between 0 and 0.5 are classified as non-binding residues; those with a score between 0.5 and 1 are classified as binding residues (Figure 2). A table of calculated statistics, including the total number of residues binned by confidence score, the number of binding and non-binding residues in the protein, the percentage of each class, and the mean confidence value, is also returned. The server calculates a total of 301 sequence-based attributes for each residue in the test protein. We consider a ‘sequence-based attribute’ to be any residue feature that can be calculated without the use of a crystal structure (i.e. only protein sequence). The descriptors are described in more detail below.
Figure 1.

An example of the NAPS output.
Figure 2.
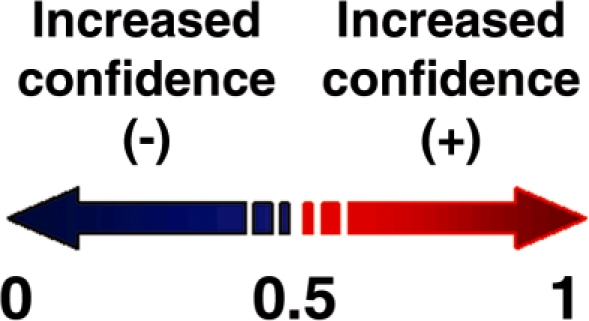
Illustration of the NAPS confidence score.
Calculated attributes
Residue ID
A 20D feature vector representing the 20 common amino acids is used to identify each residue, where a single non-zero entry indicates the current residue.
Residue charge
Since DNA molecules are negatively charged, positively charged, basic amino acid residues can play an important role in NA binding. Accordingly, we include a charge attribute for each residue. Arginine and lysine residues are assigned a charge of +1, histidines +0.5, and all others 0.
Measures of evolutionary conservation
In order to consider the level of evolutionary conservation of each residue and its sequence neighbors, we create a position-specific scoring matrix (PSSM) for each residue in the test protein. Along with the NCBI-NR90 database (10), which contains <90% sequence identity between any two proteins, PSI-BLAST (11) is used to create a matrix representing the distribution of all 20 amino acids at each position in the protein sequence. A 7-residue sliding window, which represents the distribution of amino acid residues at the positions occupied by three sequence neighbors on either side of the central residue, is subsequently created. This results in a 140-element feature vector for each residue. A similar 7-residue window is created using the BLOSUM62 matrix (12) in order to capture non-position-specific evolutionary conservation information for the sequence neighborhood of each residue, resulting in another 140-element feature vector.
EVALUATION OF NAPS MODELS
Comparisons with other algorithms
We evaluated the performance of the NAPS models against five other classification algorithms (SVM, Alternating Decision Tree, WillowBoost, C4.5 with Adaptive Boosting, and C4.5 with bootstrap aggregation). We built two models for each using sequence-based features: one for DNA-binding proteins and one for RNA-binding proteins. Supplementary Table 1 describes the results for this comparison and shows the performance of each algorithm in terms of accuracy, sensitivity, specificity, precision, Matthews correlation coefficient (MCC), and the area under the Receiver Operating Characteristic curve (AUC). The AUC provides a measure of a model's ability to separate positive and negative examples and is generated from a plot of the true positive rate versus the false positive rate for each example in the data set (see Supplementary Figures 1 and 2). A perfect model would have an AUC of 1, while a random model would have an AUC of 0.5.
Evaluation using previous data sets
In order to demonstrate the stability of our classifiers, we built models using previously compiled data sets for both DNA- and RNA-binding residue predictions. Supplementary Table 2 shows the comparisons between the original classifier and ours using two previously compiled DNA-binding protein data sets and one RNA-binding protein data set used in seven publications (10,13–18). The classifiers were created using 10-fold cross-validation for both selection and validation. For the costing algorithm, the weight assigned to each class was equal to the class distribution and 200 costing iterations were run. Net accuracy was used to find the best model. The prediction metrics from previous works shown are either those reported as the best results from the publications, or if the author’s intended best result is unclear, the results with the best accuracy or MCC.
Overall we found that, based on the metrics reported in these previous publications, we were able to improve on those results over each of three previously compiled data sets. First, we built our own classifier on the PDNA-62 data set, which was originally compiled by Selvaraj et al. (2) and used for binding residue prediction in three subsequent publications (10,14,17). Our model (C.45 with bagging and costing) achieved ∼78% accuracy, ∼80% sensitivity, ∼77% specificity, ∼86% AUC, and an MCC of 0.57, which is an improvement of +0.12 in the MCC for the best previous result (14). The second data set we tested was compiled and used by Ofran et al. (15) and consisted of 274 proteins. Our classifier reached ∼86% accuracy, ∼85% sensitivity, ∼88% specificity, ∼93% AUC, and an MCC of 0.725. The only directly comparable metric reported in this previous work is accuracy. While our accuracy is slightly lower than that reported by Ofran et al., we believe that our model actually offers a more reliable result. In their work, Ofran et al. used sequence to derive evolutionary profiles, sequence neighborhood, and predicted structural features. Their SVM classifier gave its best performance at 89% accuracy. However, their ‘positive accuracy’ (precision) and ‘positive coverage’ (sensitivity) were imbalanced. For example, at a sensitivity rate of ∼80% (the number of true positive examples correctly classified), the precision rate is quite low (∼55%), which indicates that the classifier has low confidence that the predicted positive examples are actually positive. Finally, we tested 109 RNA-binding protein chains originally collected by Terribilini et al. (16) and used in three works (13,16,18). Our model achieved ∼76% accuracy, ∼75% sensitivity, ∼77% specificity, ∼83% AUC, and an MCC of 0.523 over this set, which is an improvement of +0.07 in the MCC over the best result (18).
The sequence-based feature sets used in the previous publications varied between works, as did the type of classifier used for prediction and the type of validation performed. While comparisons of this type are not ideal, they do demonstrate that, toward the goal of distinguishing binding from non-binding residues, each of the classifiers we have built using C4.5 with bagging and costing provides consistent results in terms of overall accuracy when trained over various data sets, thus increasing our confidence in this ensemble method.
DISCUSSION AND FUTURE DIRECTIONS
Here we have presented a web utility for predicting binding residues in DNA- and RNA-binding proteins. Our method is built on C4.5 (6), bootstrap aggregation (7), and cost-sensitive learning (8) and is capable of producing balanced sensitivity, specificity, and precision with high accuracy when working with unbalanced data sets. We have compared these results with those from five commonly used algorithms and found that our classifiers achieve superior results. We also tested our method using previously published data sets and were able to show that our models outperform the previous results.
It is possible that a DNA-binding protein may contain residues which are predicted to be RNA-binding and vice versa. This can occur when the attributes calculated for the test protein residues during the prediction have very similar values to residues in both the DNA- and RNA-binding training sets. One issue that complicates NA-binding protein and residue prediction is the fact that certain proteins are known to bind both DNA and RNA molecules (19). The authors suggest paying close attention to the confidence values calculated during prediction as these will guide the user toward the most likely binding residues.
We have recently developed a sequence-based method for predicting DNA-binding proteins (20). This algorithm, along with another for RNA-binding protein prediction, will be added to the NAPS server. This prediction service will let the user first identify whether a sequence of interest belongs to a DNA- or RNA-binding protein before predicting binding residues within the protein. This feature will be useful in cases where the function of a test protein is unknown. Other future plans include adding the ability to handle structural features and the option to upload a PDB file for the calculation of these features (21,22). In addition, we plan to add knowledge-mining capability to our web server, which will allow users to analyze each rule for every residue within the model built by the classifier. This feature is intended to help to determine which attributes play an important role in identifying binding residues.
SUPPLEMENTARY DATA
Supplementary Data are available at NAR Online.
FUNDING
Funding for open access charge: University of Illinois at Chicago.
Conflict of interest statement. None declared.
Supplementary Material
REFERENCES
- 1.Olson DL. Data Mining and Knowledge Management. Vol. 3327/2005. Berlin/Heidelberg: Springer; 2005. Data set balancing; pp. 71–80. [Google Scholar]
- 2.Selvaraj S, Kono H, Sarai A. Specificity of protein-DNA recognition revealed by structure-based potentials: symmetric/asymmetric and cognate/non-cognate binding. J. Mol. Biol. 2002;322:907–915. doi: 10.1016/s0022-2836(02)00846-x. [DOI] [PubMed] [Google Scholar]
- 3.Sorzano CO, Recarte E, Alcorlo M, Bilbao-Castro JR, San-Martin C, Marabini R, Carazo JM. Automatic particle selection from electron micrographs using machine learning techniques. J. Struct. Biol. 2009;167:252–260. doi: 10.1016/j.jsb.2009.06.011. [DOI] [PMC free article] [PubMed] [Google Scholar]
- 4.Fan W, Lee W, Stolfo SJ, Miller M. Machine Learning: ECML 2000. Vol. 1810/2000. Berlin/Heidelberg: Springer; 2000. A multiple model cost-sensitive approach for intrusion detection; pp. 3–14. 11th European Conference on Machine Learning, Barcelona, Catalonia, Spain, May/June 2000. Proceedings. [Google Scholar]
- 5.Stolfo SJ, Fan W, Lee W, Prodromidis A, Chan PK. In: Proceedings of the 2000 DARPA Information Survivability Conference and Exposition. Hilton Head, South Carolina, January 25–27. Washington, DC, USA: IEEE Computer Press; 2000. Cost-based modeling for fraud and intrusion detection: results from the JAM project; pp. 130–144. [Google Scholar]
- 6.Quinlan JR. C4.5: Programs for Machine Learning. San Francisco, CA, USA: Morgan Kaufmann Publishers; 1993. [Google Scholar]
- 7.Breiman L. Bagging Predictors. Mach. Learn. 1996;24:123–140. [Google Scholar]
- 8.Zadrozny B, Langford J, Abe N. Proceedings of the Third IEEE International Conference on Data Mining. Vol. 3. Melbourne, Florida, Washington, DC, USA: IEEE Computer Society; 2003. Cost-sensitive learning by cost-proportionate example weighting; p. 435. [Google Scholar]
- 9.Langlois RE, Lu H. Intelligible machine learning with malibu. Conf. Proc. IEEE Eng. Med. Biol. Soc. 2008;2008:3795–3798. doi: 10.1109/IEMBS.2008.4650035. [DOI] [PubMed] [Google Scholar]
- 10.Ahmad S, Sarai A. PSSM-based prediction of DNA binding sites in proteins. BMC Bioinformatics. 2005;6:33. doi: 10.1186/1471-2105-6-33. [DOI] [PMC free article] [PubMed] [Google Scholar]
- 11.Altschul SF, Madden TL, Schaffer AA, Zhang J, Zhang Z, Miller W, Lipman DJ. Gapped BLAST and PSI-BLAST: a new generation of protein database search programs. Nucleic Acids Res. 1997;25:3389–3402. doi: 10.1093/nar/25.17.3389. [DOI] [PMC free article] [PubMed] [Google Scholar]
- 12.Henikoff S, Henikoff JG. Amino acid substitution matrices from protein blocks. Proc. Natl Acad. Sci. USA. 1992;89:10915–10919. doi: 10.1073/pnas.89.22.10915. [DOI] [PMC free article] [PubMed] [Google Scholar]
- 13.Kumar M, Gromiha MM, Raghava GP. Prediction of RNA binding sites in a protein using SVM and PSSM profile. Proteins. 2008;71:189–194. doi: 10.1002/prot.21677. [DOI] [PubMed] [Google Scholar]
- 14.Kuznetsov IB, Gou Z, Li R, Hwang S. Using evolutionary and structural information to predict DNA-binding sites on DNA-binding proteins. Proteins. 2006;64:19–27. doi: 10.1002/prot.20977. [DOI] [PubMed] [Google Scholar]
- 15.Ofran Y, Mysore V, Rost B. Prediction of DNA-binding residues from sequence. Bioinformatics. 2007;23:i347–i353. doi: 10.1093/bioinformatics/btm174. [DOI] [PubMed] [Google Scholar]
- 16.Terribilini M, Lee JH, Yan C, Jernigan RL, Honavar V, Dobbs D. Prediction of RNA binding sites in proteins from amino acid sequence. RNA. 2006;12:1450–1462. doi: 10.1261/rna.2197306. [DOI] [PMC free article] [PubMed] [Google Scholar]
- 17.Wang L, Brown SJ. Prediction of RNA-binding residues in protein sequences using support vector machines. Conf. Proc. IEEE Eng. Med. Biol. Soc. 2006;1:5830–5833. doi: 10.1109/IEMBS.2006.260025. [DOI] [PubMed] [Google Scholar]
- 18.Wang Y, Xue Z, Shen G, Xu J. PRINTR: prediction of RNA binding sites in proteins using SVM and profiles. Amino Acids. 2008;35:295–302. doi: 10.1007/s00726-007-0634-9. [DOI] [PubMed] [Google Scholar]
- 19.Cassiday LA, Maher JL. Having it both ways: transcription factors that bind DNA and RNA. Nucleic Acids Res. 2002;30:4118–4126. doi: 10.1093/nar/gkf512. [DOI] [PMC free article] [PubMed] [Google Scholar]
- 20.Langlois RE, Lu H. Boosting the prediction and understanding of DNA-binding domains from sequence. Nucleic Acids Res. 2010 doi: 10.1093/nar/gkq061. doi:10.1093/nar/gkq061 [Epub ahead of print; 15 February 2010] [DOI] [PMC free article] [PubMed] [Google Scholar]
- 21.Bhardwaj N, Langlois RE, Zhao G, Lu H. Kernel-based machine learning protocol for predicting DNA-binding proteins. Nucleic Acids Res. 2005;33:6486–6493. doi: 10.1093/nar/gki949. [DOI] [PMC free article] [PubMed] [Google Scholar]
- 22.Bhardwaj N, Lu H. Residue-level prediction of DNA-binding sites and its application on DNA-binding protein predictions. FEBS Lett. 2007;581:1058–1066. doi: 10.1016/j.febslet.2007.01.086. [DOI] [PMC free article] [PubMed] [Google Scholar]
Associated Data
This section collects any data citations, data availability statements, or supplementary materials included in this article.