Abstract
DNA-binding transcription factors (TFs) play a central role in transcription regulation, and computational approaches that help in elucidating complex mechanisms governing this basic biological process are of great use. In this perspective, we present the TFM-Explorer web server that is a toolbox to identify putative TF binding sites within a set of upstream regulatory sequences of genes sharing some regulatory mechanisms. TFM-Explorer finds local regions showing overrepresentation of binding sites. Accepted organisms are human, mouse, rat, chicken and drosophila. The server employs a number of features to help users to analyze their data: visualization of selected binding sites on genomic sequences, and selection of cis-regulatory modules. TFM-Explorer is available at http://bioinfo.lifl.fr/TFM.
INTRODUCTION
Deciphering the combinatorics of cis-regulatory elements is crucial to understand regulation of gene expression. However, in silico detection of cis-regulatory elements is a notoriously difficult task, especially in higher eukaryotes. Motifs corresponding to transcription factor binding sites (TFBSs) have a low information content, which comes from the fact that the affinity between DNA and a binding protein should not be too strong and that the binding mechanism is very complex. It is driven by sequence patterns, but also by chromatin structure and collaboration between transcription factors (TFs). Successful approaches combine several complementary prediction strategies. They exploit information coming from known DNA–protein binding motifs available in databases, phylogenetic footprinting and multi-species comparison, formation of cis-regulatory modules (CRMs) involving collaborative TFs. In the presence of a set of coexpressed or coregulated genes, searching for overrepresented binding motifs is also fruitful. The basic assumption is that genes with similar expression profiles should share common TFBSs in their upstream regulatory region. This approach is made available in several program tools. See (ref. 1–4) for example. An exhaustive survey appeared recently in (5).
In this article, we present the TFM-Explorer toolbox. Compared to other tools, TFM-Explorer is able to analyze a set of orthologous upstream sequences coming from different species without any preprocessing step such as alignment or conservation search. Supported organisms are human, mouse, rat, chicken and drosophila. Another specificity is that TFM-Explorer finds local regions showing overrepresentation of TFBSs and uses spatial conservation to improve accuracy of the predictions. Local overrepresentation enables to identify short or long regions involved in the transcriptional regulation. Spatial conservation takes advantage of the fact that the activity of basal TFs is conditioned by the distance from the binding site in the core promoter to the Transcription start site (TSS) (6), for example.
TFM-Explorer is able to analyze up to 15 kb around the TSS for all RefSeq genes of the available species. Finally, TFM-Explorer offers a number of features to help users to analyze their data: visualization of selected TFBSs on genomic sequences and selection of CRMs.
METHOD
TFBSs are modeled by position weight matrices (PWMs), such as available in Transfac (7) or Jaspar (8) databases.
Clusters of overrepresented TFBSs
The first step of the method consists in searching for locally overrepresented TFBSs in the set of upstream regulatory sequences. For this task, all PWMs are considered separately. The algorithm works as follows.
First, for a given PWM, input sequences are scanned on both strands to find all potential TFBSs using a simple score threshold for the PWM. This score threshold is chosen to give a P-value equal or better to 2 × 10⁻³ for each position for each sequence [such as described in (9)].
Then, for each position relative to the TSS, we denumerate the number x of input sequences having a TFBS for the given PWM starting at this position, and we compute the probability of observing at least x occurrences at that position by chance. This calculus uses position- and species-dependent background models that are precomputed for each available species from all annotated upstream regions in genomes.
Lastly, we retrieve local regions with relatively high density of TFBSs using a log-odd ratio sliding score system that takes into account the previously computed probability.
More details about TFM-Explorer strategy have been described previously in (10).
As a result, TFM-Explorer returns a set of selected clusters. A cluster is characterized both by a PWM, corresponding to a single TF, and by a region on the genomic sequences exhibiting a significant overrepresentation of TFBSs for the concerned PWM. Each cluster is assigned a P-value that measures its quality. Note that TFM-Explorer may output several clusters for the same PWM, corresponding to distinct regions of the upstream sequences. In this case, each cluster is assigned its own P-value.
Pairwise correlations
TFM-Explorer enables to identify all pairs of correlated clusters within the set of significant clusters found by the algorithm for overrepresented TFBSs. The correlation calculus is based on the subset of input sequences associated with each cluster. Assume the set of input sequences given by the users contains n sequences. Then each cluster can be assigned a binary vector of size n as follows: the ith element of the vector is 1 if the ith input sequence contains an occurrence for the PWM in the region of the cluster, otherwise it is 0. Two clusters are considered as correlated as soon as their respective binary vectors are not randomly distributed. The value of the correlation coefficient ranges between −1 and 1. The higher the absolute value, the higher the correlation between the two clusters. Positive values indicate that the clusters share more sequences than expected by chance. This corresponds, for example, to TFs that act synergistically. Negative values indicate that the clusters share less sequences than expected by chance. In this case, clusters correspond to two complementary subsets of sequences showing different regulatory mechanisms.
CRMs
It is also possible to select and visualize CRMs from all potential TFBSs. Here, a CRM is defined as a combination of TFBSs for a selection of PWMs, no matter their order or the pairwise distance between them. More precisely, a CRM is defined by the following features.
A set of relevant PWMs;
the length of the CRM: The maximal number of positions between the start position of the first element of the CRM and the start position of the last elements of the CRM;
the 5′ position on the sequence where the search for CRMs starts;
the 3′ position on the sequence where the search for CRMs end; and
the minimal number of distinct PWMs in the CRM: this number should be smaller than or equal to the number of selected PWMs in the first item.
We use an efficient linear running time algorithm to find out all specified CRMs, which allows the user to modify interactively the parameters for CRMs.
WEB SERVER
Implementation and requirements
TFM-Explorer is a web tool entirely written in Python, housed on an Apache web server and implementing a client–server model. A few Javascript and AJAX methods allow to have a friendly and easy-to-use interface. TFM-Explorer has been tested on a wide range of browsers, including Firefox, Safari, Chrome, Opera and Internet Explorer, and has been validated by the w3C facilities. You have to enable Javascript on your browser to use all visualization tools.
Input form
TFM-Explorer requires a set of regulatory upstream DNA sequences as input. These sequences can be provided in the standard FASTA format or using the RefSeq accession numbers of the genes (11). In both cases, the data can be uploaded on the server using a file or directly by pasting it in the form.
The system accepts DNA sequences and RefSeq accession numbers from the following organisms and assemblies: human (hg19), mouse (mm9), rat (rn4), chicken (galGal3) and drosophila melanogaster (dm3).
The user should also specify the location of the given sequences in regards of the TSS. This information is crucial to use the right background model to analyze the data. Accepted values range from −10 000 bp to +5000 bp.
Lastly, the set of PWMs used to scan the sequences has to be selected. PWMs for the 2009 JASPAR vertebrate database (8) and the 6.0 TRANSFAC database (7) are available.
Output
A TFM-Explorer run can take several minutes. Once the search is over, the results are displayed on a new web page. Each run is assigned a unique identifier and the results are stored on the server for one week. All the results can be downloaded as an archive containing XML and CSV files for storage and automatic parsing.
Main results page
It contains the list of top clusters identified by TFM-Explorer ranked by their P-value. For each cluster, information on the PWM, the associated transcription factor, the boundaries on the cluster, the number of sequences having occurrences of TFBSs for the PWM, the P-value and the list of correlated clusters is given. By navigating in the results, it is possible to obtain detailed information about each cluster.
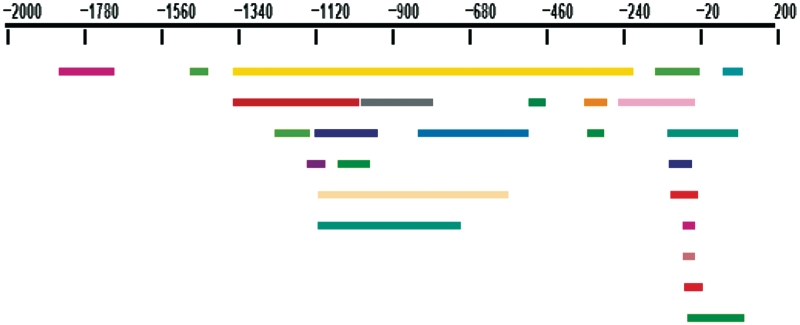
A clickable drawing helps to visualize the position of all clusters on the input sequences (Figure 1), and the pairwise correlations between all the clusters are systematically calculated and presented in a bi-dimensional array.
Figure 1.
Compact visualization of clusters on input sequences. Each colored rectangle corresponds to a cluster. A unique color is used for a given matrix.
Detailed results for a cluster
For each cluster, additional information is available. This includes information on the PWM associated to the cluster, such as the information content, the sequence logo (12), the GC percent, as well as the position and binding sequences of TFBSs and the list of correlations with other clusters.
Visualization of TFBSs and CRMs
It is possible to visualize all TFBSs on the input sequences, for one or several clusters from the main results page. An interactive tool is available for this task. By default, a drawing of the input sequences with all the TFBSs for the PWM of selected clusters is displayed. The drawing is accompanied by the location and the DNA sequences of all selected TFBSs in exportable text format.
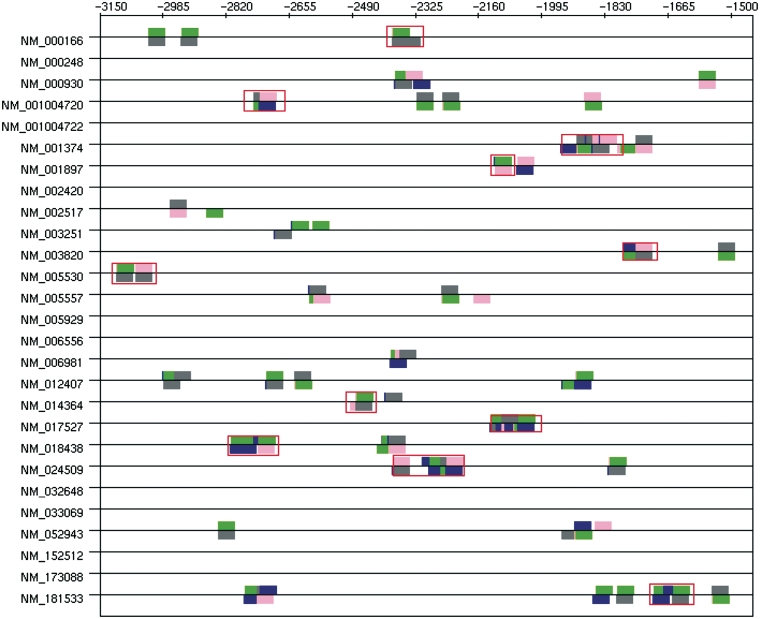
Users can select other PWMs, modify the boundaries of the region of the input sequences to investigate, and refresh the drawing to display more TFBSs or extend its limits. In addition to the simple visualization of TFBSs, this tool can be used to identify and display TFBSs that occur in CRM, by simply specifying the features of the CRM, as described in the previous section, and refreshing the drawing (Figure 2).
Figure 2.
Skin-specific module results. Modules in TiGER are surrounded with red rectangles. Blue: E47; gray: Lmo2 complex; green: MyoD; pink: Areb6.
Help page
All pages feature contextual help links (denoted by [?] on the web pages) that provide more detailed explanation on parameters values, input and output formats.
EXAMPLES OF USE
The method implemented in TFM-Explorer has been successfully used by several independent research groups (13–16). We illustrate here the relevance of the method on three simple examples. We also present some comparisons with results obtained with Pscan (4), oPOSSUM (3) and PASTAA (2). All data set sequences are available on the web server from the Example section.
Muscle-specific genes analysis
The muscle data set was initially introduced by Wasserman and Fickket (7) and is often used in the literature to assess the accuracy of CRMs prediction tools. It is also presented in the general assessment paper (18). We use this latter source, and retrieved RefSeq accession numbers when available. This results in a set of 19 genes from human, mouse, rat and chicken. Known TFs regulating those genes are: Mef-2, Myf, Mzf, Sp1, SRF and Tef.
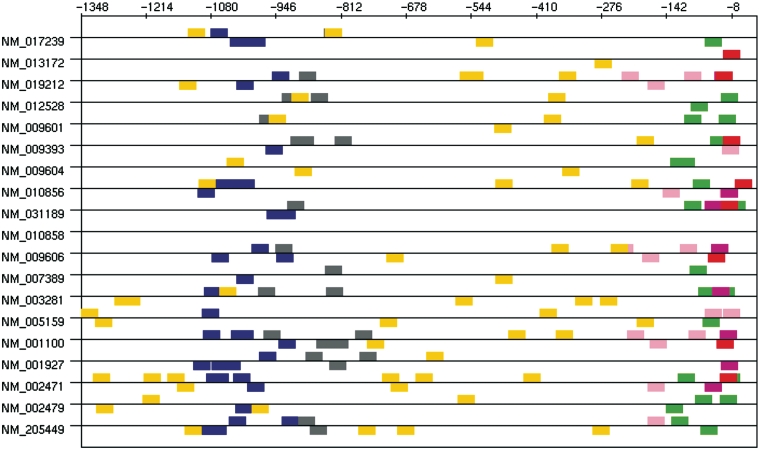
We launched TFM-Explorer with all default parameter values: JASPAR PWMs, location from −2000 bp to +200 bp. Among the six most significant clusters ranked by TFM-Explorer, five of them correspond to previously mentioned TFs (Table 1). At rank 8, TFM-Explorer also identifies a cluster for TBP at position [−56:−2], which corresponds to the TATA-box. In Figure 3, we show the location of TFBSs for these clusters. This drawing is obtained with the visualization tool of TFM-Explorer. It clearly illustrates that the method is able to identify large or short regions, and that some TFs have a preferred location in regards of the TSS.
Table 1.
Muscle specific data set—six top clusters found by TFM-Explorer
| Rank | TF | Location | P-value |
|---|---|---|---|
| ⋆ 1 | SP1 | [−1115:−0934] | 5.38e-10 |
| ⋆ 2 | SRF | [−0246:−0025] | 5.69e-09 |
| 3 | EBF1 | [−0982:−0773] | 1.39e-07 |
| ⋆ 4 | Myf | [−0143:−0015] | 2.89e-07 |
| ⋆ 5 | MZF1_1 | [−1348:−0202] | 3.05e-07 |
| ⋆ 6 | MEF2A | [−0064:−0026] | 3.87e-07 |
TFs marked with asterisk are known to be involved in the regulation of the sequences.
Figure 3.
Muscle-specific data set—Visualization of clusters. Each colored rectangle corresponds to a TFBS found by TFM-Explorer. Blue: SP1, pink: SRF, gray: EBF1, green: Myf, yellow:MZF1, magenta:MEF2A, red:TBP.
In Table 2, we give results obtained with Pscan (on human and mouse genes) and oPOSSUM (on human genes). We were not able to run PASTAA on this example because it does not accept JASPAR matrices. Globally, TFs of interest are better ranked with TFM-Explorer.
Table 2.
Results for the muscle data set with Pscan and oPOSSUM
| Pscan |
oPOSSUM |
||
|---|---|---|---|
| Rank | TF | Rank | TF |
| 1 | Myf | 1 | Myf |
| 3 | SRF | 3 | MZF1_1 |
| 10 | MZF1_5 | 6 | MZF1_5 |
| 13 | SP1 | 10 | MEF2A |
| 19 | MEF2A | ||
| 22 | MZF1_1 | ||
Only TFs known to be expressed in muscle are shown. All those TFs are found using TFM-Explorer (Table 1).
Skin-specific genes analysis
The second data set is concerned with genes preferentially expressed in skin tissues, available from the TiGER database (19). It is made of 27 human sequences. We used vertebrate matrices from TRANSFAC (some expected PWMs are not present in Jaspar) and searched for potential TFBSs 5000 bp before the TSS.
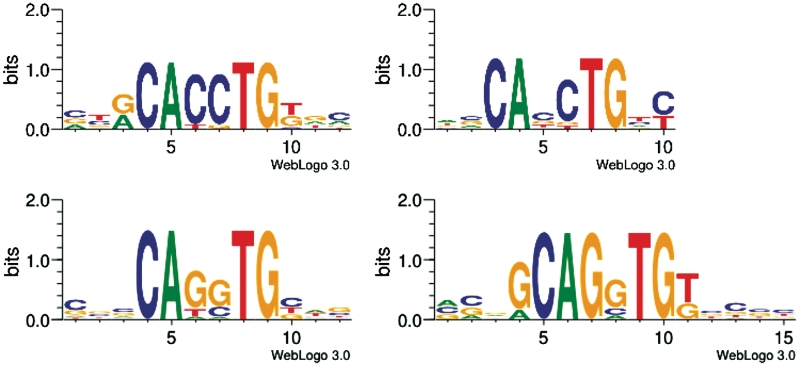
The four first clusters given by TFM-Explorer (P-value lower than 3e-7) correspond to four TFs involved in the regulation of skin-specific genes (Table 3). The location (between 1500 bp and 3200 bp before the TSS) is congruent with data reported in the TiGER database. Moreover, clusters 2 and 3 concern the two TFs AREB6 and Lmo2 whose occurrences are the highest in modules as referenced in the TiGER database (in respectively 24 and 36 modules out of the 49 modules). We further investigated those four clusters. To do so, we looked for CRMs of maximal length 100, between positions −3112 and −1528 involving the four different TFs. Results are displayed in Figure 2. CRMs found are in agreement with those predicted in the TiGER database. Moreover, the drawing shows that occurrences within a CRM are often overlapping, on the same strand or on the opposite strand (Table 4). This observation is confirmed by looking at pairwise correlations. For example, Lmo2 complex has 64% of its occurrences in common with those of Areb6 and 53% in common with MyoD. This comes from the fact that PWMs for Areb6 and MyoD are very similar, and that PWMs for E47 and Lmo2 complex also correspond to the same consensus sequence when reverse complemented. Sequence logos for these four PWMs, that are available from TFM-Explorer, are given in Figure 4.
Table 3.
Four best clusters computed for the skin data set
| Rank | TF | Location | P-value |
|---|---|---|---|
| 1 | E47 | [−2989:−1528] | 1.33e-15 |
| 2 | AREB6 | [−3112:−1797] | 8.53e-11 |
| 3 | Lmo2 complex | [−3022:−2355] | 8.81e-10 |
| 4 | MyoD | [−2953:−2537] | 2.27e-07 |
Table 4.
CRM found for sequence NM_005530
| PWM | Position | St. | Sequence |
|---|---|---|---|
| V$AREB6_03 | −3106 | + | CCGCACCTGGCC |
| V$AREB6_03 | −3055 | + | GCACACCTGGAT |
| V$E47_01 | −3107 | + | ACCGCACCTGGCCTC |
| V$E47_01 | −3057 | − | AAGCACACCTGGATT |
| V$LMO2COM_01 | −3106 | − | CCGCACCTGGCC |
| V$LMO2COM_01 | −3055 | − | GCACACCTGGAT |
| V$MYOD_Q6 | −3105 | + | CGCACCTGGC |
Figure 4.
Logos for PWMs V$AREB6_03, V$MYOD_Q6 (top), V$LMO2COM_01 and V$E47_01 (bottom), from left to right.
We performed a comparison with PASTAA only. Indeed, oPOSSUM does not accept TRANSFAC matrices and Pscan analyzes at most 1000 bp before the TSS. Results are given in Table 5. PASTAA identifies five TFs, and TFM-Explorer six TFs. Morever, TFs most involved into CRMs given by TiGER are better ranked with TFM-Explorer.
Table 5.
Results for the skin data set with PASTAA
| TFM-Explorer | PASTAA | ||
|---|---|---|---|
| rank | rank | TF | CRMs |
| 2 | AREB6 | 36 | |
| 3 | 17 | Lmo2 complex | 24 |
| 1 | 1 | E47 | 7 |
| 4 | MyoD | 6 | |
| 12 | Er-alpha | 3 | |
| 18 | 18 | Srebp | 2 |
| 21 | GR | 1 | |
| 8 | Elk-1 | 1 |
Only the TFs referenced in the TiGER database are shown. Blank cells indicate that the TF is not found by the method. The CRMs column indicates the number of times the corresponding TF is involved into a CRM given by TiGER.
Neuronal-specific genes analysis
The third data set is concerned with genes with high expression in brain tissues and low levels of expression in other tissues, taken from (20). The authors selected nine presynaptic genes that show strong neuronal expression. We launched TFM-Explorer on these nine genes with TRANSFAC PWMs. Since the expected numbers of clusters is high, we changed the parameters and chose a ratio of 4 in order to have clusters with a higher density of TFBSs.
Most of the clusters given by TFM-Explorer involve TFs known to regulate presynatic-specific genes. Furthermore, the pairwise correlation calculus between clusters reveals significant correlations between some of these cluster. Two groups of clusters emerge, displayed in Table 6. Interestingly, these sets concern both distinct regions corresponding to regions of experimentally identified regulatory elements (20) (Figure 5, difference in coordinates compared to (20) are due to a different position for zero).
Table 6.
Two sets of correlated clusters computed for the neuronal-specific data set
| Rank | TF | Location | P-value |
|---|---|---|---|
| 2 | Sp1 | [−1062:−0957] | 7.50e-06 |
| 8 | NGFI-C | [−0211:−0012] | 8.57e-05 |
| 22 | CP2 | [−1296:−0937] | 5.20e-04 |
| 3 | CREB | [−0163:−0023] | 1.20e-05 |
| 15 | Sp1 | [−1211:−1168] | 2.72e-04 |
| 25 | v-Jun | [−0199:−0023] | 5.78e-04 |
Figure 5.
Occurrences of TFBSs corresponding to the two sets of correlated clusters given in Table 6. Brown: CP2; orange: Sp1; pink: Sp1; cyan: v-Jun; red: NGFI-C; gray: CREB.
This data set is concerned with CRM analysis using FASTA sequences as input, which is out of scope of the three software mentioned. Thus we do not show any comparison.
DOWNLOAD
We have presented the TFM-Explorer web server. TFM-Explorer is also available for download under the Cecill licence. This command line application, written in Python, offers a highly configurable use of TFM-Explorer, with the possibility to compute new background models for new species, to add PWMs and to integrate TFM-Explorer in an automatic bioinformatics pipeline. It runs under Windows, Linux and Mac OS.
Conflict of interest statement. None declared.
REFERENCES
- 1.Chang L-W, Nagarajan R, Magee JA, Milbrandt J, Stormo GD. A systematic model to predict transcriptional regulatory mechanisms based on overrepresentation of transcription factor binding profiles. Genome Res. 2006;16:405–413. doi: 10.1101/gr.4303406. [DOI] [PMC free article] [PubMed] [Google Scholar]
- 2.Roider HG, Manke T, O’Keeffe S, Vingron M, Haas SA. PASTAA: identifying transcription factors associated with sets of co-regulated genes. Bioinformatics. 2009;25:435–442. doi: 10.1093/bioinformatics/btn627. [DOI] [PMC free article] [PubMed] [Google Scholar]
- 3.Ho Sui SJ, Fulton DL, Arenillas DJ, Kwon AT, Wasserman WW. oPOSSUM: integrated tools for analysis of regulatory motif over-representation. Nucleic Acids Res. 2007;35:W245–W252. doi: 10.1093/nar/gkm427. [DOI] [PMC free article] [PubMed] [Google Scholar]
- 4.Zambelli F, Pesole G, Pavesi G. Pscan: finding over-represented transcription factor binding site motifs in sequences from co-regulated or co-expressed genes. Nucleic Acids Res. 2009;37:W247–W252. doi: 10.1093/nar/gkp464. [DOI] [PMC free article] [PubMed] [Google Scholar]
- 5.Nguyen TT, Androulakis IP. Recent advances in the computational discovery of transcription factor binding sites. Algorithms. 2009;2:582–605. [Google Scholar]
- 6.Lewis B. Genes. United States: Jones & Bartlett Publishers; 2007. [Google Scholar]
- 7.Matys V, Fricke E, Geffers R, Gling E, Haubrock M, Hehl R, Hornischer K, Karas D, Kel AE, Kel-Margoulis OV, et al. Transfac: transcriptional regulation, from patterns to profiles. Nucleic Acids Res. 2003;31:374–378. doi: 10.1093/nar/gkg108. [DOI] [PMC free article] [PubMed] [Google Scholar]
- 8.Bryne JC, Valen E, Tang MH, Marstrand T, Winther O, da Piedade I, Krogh A, Lenhard B, Sandelin A. Jaspar, the open access database of transcription factor-binding profiles: new content and tools in the 2008 update. Nucleic Acids Res. 2008;36:D102–D106. doi: 10.1093/nar/gkm955. [DOI] [PMC free article] [PubMed] [Google Scholar]
- 9.Touzet H, Varré J-S. Efficient and accurate p-value computation for position weight matrices. Algorithms Mol. Biol. 2007;2 doi: 10.1186/1748-7188-2-15. [DOI] [PMC free article] [PubMed] [Google Scholar]
- 10.Defrance M, Touzet H. Predicting transcription factor binding sites using local over-representation and comparative genomics. BMC Bioinformatics. 2006;7 doi: 10.1186/1471-2105-7-396. [DOI] [PMC free article] [PubMed] [Google Scholar]
- 11.Pruitt KD, Tatusova T, Maglott DR. NCBI reference sequences (RefSeq): a curated non-redundant sequence database of genomes, transcripts and proteins. Nucleic Acids Res. 2006;35:D61–D65. doi: 10.1093/nar/gkl842. [DOI] [PMC free article] [PubMed] [Google Scholar]
- 12.Crooks GE, Hon G, Chandonia JM, Brenner SE. Weblogo: a sequence logo generator. Genome Res. 2004;14:1188–1190. doi: 10.1101/gr.849004. [DOI] [PMC free article] [PubMed] [Google Scholar]
- 13.Endale Ahanda M-L, Ruby T, Wittzell H, Bed’Hom B, Chauss A-M, Morin V, Oudin A, Chevalier C, Young JR, Zoorob R. Non-coding RNAs revealed during identification of genes involved in chicken immune responses. Immunogenetics. 2009;61:57–70. doi: 10.1007/s00251-008-0337-8. [DOI] [PubMed] [Google Scholar]
- 14.Naamane N, van Helden J, Eizirik DL. In silico identification of Nf-kappaB-regulated genes in pancreatic beta-cells. BMC Bioinformatics. 2007;8 doi: 10.1186/1471-2105-8-55. [DOI] [PMC free article] [PubMed] [Google Scholar]
- 15.Romero DG, Plonczynski MW, Welsh BL, Gomez-Sanchez CE, Zhou MY, Gomez-Sanchez EP. Gene expression profile in rat adrenal zona glomerulosa cells stimulated with aldosterone secretagogues. Physiol. Genomics. 2007;32:117–127. doi: 10.1152/physiolgenomics.00145.2007. [DOI] [PubMed] [Google Scholar]
- 16.Wang Y, Couture OP, Qu L, Uthe JJ, Bearson SMD, Kuhar D, Lunney JK, Nettleton D, Dekkers JCM, Tuggle CK. Analysis of porcine transcriptional response to salmonella enterica serovar choleraesuis suggests novel targets of NFkappaB are activated in the mesenteric lymph node. BMC Genomics. 2008;9 doi: 10.1186/1471-2164-9-437. [DOI] [PMC free article] [PubMed] [Google Scholar]
- 17.Wasserman WW, Fickett JW. Identification of regulatory regions which confer muscle-specific gene expression. J. Mol. Biol. 1998;278:167–181. doi: 10.1006/jmbi.1998.1700. [DOI] [PubMed] [Google Scholar]
- 18.Klepper K, Sandve GK, Abul O, Johansen J, Drablos F. Assessment of composite motif discovery methods. BMC Bioinformatics. 2008;9:123. doi: 10.1186/1471-2105-9-123. [DOI] [PMC free article] [PubMed] [Google Scholar]
- 19.Liu X, Yu X, Zack DJ, Zhu H, Qian J. Tiger: a database for tissue-specific gene expression and regulation. BMC Bioinformatics. 2008;9 doi: 10.1186/1471-2105-9-271. [DOI] [PMC free article] [PubMed] [Google Scholar]
- 20.Liu R, Hannenhalli S, Bucan M. Motifs and cis-regulatory modules mediating the expression of genes co-expressed in presynaptic neurons. Genome Biol. 2009;10 doi: 10.1186/gb-2009-10-7-r72. [DOI] [PMC free article] [PubMed] [Google Scholar]


