


Abstract
DNABINDPROT is designed to predict DNA-binding residues, based on the fluctuations of residues in high-frequency modes by the Gaussian network model. The residue pairs that display high mean-square distance fluctuations are analyzed with respect to DNA binding, which are then filtered with their evolutionary conservation profiles and ranked according to their DNA-binding propensities. If the analyses are based on the exact outcome of fluctuations in the highest mode, using a conservation threshold of 5, the results have a sensitivity, specificity, precision and accuracy of 9.3%, 90.5%, 18.1% and 78.6%, respectively, on a dataset of 36 unbound–bound protein structure pairs. These values increase up to 24.3%, 93.4%, 45.3% and 83.3% for the respective cases, when the neighboring two residues are considered. The relatively low sensitivity appears with the identified residues being selective and susceptible more for the binding core residues rather than all DNA-binding residues. The predicted residues that are not tagged as DNA-binding residues are those whose fluctuations are coupled with DNA-binding sites. They are in close proximity as well as plausible for other functional residues, such as ligand and protein–protein interaction sites. DNABINDPROT is free and open to all users without login requirement available at: http://www.prc.boun.edu.tr/appserv/prc/dnabindprot/.
INTRODUCTION
Prediction of the DNA binding sites in proteins is essential for understanding the protein function and the molecular mechanism of the protein–DNA recognition. It is of interest to identify the DNA-binding function of proteins (1–5) and DNA-binding residues, for which several approaches have been developed using sequence (6–13) and structure-based properties (14–16). There are several prediction studies on machine learning (6–13,16–22), such as neural networks (16–19), random forest-based approach (11) and support vector machine classifier (20–22), some of them relying on sequence properties only. It was recently shown (23) that non-specific DNA interacts with the same binding sites as of the specific DNA implying an intrinsic behavior for DNA binding. Taking into account the fold similarity and DNA-binding propensity made possible the use of threading algorithms of protein–protein and protein–ligand interactions for the determination of DNA-binding domains and related protein sites (24).
A widely used property for the prediction of DNA-binding residues is the propensity of the interface residues. The polar residues that complement the negative charge of the DNA surface are highlighted (17,25–28), where ARG and LYS have the highest propensity values. Evolutionary conservation is another key property that is shown to increase the success of DNA binding site prediction (13,29,30). The analysis of residue–base interactions and conservation (29) suggests that the DNA-binding residues are often evolutionary conserved but the conservation by itself may not be sufficient for the prediction. On the other hand, the conserved patches (31–33) identifying the functional regions were shown to predict the core of the DNA-binding interface, yet not all the binding residues. This implies that a part of the DNA binding site is highly conserved.
Here, a new approach is introduced for the prediction of DNA-binding residues and residues that the DNA-binding residues possibly interact, based on residue fluctuations in high frequency modes by the Gaussian network model (GNM; 34–35). High-frequency fluctuations involve tightly packed and severely constrained residues; i.e. the centers of localization of the energy in a structure (36). The high frequency fluctuating residues appears to have a role in maintaining the structure or its stability. They are positioned at the local minima of the energy landscape curve, which describe the equilibrium positions of residues. Escape from these local minima is opposed by the surrounding energy walls, which in return implies a resistance for conformational changes. These residues are suggested to be associated with binding as well as folding core residues (37–40). Recently, high-frequency modes reflecting the local events at residue level was shown to describe a network of residues whose fluctuations are strongly coupled and responding strongly to energy fluctuations (41).
With the present approach, a network of residue pairs that displays high mean-square distance fluctuations in high-frequency modes is identified on the unbound structures of known DNA-binding proteins. These residues are analyzed with respect to DNA binding sites, then filtered with evolutionary conservation profiles from ConSurf (42), and ranked according to their propensities for DNA binding. The high frequency fluctuating residues that are not tagged as DNA-binding residues in the suggested network of residues are those whose fluctuations are coupled with the identified DNA binding sites with possible functional significance.
METHODS
Dataset
The algorithm implemented as a web server, DNABINDPROT, is tested on a data set of 54 unbound (free) proteins and verified with the bound (complex) structures. The DNA binding site information is taken from PDBsum website (43), where the site information is extracted from the distance between the protein atoms and the DNA atoms in the complex (44). The dataset is compiled from the previous studies of Dijk et al. (45) and Szilágyi et al. (4). Some of the protein structures are discarded due to the missing residues at the binding sites of unbound structures. After performing a redundancy check using PISCES (46), a total of 54 unbound–bound protein structure pairs are used in this study (Supplementary Table S1).
Overview: GNM
The GNM (34,35) considers protein structures as 3D elastic networks, where residues represented by α-carbon atoms are the nodes and the harmonic springs between residues pairs within a specified interaction range are the edges. It is assumed that the residues in this elastic network description undergo Gaussianly distributed fluctuations around their mean positions.
The potential energy function of the network on N modes (residues) is defined by,
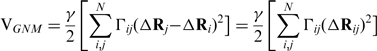 |
(1) |
where γ is the force constant, ΔRi and ΔRj are the fluctuation vectors of i-th and j-th residues, respectively. ΔRij is the fluctuation of distance vector between residues i and j. Γ is the Kirchhoff connectivity matrix represented as:
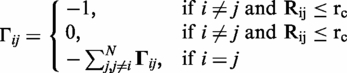 |
(2) |
Rij is the distance between α-carbon atoms i and j, where rc is distance cut-off distance for interaction. The equilibrium fluctuations ΔRi and ΔRj of Cα of residues i and j are given by GNM as
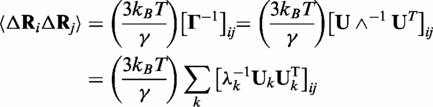 |
(3) |
where U is an orthogonal matrix whose columns ui are the eigenvectors and Λ is a diagonal matrix of eigenvalues λi of Γ. The eigenvalues are proportional to the frequencies of the individual modes, while eigenvectors define the shapes of the modes. kB is the Boltzmann constant and T is the absolute temperature. This equation allows expressing the correlation between the fluctuations of residues in terms of linear combinations of individual eigenvectors from slowest to fastest modes of motion.
Alternatively, the mean-square distance fluctuations between i-th and j-th residues, i.e. the mean-square fluctuation in the ‘spring length’ connecting residues i and j, can be expressed as (35,38):
| (4) |
〈ΔRij2〉 reflects both the mobilities of individual residues and the correlation between the fluctuations of residues. Slow modes having high degree of cooperativity refer to cooperative and global motions, whereas fast modes refer to the residues displaying local behavior with rapid and small amplitude fluctuations. Here we concentrate on these fast modes.
Determination of the DNA-binding residues: fluctuations, conservation and residue propensities
The mean-square distance fluctuations of residue of i and j, 〈ΔRij2〉, in the fastest modes on a given unbound structure are calculated using Equation (4). A network of residue pairs with high mean-square distance fluctuations is obtained in the fast frequencies (41). On the fast end of the dynamic spectrum that GNM provides; individual modes of fast1, fast2 and fast3 and the average of fast1-3 and fast1-5 are considered in the calculations.
These residues are then filtered using their evolutionary conservation levels using the ConSurf Database (42). The conservation scores reflect the Bayesian measure of the site’s evolutionary rate. The continuous conservation scores were partitioned into a discrete scale of 9, where a grade of 1 indicates a highly variable amino acid, the position that evolves rapidly, and 9 is highly conserved, the position that evolves slowly. For each given PDB ID, the conservation scores are taken from the already existing ConSurf database and a threshold value is chosen to reduce the first suggested set of residues. Finally, the suggested residues are ranked according to their propensities for DNA binding, for which the propensity values are taken from a previous study (17).
The performance of the DNABINDPROT server is reported in terms of sensitivity, specificity, precision and accuracy, based on the following definitions:
| (5) |
| (6) |
| (7) |
| (8) |
where TP, TN, FP and FN stand for the number of true positives, the number of true negatives, the number of false positives and the number of false negatives, respectively.
WEB SERVICE
Specifying the PDB ID or uploading a structure along with the chain ID where available, the user has the option to choose the number of fast modes, fast threshold percentage, the number of sequence neighbors, the conservation threshold and whether to sort the results with respect to propensity or residue number. Fast threshold percentage is used for the determination of residue pairs ij with higher 〈ΔRij2〉 values. Conservation threshold is used to eliminate the residues that have conservation scores less than a chosen value. Considering the low-resolution nature, the near neighbors of an identified residue pair may contribute to the outcome of the prediction. The user can thus choose whether to display the results from the exact match or to take into account the neighboring residues (one or two neighbors).
With an optional email address provided, the results can be sent to the user as well as being displayed on the web page. The output consists of the suggested DNA binding sites obtained using the high-frequency modes only and the results obtained from the combination of the high frequency modes and conservation data, wherever applicable. Optionally, the given results can be ranked based on the DNA-binding propensities of the residues, ascribing higher weights for the predicted residues that are functionally predisposed for the DNA binding. The listed residues are at the same time plausible for their interaction with the DNA binding sites. The flowchart of the process is given in Figure 1.
Figure 1.

Flowchart of DNABINDPROT.
RESULTS AND DISCUSSION
For the prediction of DNA-binding residues and the residues that they interact with, a set of unbound (free) protein structures with available bound (complex) structures (a total of 54 unbound-bound protein structures) are analyzed (See Dataset in ‘Methods’ section; Supplementary Table S1). In 18 proteins, there is no conservation score available due to an inadequate number of homolog sequences. For these cases, the results are displayed based on the GNM predictions only. The reported performance results are based on the study on 36 proteins for which the conservation data is available.
If the analyses are done based on the exact outcome of the highest fluctuation mode, using a fast threshold of 0.1, without using conservation data, the results have a sensitivity, specificity, precision and accuracy of 11.1%, 87.6%, 16.1% and 76.6%, respectively. Correspondingly, the results are 74.4%, 50.7%, 20.9% and 53.9% respectively when only conservation data with a threshold of 5 is used without taking the GNM analysis into account. The combination of the GNM’s prediction and conservation data, based on the exact outcome of the highest fluctuation mode with a fast threshold of 0.1 and using a conservation threshold of 5, yields values of 9.3%, 90.5%, 18.1% and 78.6% for sensitivity, specificity, precision and accuracy, respectively. These values increase up to 24.3%, 93.4%, 45.3% and 83.3% for the respective cases, when the neighboring two residues are considered. Taking the high-frequency modes into account enhances the specificity and the accuracy of the results when compared with the conservation only analysis. The high-frequency fluctuations potentially refer to the binding core residues rather than all binding residues, which possibly explain the low sensitivity of the results. The performance results are shown in Figure 2 when a fast threshold of 0.1 and conservation threshold of 5 is used for the fastest mode (mode 1). The effect of taking neighboring residues into account is reflected on the results in terms of an increase in the performance values.
Figure 2.

Performance results of DNABINDPROT for the fastest mode with a fast threshold of 0.1 and a conservation threshold of 5.
The present results are relatively selective among binding sites. The analysis suggests that 4.8% of the residues as DNA binding sites or correlated sites with the DNA binding sites, whereas 10.9% of the residues are DNA binding sites, in a structure on the average. By using conservation only, an average of 52.3% of sites has a conservation score above 5 which are proposed as a potential binding site. To this end, it should also be noted that although the RMSD between bound and unbound conformations vary several angstroms for the structure in the dataset, the residues that appear in fast modes of motion in unbound and bound conformations overlap significantly. This also evidences the overlap of high frequency fluctuation residues with stabilization centers.
Comparison of DNABINDPROT tool with other publicly available tools is given in Supplementary Data (Supplementary Tables S2 and S3). A direct comparison of DNABINDPROT with DP-Bind (13,20), DISPLAR (16) and DBD-Hunter (5) using the same dataset and the same standards of performance measurements are given in Supplementary Table S2. The comparison displays that DNABINDPROT’s performance on specificity and accuracy is comparable with the other three servers’ performances on the same dataset. Yet, the sensitivity appears low due to the fact that the high-frequency fluctuations are more selective among the binding residues, by pointing to the core binding residues that overlap the stabilization centers. The lower precision values could be compensated to a certain extent with the fact that the non-DNA tagged residues are those that display coupled fluctuations with the DNA binding sites and may as well be plausible for some functional significance. The comparison also displayed that the computation time with DNABINDPROT is much faster than those servers tested. Using only one processor, the run time for a protein of average size takes about less than a minute with DNABINDPROT.
An additional comparison table composed of the values reported in the related studies which are based on their own datasets and measurement parameters is given in Supplementary Table S3. Since such a comparison is only meaningful when the same datasets and the same standards of performance measurements are used, Supplementary Table S3 can be considered as an overview of the server studies in the field rather than a definitive comparison.
Sample protein
The 2cgp (47), Escherichia coli catabolite gene activator protein (CAP)–DNA complex, is a dimeric protein with 200 residues. One monomer has 11 DNA-binding residues (LYS 57, THR 168, ARG 169, GLN 170, CYS 178, SER 179, ARG 180, GLU 181, THR 182, ARG 185 and LYS 201; 43) The residue pairs that display high mean-square distance fluctuations 〈ΔRij 2〉 in the fastest modes are displayed in Figure 3a and b for one of the monomers of the unbound CAP structure, 1g6n (48). This structure binds DNA specifically after an allosteric transition produced by the ligand, cAMP, where DNA binding sites and cAMP binding sites are in allosteric interaction (48).
Figure 3.

(a) Contour map of  versus i and j in the fastest mode of the catabolite gene activator protein (CAP) with PDB ID 1g6n (48). (b) The structure of the CAP–DNA complex with PDB ID 2cgp (47). DNA is in orange, protein in gray, cAMP in blue, DNA binding sites suggested by DNABINDPROT (exact outcome of fast1 using fast threshold percentage 0.1) in green and DNA binding sites given in PDBsum are shown as sticks. The residues that are shown as green sticks are binding residues that are correctly identified by DNABINDPROT. (c) Representation of the results in comparison with the data by PDBsum (43). DNA binding sites given in PDBsum are in gray, ligand (cAMP) sites in blue.
When the fast threshold of 0.1 is taken, 10 residue pairs (GLN 170-GLY 173, GLU 171-GLY 173, ILE 172-GLY 173, GLN 174-GLY 173, ILE 175-GLY 173, VAL 176-GLY 173, CYS 178-GLY 173, SER 179-GLY 173, ARG 180-GLY 173, VAL 183-GLY 173) suggest a network of 11 residues with the highest mean-square distance fluctuations in the fastest mode. After the elimination of six residues due to low conservation scores, five residues are suggested from which four residues, GLN 170, CYS 178, SER 179 and ARG 180, are known (43) as being DNA-binding residues. The remaining one, GLY 173, is one of the ligand (cAMP) binding sites. For this case, the results’ performance values in terms of sensitivity, specifity, precision and accuracy are 36%, 99%, 80% and 96%, respectively. The details are illustrated in Figure 3.
When the fast threshold is reduced to 0.01, three more residue pairs are observed (LEU 50- GLY 173, ARG 169-GLY 173, GLY 177-GLY 173) suggesting a network of 14 residues in the fastest mode of motion (LEU 50, ARG 169, GLN 170, GLU 171, ILE 172, GLY 173, GLN 174, ILE 175, VAL 176, GLY 177, CYS 178, SER 179, ARG 180 and VAL 183). After the elimination of half due to the low conservation scores, seven residues are suggested from which five residues, ARG 169, GLN 170, CYS 178, SER 179 and ARG 180, are known (43) as DNA-binding residues. The remaining ones, GLY 173 and GLY 177, are cAMP binding sites. It can be also noted here that LEU 50, which is eliminated due to its low conservation score, is adjacent to VAL 49, which is another cAMP binding site. If we further drop the threshold just above the average correlation values, the region of GLY 173 displays higher correlation with the rest of the protein as is shown by the grey line in Figure 3a.
Additionally, the exact outcome of the GNM analysis on another structure of CAP (2wc2; 49) in the unliganded state (without cAMPs) reveals residue ARG 82 as the most probable binding site in the first mode with the conservation threshold of 5. This residue is one of the cAMP binding sites. On the other hand, ARG 82 and LYS 201 are the top two suggested residues in the average five fast modes (1–5), pointing to a cAMP binding site and a DNA binding site, respectively.
CONCLUSION
For unbound proteins known to have a DNA-binding function, the residue pairs with high mean-square distance fluctuations in fast modes of motion reveal a network of interacting residues in proteins, which are plausible for DNA binding. This implies that the fast modes with high frequencies reflect predefined fluctuations in a structure for DNA binding. The residues suggested in the network that are not tagged as DNA-binding residues may still have a significance as being correlated with the identified DNA-binding residues. These residues could be near neighboring residues as well as other functional residues, such as small ligand and protein-protein interaction sites, as exemplified with the case study presented. The high frequency modes being reminiscent of stabilized centers in a structure are possibly associated with potential binding core residues.
SUPPLEMENTARY DATA
Supplementary data are available at NAR Online.
FUNDING
TUBITAK-BIDEB (2218 to P.O.); Betil Fund (EU FP6-2004-ACC-SSA-2: Project No. 517991); Turkish Academy of Sciences (TUBA) (to T.H.). Funding for open access charge: The State Planning Organization of the Turkish Republic (DPT 2010K120670).
Conflict of interest statement. None declared.
Supplementary Material
REFERENCES
- 1.Ahmad S, Sarai A. Moment-based prediction of DNA-binding proteins. J. Mol. Biol. 2004;341:65–71. doi: 10.1016/j.jmb.2004.05.058. [DOI] [PubMed] [Google Scholar]
- 2.Bhardwaj N, Langlois RE, Zhao GJ, Lu H. Kernel-based machine learning protocol for predicting DNA-binding proteins. Nucleic Acids Res. 2005;33:6486–6493. doi: 10.1093/nar/gki949. [DOI] [PMC free article] [PubMed] [Google Scholar]
- 3.Stawiski EW, Gregoret LM, Mandel-Gutfreund Y. Annotating nucleic acid-binding function based on protein structure. J. Mol. Biol. 2003;326:1065–1079. doi: 10.1016/s0022-2836(03)00031-7. [DOI] [PubMed] [Google Scholar]
- 4.Szilagyi A, Skolnick J. Efficient prediction of nucleic acid binding function from low-resolution protein structures. J. Mol. Biol. 2006;358:922–933. doi: 10.1016/j.jmb.2006.02.053. [DOI] [PubMed] [Google Scholar]
- 5.Gao M, Skolnick J. DBD-Hunter: a knowledge-based method for the prediction of DNA-protein interactions. Nucleic Acids Res. 2008;36:3978–3992. doi: 10.1093/nar/gkn332. [DOI] [PMC free article] [PubMed] [Google Scholar]
- 6.Yan C, Terribilini M, Wu F, Jernigan RL, Dobbs D, Honavar V. Predicting DNA-binding sites of proteins from amino acid sequence. BMC Bioinformatics. 2006;7:262. doi: 10.1186/1471-2105-7-262. [DOI] [PMC free article] [PubMed] [Google Scholar]
- 7.Ofran Y, Rost B. ISIS: interaction sites identified from sequence. Bioinformatics. 2006;23:e13–e16. doi: 10.1093/bioinformatics/btl303. [DOI] [PubMed] [Google Scholar]
- 8.Ofran Y, Mysore V, Rost B. Prediction of DNA-binding residues from sequence. Bioinformatics. 2007;23:i347–i353. doi: 10.1093/bioinformatics/btm174. [DOI] [PubMed] [Google Scholar]
- 9.Res I, Mihalek I, Lichtarge O. An evolution based classifier for prediction of protein interfaces without using protein structures. Bioinformatics. 2005;21:2496–2501. doi: 10.1093/bioinformatics/bti340. [DOI] [PubMed] [Google Scholar]
- 10.Wang B, Chen P, Huang D, Li J, Lok T, Lyu M. Predicting protein interaction sites from residue spatial sequence profile and evolution rate. FEBS Lett. 2005;580:380–384. doi: 10.1016/j.febslet.2005.11.081. [DOI] [PubMed] [Google Scholar]
- 11.Wang L, Yang MQ, Yang JY. Prediction of DNA-binding residues from protein sequence information using random forests. BMC Genomics. 2009;10(Suppl 1):S1. doi: 10.1186/1471-2164-10-S1-S1. [DOI] [PMC free article] [PubMed] [Google Scholar]
- 12.Wu J, Liu H, Duan X, Ding Y, Wu H, Bai Y, Sun X. Prediction of DNA-binding residues in proteins from amino acid sequences using a random forest model with a hybrid feature. Bioinformatics. 2009;25:30–35. doi: 10.1093/bioinformatics/btn583. [DOI] [PMC free article] [PubMed] [Google Scholar]
- 13.Hwang S, Gou Z, Kuznetsov IB. DP-Bind: a web server for sequence-based prediction of DNA-binding residues in DNA-binding proteins. Bioinformatics. 2007;23:634–636. doi: 10.1093/bioinformatics/btl672. [DOI] [PubMed] [Google Scholar]
- 14.Tsuchiya Y, Kinoshita K, Nakamura H. Structure-based prediction of DNA-binding sites on proteins using the empirical preference of electrostatic potential and the shape of molecular surfaces. Proteins. 2004;55:885–894. doi: 10.1002/prot.20111. [DOI] [PubMed] [Google Scholar]
- 15.Tsuchiya Y, Kinoshita K, Nakamura H. PreDs: a server for predicting dsDNA-binding site on protein molecular surfaces. Bioinformatics. 2005;21:1721–1723. doi: 10.1093/bioinformatics/bti232. [DOI] [PubMed] [Google Scholar]
- 16.Tjong H, Zhou H-X. DISPLAR: an accurate method for predicting DNA-binding sites on protein surfaces. Nucleic Acids Res. 2007;35:1465–1477. doi: 10.1093/nar/gkm008. [DOI] [PMC free article] [PubMed] [Google Scholar]
- 17.Ahmad S, Gromiha MM, Sarai A. Analysis and prediction of DNA binding proteins and their binding residues based on composition, sequence and structural information. Bioinformatics. 2004;20:477–486. doi: 10.1093/bioinformatics/btg432. [DOI] [PubMed] [Google Scholar]
- 18.Keil M, Exner TE, Brickmann J. Pattern recognition strategies for molecular surfaces: III. Binding site prediction with a neural network. J. Comput. Chem. 2004;25:779–789. doi: 10.1002/jcc.10361. [DOI] [PubMed] [Google Scholar]
- 19.Ahmad S, Sarai A. PSSM based prediction of DNA-binding sites in proteins. BMC Bioinformatics. 2005;6:33. doi: 10.1186/1471-2105-6-33. [DOI] [PMC free article] [PubMed] [Google Scholar]
- 20.Kuznetsov IB, Gou Z, Li R, Hwang S. Using evolutionary and structural information to predict DNA-binding sites on DNA-binding proteins. Proteins. 2006;64:19–27. doi: 10.1002/prot.20977. [DOI] [PubMed] [Google Scholar]
- 21.Chu W, Huang Y, Huang C, Cheng Y, Huang C, Oyang Y. ProteDNA: a sequence-based predictor of sequence-specific DNA-binding residues in transcription factors. Nucleic Acids Res. 2009;37:W396–W401. doi: 10.1093/nar/gkp449. [DOI] [PMC free article] [PubMed] [Google Scholar]
- 22.Wang L, Brown SJ. BindN: a web-based tool for efficient prediction of DNA and RNA binding sites in amino acid sequences. Nucleic Acids Res. 2006;34:W243–W248. doi: 10.1093/nar/gkl298. [DOI] [PMC free article] [PubMed] [Google Scholar]
- 23.Gao M, Skolnick J. From nonspecific DNA-protein encounter complexes to the prediction of DNA-protein interactions. PLoS Comput. Biol. 2009;5:e1000341. doi: 10.1371/journal.pcbi.1000341. [DOI] [PMC free article] [PubMed] [Google Scholar]
- 24.Gao M, Skolnick J. A threading-based method for the prediction of DNA-binding proteins with application to the human genome. PLoS Comput. Biol. 2009;5:e1000567. doi: 10.1371/journal.pcbi.1000567. [DOI] [PMC free article] [PubMed] [Google Scholar]
- 25.Jones S, van Heyningen P, Berman HM, Thornton JM. Protein-DNA interactions: a structural analysis. J. Mol. Biol. 1999;287:877–896. doi: 10.1006/jmbi.1999.2659. [DOI] [PubMed] [Google Scholar]
- 26.Sathyapriya R, Vijayabaskar MS, Saraswathi V. Insights into protein-DNA interactions through structure network analysis. PLoS Comput. Biol. 2008;4:e1000170. doi: 10.1371/journal.pcbi.1000170. [DOI] [PMC free article] [PubMed] [Google Scholar]
- 27.Lejeune D, Delsaux N, Charloteaux B, Thomas A, Brasseur R. Protein-nucleic acid recognition: statistical analysis of atomic interactions and influence of DNA structure. Proteins. 2005;61:258–271. doi: 10.1002/prot.20607. [DOI] [PubMed] [Google Scholar]
- 28.Luscombe NM, Laskowski RA, Thornton JM. Amino acid-base interactions: a three dimensional analysis of protein-DNA interactions at an atomic level. Nucleic Acids Res. 2001;29:2860–2874. doi: 10.1093/nar/29.13.2860. [DOI] [PMC free article] [PubMed] [Google Scholar]
- 29.Luscombe NM, Thornton JM. Protein-DNA interactions: amino acid conservation and the effects of mutations on binding specifity. J. Mol. Biol. 2002;320:991–1009. doi: 10.1016/s0022-2836(02)00571-5. [DOI] [PubMed] [Google Scholar]
- 30.Panchenko AR, Kondrashov F, Bryant S. Prediction of functional sites by analysis of sequence and structure conservation. Protein Sci. 2004;13:884–892. doi: 10.1110/ps.03465504. [DOI] [PMC free article] [PubMed] [Google Scholar]
- 31.Nimrod G, Glaser F, Steinberg D, Ben-Tal N, Pupko T. In silico identification of functional regions in proteins. Bioinformatics. 2005;21:i328–i337. doi: 10.1093/bioinformatics/bti1023. [DOI] [PubMed] [Google Scholar]
- 32.Nimrod G, Schushan M, Steinberg DM, Ben-Tal N. Detection of functionally important regions in 'hypothetical proteins' of known structure. Structure. 2008;16:1755–1763. doi: 10.1016/j.str.2008.10.017. [DOI] [PubMed] [Google Scholar]
- 33.Nimrod G, Szilagyi A, Leslie C, Ben-Tal N. Identification of DNA-binding Proteins using structural, electrostatic and evolutionary features. J. Mol. Biol. 2009;387:1040–1053. doi: 10.1016/j.jmb.2009.02.023. [DOI] [PMC free article] [PubMed] [Google Scholar]
- 34.Haliloglu T, Bahar I, Erman B. Gaussian dynamics of folded proteins, Phys. Rev. Lett. 1997;79:3090. [Google Scholar]
- 35.Bahar I, Atilgan AR, Erman B. Direct evaluation of thermal fluctuations in proteins using a single-parameter harmonic potential. Fold. Des. 1997;2:173. doi: 10.1016/S1359-0278(97)00024-2. [DOI] [PubMed] [Google Scholar]
- 36.Bahar I, Atilgan AR, Demirel MC, Erman B. Vibrational dynamics of folded proteins: significance of slow and fast motions in relation to function and stability, Phys. Rev. Lett. 1998;80:2733–2736. [Google Scholar]
- 37.Haliloglu T, Seyrek E, Erman B. Prediction of binding sites in receptor-ligand complexes with the Gaussian network model. Phys. Rev. Lett. 2008;100:228102. doi: 10.1103/PhysRevLett.100.228102. [DOI] [PubMed] [Google Scholar]
- 38.Haliloglu T, Keskin O, Ma B, Nussinov R. How similar are protein folding and protein binding nuclei? Examination of fluctuations of energy hot spots and conserved residues. Biophys. J. 2005;88:1552–1559. doi: 10.1529/biophysj.104.051342. [DOI] [PMC free article] [PubMed] [Google Scholar]
- 39.Ertekin A, Nussinov R, Haliloglu T. Association of putative protein binding sites with the fluctuation behavior of residues. Protein Sci. 2006;15:2265–2277. doi: 10.1110/ps.051815006. [DOI] [PMC free article] [PubMed] [Google Scholar]
- 40.Rader AJ, Bahar I. Folding core predictions from network models of proteins. Polymer. 2004;45:659–668. [Google Scholar]
- 41.Haliloglu T, Erman B. Analysis of correlations between energy and residue fluctuations in native proteins and determination of specific sites for binding. Phys. Rev. Lett. 2009;102:088103. doi: 10.1103/PhysRevLett.102.088103. [DOI] [PubMed] [Google Scholar]
- 42.Landau M, Mayrose I, Rosenberg Y, Glaser F, Martz E, Pupko T, Ben-Tal N. ConSurf: the projection of evolutionary conservation scores of residues on protein structures. Nucleic Acids Res. 2005;33:W299–W302. doi: 10.1093/nar/gki370. [DOI] [PMC free article] [PubMed] [Google Scholar]
- 43.Laskowski RA. Enhancing the functional annotation of PDB structures in PDBsum using key figures extracted from the literature. Bioinformatics. 2007;23:1824–1827. doi: 10.1093/bioinformatics/btm085. [DOI] [PubMed] [Google Scholar]
- 44.Luscombe NM, Laskowski RA, Thornton JM. NUCPLOT: a program to generate schematic diagrams of protein-nucleic acid interactions. Nucleic Acids Res. 1997;25:4940–4945. doi: 10.1093/nar/25.24.4940. [DOI] [PMC free article] [PubMed] [Google Scholar]
- 45.van Dijk M, Bonvin AMJJ. A protein-DNA docking benchmark. Nucleic Acids Res. 2008;36:e88. doi: 10.1093/nar/gkn386. [DOI] [PMC free article] [PubMed] [Google Scholar]
- 46.Wang G, Dunbrack RL., Jr PISCES: a protein sequence culling server. Bioinformatics. 2003;19:1589–1591. doi: 10.1093/bioinformatics/btg224. [DOI] [PubMed] [Google Scholar]
- 47.Passner JM, Steitz TA. The structure of a CAP-DNA complex having two cAMP molecules bound to each monomer. Proc Natl. Acad Sci USA. 1997;94:2843–2847. doi: 10.1073/pnas.94.7.2843. [DOI] [PMC free article] [PubMed] [Google Scholar]
- 48.Passner JM, Schultz SC, Steitz TA. Modeling the cAMP-induced allosteric transition using the crystal structure of CAP-cAMP at 2.1 A resolution. J. Mol. Biol. 2000;304:847–859. doi: 10.1006/jmbi.2000.4231. [DOI] [PubMed] [Google Scholar]
- 49.Popovych N, Tzeng SR, Tonelli M, Ebright RH, Kalodimos CG. Structural basis for cAMP-mediated allosteric control of the catabolite activator protein. Proc. Natl Acad. Sci. USA. 2009;106:6927–6932. doi: 10.1073/pnas.0900595106. [DOI] [PMC free article] [PubMed] [Google Scholar]
Associated Data
This section collects any data citations, data availability statements, or supplementary materials included in this article.