Abstract
CPHmodels-3.0 is a web server predicting protein 3D structure by use of single template homology modeling. The server employs a hybrid of the scoring functions of CPHmodels-2.0 and a novel remote homology-modeling algorithm. A query sequence is first attempted modeled using the fast CPHmodels-2.0 profile–profile scoring function suitable for close homology modeling. The new computational costly remote homology-modeling algorithm is only engaged provided that no suitable PDB template is identified in the initial search. CPHmodels-3.0 was benchmarked in the CASP8 competition and produced models for 94% of the targets (117 out of 128), 74% were predicted as high reliability models (87 out of 117). These achieved an average RMSD of 4.6 Å when superimposed to the 3D structure. The remaining 26% low reliably models (30 out of 117) could superimpose to the true 3D structure with an average RMSD of 9.3 Å. These performance values place the CPHmodels-3.0 method in the group of high performing 3D prediction tools. Beside its accuracy, one of the important features of the method is its speed. For most queries, the response time of the server is <20 min. The web server is available at http://www.cbs.dtu.dk/services/CPHmodels/.
INTRODUCTION
Sequence profiles have a broad application in the field of bioinformatics prediction algorithms dating back to the pioneering work by Rost and Sander (1). The field of protein structure prediction has largely benefited from this work, and most high-performing algorithms for protein homology modeling use sequence profiles as their main vehicle (2–4). Prediction of local protein structure features can also improve when sequence profiles are used to represent the protein sequences (5–7). Here, we use a scheme for close and remote homology modeling building on these findings. Two protein sequences are aligned using local sequence alignment with a scoring matrix constructed by combining sequence profiles, and local protein structural features such as: secondary structure and relative surface accessibility.
The use of such local protein structural features improves the alignment accuracy. The fold recognition ability is further improved by the use of a double-sided Z-score and a baseline correction for sequence length and amino acid composition.
The method has been implemented as a web server with a simple user interface. Here, we describe the server and evaluate its performance on 117 target sequences that were modeled during the CASP8 competition.
METHODS
Benchmark data
The combinatorial extension program CE (9) was used to construct two benchmark data sets. Pairs of PDB structures were chosen that could be superimposed with a CE Z-score >3.8 and with a mutual sequence identity less than 40%. A Hobohm 1 algorithm (10) was used to identify clusters of structural similar proteins, and a maximum of 10 structures per cluster were included. This procedure leaves us with a training and test set of 1377 and 690 protein pairs, respectively.
CPHmodels-2.0
A position-specific scoring matrix (PSSM) is generated for a query sequence by searching for up to five iterations with default settings, against a local version of the Uniprot database using PsiBlast (8). After each iteration, the PSSM generated by Blast is saved and used to search for a template in PDB. Provided that a template is found with a Blast e-value <10−5, a PSSM is also generated for the template using the same number of Blast iteration as for the query. Next, the query is aligned to the template using a scoring matrix that at each position is calculated as the average the score of the template sequence in the query PSSM and the query sequence in the template PSSM. This query–template alignment is accepted as a reliable model provided a Blast e-value <10−5 and sequence identity >30%.
CPHmodels-3.0
In situations where the query sequence is a difficult target and no suitable template or alignment was found using the setup described for CPHmodels-2.0, it is necessary to search for a template using a refined algorithm that is computationally more costly. This includes a PsiBlast search against a reduced non-redundant protein sequence database (nr), profile-profile alignment including predicted local structure information obtained from NetSurfP (7), and a double-sided Z-score evaluation. The predicted local structural features include secondary structure and relative surface accessibility. We describe the different steps involved in this remote-homology modeling procedure in the Supplementary Material.
Modeling
Once the best template has been found, Cα-atom coordinates are extracted according to the sequence alignment and used as a starting point for the homology-modeling process. Missing atoms were added using the segmod (11) program and the structure was refined using the encad program (12), both from the GeneMine package (www.bioinformatics.ucla.edu/genemine/).
EVALUATION RESULTS
Optimizing the alignment parameters
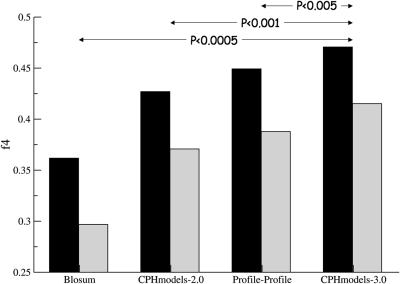
Optimal alignment parameters were estimated on the benchmark training data set to maximize the fraction on correctly aligned residues within 4 Å to the position in the crystal structure. This measure is commonly known as the f4 measure. The result of this benchmark calculation is shown in Figure 1. For the CPHmodels-3.0 method, we find that an average of 47% and 42% of the residues are correctly aligned for the training and test data sets, respectively. These numbers are significantly higher than what is obtained using any of the other three methods included in the benchmark (P < 0.005, in all cases, binomial test).
Figure 1.
Fraction of correctly aligned residue pairs. The f4 measure is shown for the protein pairs in the benchmark training and test sets in black and gray, respectively. The four methods shown are; Blosum: Blosum62 with conventional gap penalties, CPHmodels-2.0: The original CPHmodels-2.0 server. Profile–profile: Sequence profile-based scoring function. CPHmodels-3.0: The profile and local structure based-scoring function proposed here. P-values are calculated using binomial test.
Fold recognition
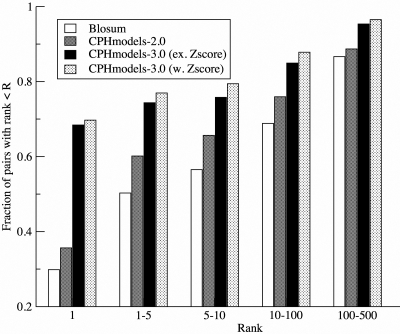
The method was next benchmarked to validate the ability to identify the correct fold. The test set is composed of 690 query–target pairs and some sequences can appear more than once as either a query or a target sequence. In total, the test set is formed by a unique set of 1216 PDB chains. Each query sequence in the test set was aligned against the same pool of 1216 representative template structures. Next, the performance of the prediction methods was evaluated in terms of the rank of the target in the sorted list of template structures. Many templates other than the specific target structure could potentially share structural similarity to the query, and these templates could show up as ‘false’ false positives in the rank analysis even though actually being perfect hits. To exclude these ‘false’ false positives from the rank analysis, all template hits with an alignment score greater than the target in question and a CE structural alignment Z-score to the query structure > 3.8 were removed from the list. In this way only ‘true’ false positive template hits are included when calculating the rank of the target. The result of the benchmark calculation is shown in Figure 2. For the CPHmodels-3.0 method with double-sided Z-score, we find that 74% of the queries in the test data set identifies the correct template within top 10 of the template pool. This performance is significantly higher than what is obtained for the three other methods in the benchmark (P < 0.01 comparing to CPHmodels-3.0, e.g. Z-score, P < 0.001 comparing to both CPHmodels-2.0, and Blosum. P-values are calculated using binomial test).
Figure 2.
Fold recognition benchmark for the test set. The fraction of proteins where the correct template is identified within a given rank is given as the function of the rank. The template pool was filtered to exclude all structural superimposable (CE structural alignment Z-score >3.8) hits except the query/target in question. CPHmodels-3.0 (w. Z-score) is the CPHmodels-3.0 method including double-sided Z-score ranking, CPHmodels-3.0 (e.g. Z-score) is the CPHmodels-3.0 method excluding double-sided Z-score, and the other methods are as in Figure 1.
CASP8 competition
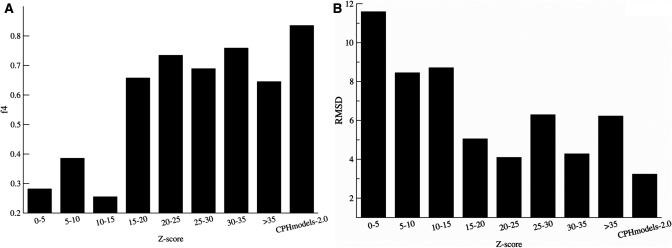
In the CASP8 competition, the CPHmodels-3.0 server submitted models for 117 targets out of 128. For 38 targets with a significant Blast hit, the CPHmodels-2.0 profile log-odds method was used. For the remaining 79 targets, the CPHmodels-3.0 method was used. The performance of the server is summarized in Figure 3. A large fraction of the models (85%) were structurally superimposable [CE structural alignment Z-score above 3.8 (8)] to their target. A Z-score threshold of 10 separates the ‘good’ models with an f4 ≥ 0.6 from the ‘bad’ models with f4 < 0.6. The difference in f4 between the models with a Z-score above and the models with a Z-score < 10 is highly statistically significant (P < 0.001, t-test). The average RMSD for models with a Z-score > 10 is 4.6 Å, and the average RMSD for the models with a Z-score < 10 is 9.3 Å. This difference is highly statistically significant (P < 0.001, t-test). A total of 95% (51/54) of the models with a Z-score >10 shared structural similarity to their target.
Figure 3.
(A) Histogram of fraction correctly modeled residues (f4) as a function of the double-sided Z-score. (B) Histogram of RMSD as a function of the double-sided Z-score. The CPHmodels-2.0 bar refers to hits with Blast e-values <10−5 and sequence identity >30% modeled using the CPHmodels-2.0 method.
We have evaluated the performance of the CPHmodels-3.0 server using the data from the official CASP8 result page. Here, 72 of the 174 registered methods competed in the class for automatic servers, and 66 of these made predictions for >80% of the targets. Among these, CPHmodels-3.0 achieved an average rank of 24 on the 164 TBM & FM domains from all targets when sorting on the different quality measures (Table 1).
Table 1.
Performance rank of the CPHmodels-3.0 method in the CASP8 competition
| Measure | Rank |
|---|---|
| Cumulative Z-score (GDT_TS) | 37 |
| AVG GDT_TS | 25 |
| Cumulative Z-score (AL0P) | 36 |
| AVG AL0P | 11 |
| Cumulative Z-score (GDT_HA) | 40 |
| AVG GDT_HA | 25 |
| AVG DAL_4 | 17 |
| AVG Mammoth (Z-score) | 5 |
| AVG DALI (Z-score) | 20 |
| Average | 24 |
The rank is calculated by comparing the performance of CPHmodels-3.0 to each of 66 prediction methods that participated in the CASP8 competition as automated servers and made predictions for >80% of the targets. Data and performance measures are taken from the official CASP8 result page (http://predictioncenter.org/casp8/groups_analysis.cgi).
CPHmodels-3.0 was thus well in the top half of the servers which made predictions for most of the domains. It must be noted that CPHmodels-3.0 is a single template server and ranking especially in the cumulative scores may have been better if the more than one domain had been modeled for some of the targets (excluding the cumulative scores performance measures improves the rank to 17). Multi-domain modeling is something the user can do manually by resubmitting un-modeled parts of the sequence to the server. One other important aspect of the server is its speed. For most queries in the CASP competition, the response time of the server was <20 min.
WEB SERVER
One of the aims when implementing the CPHmodels-3.0 was to make a front-end that was easy to understand for users without any prior knowledge of homology modeling, and at the same time provide a result that is as accurate as possible. A detailed description of the server including a flowchart is given in Supplementary Material.
Input
The input to the web server is a raw text file (i.e. not MS Word™ or other formatted format) containing a single sequence in FASTA format. Optionally the sequence can be pasted into a text field. After submitting a job, the website will update until the result appear, but a web link is also provided for the user to bookmark or the result link can be mailed when the job has finished.
Output
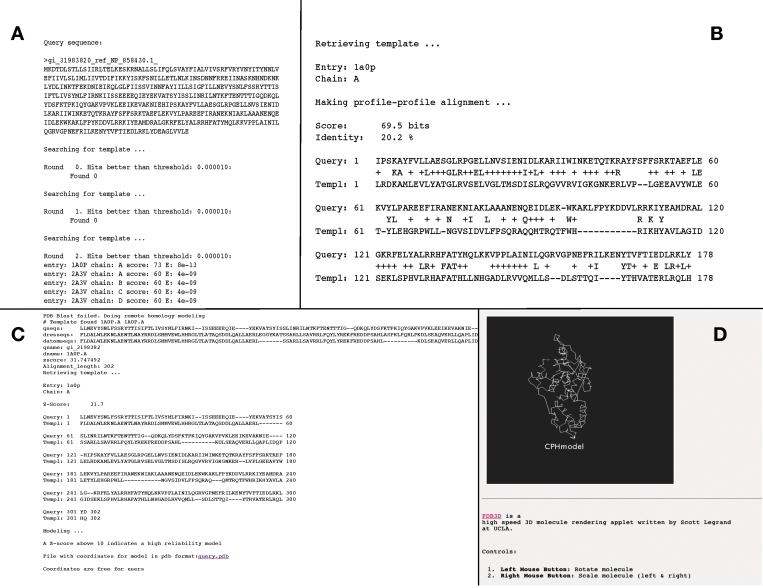
Example of the output is shown in Figure 4. The output is divided into the following sections:
Query sequence: in this section, the query sequence that is submitted is shown in FASTA format (Figure 4A).
Searching for template (PDB-Blast): hits obtained each round from PDB using the profile matrix generated by PsiBLAST against a UniProt database, including the significance given as the e-value (Figure 4A).
Retrieving template: if any significant hits were found in the PDB database in the above search, the pdb entry name and the chain identifier are listed for the template that is used to construct the model (Figure 4B).
Making profile–profile alignment: in this section, the score from the profile–profile alignment (in bits) and the percentage sequence identity between query and template are shown together with the alignment in ‘Blast-like’ format (Figure 4B)
Remote homology modeling: if no significant hits were found in the PDB-Blast search, or the fraction of identical amino acids in the profile–profile alignment is <30%, the remote homology step is performed (Figure 4C).
The output from the remote homology template search is described below (Figure 4C).
qseqs: The raw query sequence aligned in a unwrapped format.
dresseqs: The raw sequence of the model template aligned in an unwrapped format.
datomseqs: The part of the model template sequence for which atom coordinates exist in the PDB entry aligned with the former two sequences in an unwrapped format.
qname: Query name from input.
dname: 1A0P.A PDB entry name and chain of model template.
zscore: Z-score of alignment.
Alignment_length: length of the alignment (i.e. the length of the part of the template that can be modeled, including insertions).
Next, is the final formatted alignment of the query sequence and the ‘datomseq’ from above.
File with coordinates: by clicking on the link ‘query.pdb’ one can download the coordinates in pdb format.
Interactive figure: if using a java-enabled browser, the C-α trace of the model will be shown. The model can be rotated by clicking with the left mouse button and holding it down while moving the mouse. The right mouse button can be used to scale the model (Figure 4D).
Figure 4.
The output is appearing as one long page. The parts are ordered as appearing from the top. (A) The input query sequence in FASTA format, followed by pdb-hits from searches using a PSIblast PSSM generated against a UniProt database. (B) The resulting sequence alignment of the profile–profile alignment using the PDB-Blast hit. (C) The results from the remote homology modeling (if any). qseqs: The raw query sequence aligned in a unwrapped format. dresseqs: The raw sequence of the model template aligned in an unwrapped format. datomseqs: The part of the model template sequence for which atom coordinates exist in the PDB entry aligned in an unwrapped format. qname: Query name from input. dname: 1A0P.A PDB entry name and chain of model template. zscore: Z-score of alignment. Alignment_length: length of the alignment. Including final alignment and link to file with modeled coordinates in pdb format. (D) Fast-rendering outline of the model.
Final remarks
The CPHmodels-3.0 is an easy to use web server for comparative protein homology modeling. It has in benchmark calculations including the CASP8 competition been shown to have a performance comparable to majority of high-performing 3D prediction tools. The server response time is for most targets very short (<20 min). The method uses an optimized alignment scoring function that beyond secondary structure includes predicted relative surface accessibility, which to our knowledge has not previously been used in publicly available protein homology modeling severs. Also, the method employs a double-sided Z-score to rank individual template hits. This Z-score ranking attempts to reduce the biased imposed by the composition and length of the query and template database sequences on the alignment score, and was shown to significantly improve the overall prediction accuracy.
The current method is single-template based and only makes use of the top one template structure. It is therefore possible to improve the overall performance once a strategy has been implemented to utilize information from multiple templates, as previously demonstrated (13–16). Results from the CASP8 competition has shown that the overall performance of the method (as measured by for instance the cumulative GDT_TS score) could be improved. The server only builds one continuous protein chain model, meaning that for multi-domain proteins, the method might fail to build a model for a second smaller domain. This can be manually overcome by resubmitting the protein sequence once more to the server and obtain a model for the remaining part too and thus increase the coverage of the query sequence (and hence the overall GDT_TS score). However, this does not overcome the problem of structurally relating such models of multiple domains to each other, which is still an unsolved problem by any modeling server.
SUPPLEMENTARY DATA
Supplementary Data are available at NAR Online.
FUNDING
Funding for open access charge: XXX.
Conflict of interest statement. None declared.
Supplementary Material
ACKNOWLEDGEMENTS
We would like to thank Garry Gippert for his input and discussions during the early stages of this work.
REFERENCES
- 1.Rost B, Sander C. Improved prediction of protein secondary structure by use of sequence profiles and neural networks. Proc. Natl Acad. Sci. USA. 1993;90:7558–7562. doi: 10.1073/pnas.90.16.7558. [DOI] [PMC free article] [PubMed] [Google Scholar]
- 2.Soding J, Biegert A, Lupas AN. The HHpred interactive server for protein homology detection and structure prediction. Nucleic Acids Res. 2005;33(Web Server issue):W244–W248. doi: 10.1093/nar/gki408. [DOI] [PMC free article] [PubMed] [Google Scholar]
- 3.Bennett-Lovsey RM, Herbert AD, Sternberg MJE, Kelley LA. Exploring the extremes of sequence/structure space with ensemble fold recognition in the program Phyre. Proteins. 2008;70:611–625. doi: 10.1002/prot.21688. [DOI] [PubMed] [Google Scholar]
- 4.Jaroszewski L, Rychlewski L, Godzik A. Improving the quality of twilight-zone alignments. Protein Sci. 2000;9:1487–1496. doi: 10.1110/ps.9.8.1487. [DOI] [PMC free article] [PubMed] [Google Scholar]
- 5.Petersen TN, Lundegaard C, Nielsen M, Bohr H, Bohr J, Brunak S, Gippert GP, Lund O. Prediction of protein secondary structure at 80% accuracy. Proteins. 2000;41:17–20. [PubMed] [Google Scholar]
- 6.Dor O, Zhou Y. Real-SPINE: an integrated system of neural networks for real-value prediction of protein structural properties. Proteins. 2007;68:76–81. doi: 10.1002/prot.21408. [DOI] [PubMed] [Google Scholar]
- 7.Petersen B, Petersen TN, Andersen P, Nielsen M, Lundegaard C. A generic method for assignment of reliability scores applied to solvent accessibility predictions. BMC Struct. Biol. 2009;9:51. doi: 10.1186/1472-6807-9-51. [DOI] [PMC free article] [PubMed] [Google Scholar]
- 8.Altschul SF, Koonin EV. Iterated profile searches with PSI-BLAST - a tool for discovery in protein databases. TIBS. 1998;23:444–447. doi: 10.1016/s0968-0004(98)01298-5. [DOI] [PubMed] [Google Scholar]
- 9.Shindyalov IN, Bourne PE. Protein structure alignment by incremental combinatorial extension (CE) of the optimal path. Protein Eng. 1998;11:739–747. doi: 10.1093/protein/11.9.739. [DOI] [PubMed] [Google Scholar]
- 10.Hobohm U, Scharf M, Schneider R, Sander C. Selection of representative protein data sets. Protein Sci. 1992;1:409–417. doi: 10.1002/pro.5560010313. [DOI] [PMC free article] [PubMed] [Google Scholar]
- 11.Levitt M. Accurate modeling of protein conformation by automatic segment matching. J. Mol. Biol. 1992;226:507–533. doi: 10.1016/0022-2836(92)90964-l. [DOI] [PubMed] [Google Scholar]
- 12.Levitt M, Hirshberg M, Sharon R, Daggett V. Potential energy function and parameters for simulations of the molecular dynamics of proteins and nucleic acids in solution. Computer Physics Comm. 1995;91:215–231. [Google Scholar]
- 13.Sali A, Potterton L, Yuan F, van Vlijmen H, Karplus M. Evaluation of comparative protein modelling by MODELLER. Proteins. 1995;23:318–326. doi: 10.1002/prot.340230306. [DOI] [PubMed] [Google Scholar]
- 14.Ginalski K, Elofsson A, Fischer D, Rychlewski L. 3D-Jury: a simple approach to improve protein structure predictions. Bioinformatics. 2003;19:1015–1018. doi: 10.1093/bioinformatics/btg124. [DOI] [PubMed] [Google Scholar]
- 15.Larsson P, Wallner B, Lindahl E, Elofsson A. Using multiple templates to improve quality of homology models in automated homology modeling. Protein Sci. 2008;17:990–1002. doi: 10.1110/ps.073344908. [DOI] [PMC free article] [PubMed] [Google Scholar]
- 16.Cheng J. A multi-template combination algorithm for protein comparative modeling. BMC Struct. Biol. 2008;8:18. doi: 10.1186/1472-6807-8-18. [DOI] [PMC free article] [PubMed] [Google Scholar]
Associated Data
This section collects any data citations, data availability statements, or supplementary materials included in this article.


