Abstract
Our web site (http://ekhidna.biocenter.helsinki.fi/dali_server) runs the Dali program for protein structure comparison. The web site consists of three parts: (i) the Dali server compares newly solved structures against structures in the Protein Data Bank (PDB), (ii) the Dali database allows browsing precomputed structural neighbourhoods and (iii) the pairwise comparison generates suboptimal alignments for a pair of structures. Each part has its own query form and a common format for the results page. The inputs are either PDB identifiers or novel structures uploaded by the user. The results pages are hyperlinked to aid interactive analysis. The web interface is simple and easy to use. The key purpose of interactive analysis is to check whether conserved residues line up in multiple structural alignments and how conserved residues and ligands cluster together in multiple structure superimpositions. In favourable cases, protein structure comparison can lead to evolutionary discoveries not detected by sequence analysis.
INTRODUCTION
Comparative analyses of protein sequences and structures play a fundamental role in understanding proteins and their functions. Assuming an evolutionary continuity of structure and function, describing the structural similarity relationships between protein structures allows scientists to infer the functions of newly discovered proteins.
The most widespread purpose of structural alignment has been to identify homologous residues (encoded by the same codon in the genome of a common ancestor). Mutations manifest in plastic deformations, shifts and rotations of the secondary structure elements (SSEs). A wide spectrum of structural alignment methods exist, which differ in their treatment of structural variations, scoring functions and optimization algorithms [reviewed in (1)].
We are aware of half a dozen web servers (2–7) that provide structure comparisons against the current, weekly updated Protein Data Bank (PDB) (Supplementary Table S1). Each server is unique because they employ different structure comparison methods. The Dali server has been around for 15 years in various incarnations (2,8). We have now implemented interactive visualization of user’s structures to the Helsinki server, and present validation data for an improved database search protocol in DaliLite v.3.3.
The primary result of the database search is the list of structural neighbours and their corresponding structural alignment. Usually homologous proteins have stronger structural similarity than convergent folds. However, the amount of structural similarity (we use Z-scores) at the transition between divergent and convergent folds is family specific. Therefore, manual inspection of the results is recommended. Residue conservation is a particularly powerful means of highlighting which are the key residues in the structure, and so can usually help to pick out the most likely location of the protein’s functional site(s) (9–11).
DESCRIPTION OF THE SERVER
Inputs
The input to the server is one or two protein structures in PDB format. The query structure can be specified as a PDB identifier plus chain identifier, or a PDB file uploaded by the user. There are three cross-linked query forms for the Dali server, Dali Database and pairwise comparison, respectively. For example, the entry point to the Dali server is http://ekhidna.biocenter.helsinki.fi/dali_server.
All backbone atoms (N, CA, C, O) are required and the minimum chain length is 30 amino acids. Backbone atoms may be reconstructed from a CA trace using the MaxSprout server at http://www.ebi.ac.uk/maxsprout.
External links to the Dali database should use http://ekhidna.biocenter.helsinki.fi/dali/daliquery?pdbid=1nnn&chainid=A, where 1nnn represents a PDB identifier and chainid is optional. Meta-servers may link to http://ekhidna.biocenter.helsinki.fi/dali/daliquery_txt?pdbid=1nnn&chainid=A, which directly returns the match list and alignment data as plain text.
Processing
Queries to the Dali Database and pairwise comparison are processed interactively; the result is usually returned within a minute. The Dali server processes up to eight PDB searches in parallel, others are queued. Most PDB-search queries are processed in less than an hour. Results are stored on the server for two weeks. The results of identical queries are retrieved instantly from cache.
The Dali server and Dali database return only the best match of the query to each PDB structure. The pairwise comparison returns also suboptimal matches. The pairwise comparison is based on a systematic branch-and-bound search that returns non-overlapping solutions in decreasing order of alignment score (12). Suboptimal matches can be of interest in cases of internal symmetries or repeated domains.
Dali Database is updated twice a year and contains precomputed structural alignments of PDB90 against the full PDB. The query structure is mapped to the closest representative in PDB90 and the structure comparison scores are recomputed using the transitive alignment via the representative.
The Dali server aims to retrieve a list of 500 structural neighbors of the query structure with the highest Z-scores (see Mathematical Appendix in Supplementary Data). Most query structures have strong similarity to a structure already in the PDB. We use fast filters to identify a shortlist of about 100 promising candidates (2). If these produce strong matches, the search proceeds by walking. Otherwise, the query structure is compared with PDB90 in one versus all fashion, followed by a walk to collect matches to redundant PDB structures (which are over 90% sequence identical to PDB90 representatives).
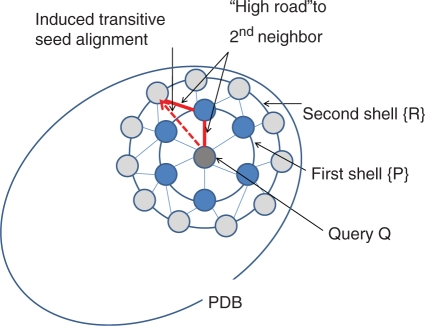
Walking selects targets for structural comparison from the neighbours of neighbours found so far (Figure 1). The second shell of neighbors is known because all structures in the PDB are stored in a precomputed network of similarities. The pairwise alignments (Q,P) and (P,R) induce a transitive alignment (Q,R), which is used as the starting point of refinement rather than optimizing the alignment from scratch. There are many possible choices of intermediate structure P en route from Q to R. We select the ‘high road’, in other words, the minimum of the Z-scores Z(Q,P) and Z(P,R) should be as high as possible. The ‘high road’ may change as more structures are added to the first neighbour shell. To avoid redundant comparisons, we only test induced alignments which are longer than previously obtained ones. When the alignment (Q,R) has been refined, R is added to the first neighbour shell. The walk ends when either there are no new neighbours in the second shell, a specified number of hits (1000) have been reported, or a maximum number of comparisons (1000) have been performed.
Figure 1.
The walking strategy focuses the search for structural neighbours to the neighbourhood of similar structures found so far. A sparse network of alignments within PDB is stored in an internal database. Once query Q is aligned to some PDB structure(s), a complete set of similar structures can be collected by walking, provided that the network is connected and similarity is approximately transitive.
Outputs
The Dali server, Dali Database and pairwise comparison use a common output format and share interactive analysis tools.
The result consists of (i) a list of structural neighbours, ranked by Z-score, and (ii) the alignment data. The results are presented as plain text for downloading by downstream application, and as hypertext for interactive analysis. The default results page reports the top 500 matches to all chains in the PDB. A subset of matches to PDB90, filtered at 90% sequence identity, is provided for convenience.
Selected subsets of matches can be visualized (i) as multiple sequence alignments, or (ii) in multiple 3D superimposition. While sophisticated tools with integrated sequence alignment and structure superimposition views are available, we have chosen Jmol, an open source Java viewer (http://www.jmol.org) for molecular graphics, because it was most easily accessible to the casual user. Each neighbour is aligned (superimposed) against the query structure in a star-like tree topology. Active sites can be recognized by clusters of conserved residues and ligands. Sequence and structure conservation are calculated within the selected subset of matches. Sequence conservation is given by Equation (1):
| (1) |
where i is a position, j represents the 20 natural amino acid types, p is the frequency of an amino acid type in position i of the alignment and q is its frequency in the database.
Structure conservation is given by Equation (2):
| (2) |
where k represents the structural neighbours, N is the number of selected structural neighbours, and  is 1 if position i of structure k is aligned to the query structure and 0 otherwise.
Downloads
The Dali database and the DaliLite software are available for academic use from http://ekhidna.biocenter.helsinki.fi/dali/downloads/download.html.
RESULTS
Benchmarking
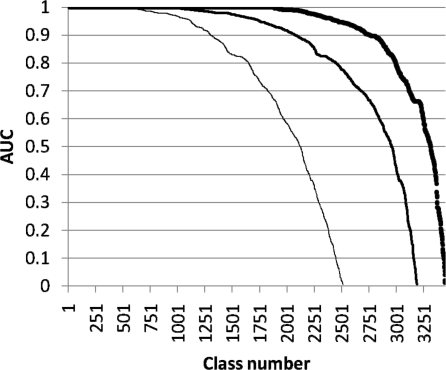
Newly solved protein structures are compared against those in the PDB in the hope of discovering remote evolutionary connections. Homologous proteins should rank at the top of the match list. The ability of the walking strategy to retrieve biologically interesting hits was assessed by comparison with the SCOP classification (13), which is a hierarchical classification of protein structures and curated by experts. The area under the coverage-reliability plot (AUC) was used for assessment. The average AUC per query is 0.79, 0.87 and 0.92 at fold, superfamily and family level, respectively (Figure 2).
Figure 2.
Benchmarking the walking strategy. The plots show the distribution of AUC values for single-domain queries in scop 1.75. AUC, where coverage is TP/T and reliability is TP/P with T the number of members of a scop class, P number of matches above a given Z-score, and TP the number of members of a scop class above a given Z-score. Evaluated classes are scop folds (thin line), scop superfamilies (medium thick line) and scop families (thick line). Classes with fewer than 10 or more than 500 members are excluded. Query structures consisted of single domains from scop classes a-d, filtered at 90% sequence identity. Matches to all PDB structures which contained an instance of a domain in scop classes a-d were included in the evaluation.
A number of factors influence this evaluation. First, it has been shown that ranking by Z-scores as in Dali, or by other measures of structural similarity, approximates but does not reproduce the scop hierarchy at any cut-offs; the scop classification considers also other criteria than structural similarity (14). Secondly, the sampling of a structural neighbourhood during walking is dependent on the connectivity of the underlying (sparse) network of precomputed structural similarities. Thirdly, our measures of structural similarity are not metric, which means that matches cannot be retrieved in strictly decreasing order of Z-scores. Fourthly, optimization from the seed alignment may or may not converge to the global optimum. Finally, relaxed criteria are often used to account for inconsistencies and possible classification errors in SCOP; for example, pairs with different superfamily but identical fold would be excluded from the evaluation of superfamily recognition (15). Here, the ‘true positive’ set consists of all pairs with identical SCOP classification and the ‘false positive’ set contains all other pairs above a given Z-score in the match list. The evaluation thus gives an underestimate of accuracy.
Example
As an example, we have selected a putative bacterial cell invasion protein (PDB entry 3kk7). The protein contains a membrane-attack complex/perforin (MACPF) domain. The same fold is utilized for defence in the immune system and for attack in bacterial cholesterol-dependent cytolysins (CDCs). The three key pieces of evidence for homology are functional similarity (pore formation), conservation of three glycine residues at a hinge and conservation of the complex core fold (16–18).
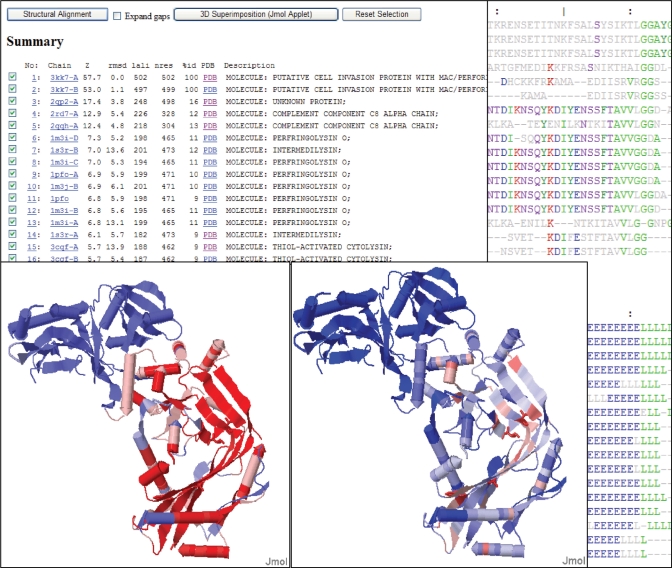
Interactive analysis (Figure 3) starts with eyeballing the match list. Dali retrieves the entire superfamily. Contact map-based methods such as Dali are tolerant of structural plasticity and typically generate longer alignments than methods based on root mean square deviation (RMSD) criteria. The extent of the common core is clearly seen when structural conservation is mapped onto the query structure. Conserved residues can be identified in the multiple sequence alignment as well as highlighted in the 3D structure.
Figure 3.
Using 3kk7A as query, the Dali server produces several views of the result, including: match list (top left), sequence view (top right), secondary structure view (bottom right), mapping of structural conservation (bottom left) and mapping of sequence conservation (middle bottom). The match list is sorted by Z-scores. The sequence view uses colour for amino acids which have a frequency above 0.5 in a column. The secondary structure view displays the alignment of helices (H), strands (E) and loops (L) as defined by DSSP. Sequence and structural conservation is computed within the selected subset of matches; red positions are maximally conserved and blue positions are not conserved.
CONCLUSIONS
In favourable cases, structural neighbours give clues of molecular function. The Dali server performs the search and provides convenient visualization tools to map conservation in 3D.
The Dali server has evolved to cope with the growth of the PDB, which is now a hundred times bigger than when the server started (8). Hundreds of new entries are added to the PDB every week. One versus all comparison is not affordable and overly aggressive pruning of search space may lose interesting matches. We think that the Dali server is operating with a satisfactory balance between speed and sensitivity.
SUPPLEMENTARY DATA
Supplementary Data are available at NAR Online.
FUNDING
Funding from Academy of Finland project 109849. Funding for open access charge: Biocenter Finland
Conflict of interest statement. None declared.
Supplementary Material
REFERENCES
- 1.Hasegawa H, Holm L. Advances and pitfalls of protein structural alignment. Curr. Opin. Struct. Biol. 2009;19:381–389. doi: 10.1016/j.sbi.2009.04.003. [DOI] [PubMed] [Google Scholar]
- 2.Holm L, Kääriäinen S, Rosenstrom P, Schenkel A. Searching protein structure databases with DaliLite v.3. Bioinformatics. 2008;24:2780–2781. doi: 10.1093/bioinformatics/btn507. [DOI] [PMC free article] [PubMed] [Google Scholar]
- 3.Veeramalai M, Ye YZ, Godzik A. TOPS++FATCAT: Fast flexible structural alignment using constraints derived from TOPS+ string model. BMC Bioinformatics. 2008;9 doi: 10.1186/1471-2105-9-358. Art. No. 358. [DOI] [PMC free article] [PubMed] [Google Scholar]
- 4.Kawabata T, Nishikawa K. Protein tertiary structure comparison using the Markov transition model of evolution. Proteins. 2000;41:108–122. [PubMed] [Google Scholar]
- 5.Krissinel E, Henrick K. Secondary-structure matching (SSM), a new tool for fast protein structure alignment in three dimensions. Acta Cryst. 2004;D60:2256–2268. doi: 10.1107/S0907444904026460. [DOI] [PubMed] [Google Scholar]
- 6.Gibrat J-F, Madej T, Bryant SH. Surprising similarities in structure comparison. Curr. Opin. Struct. Biol. 1996;6:377–385. doi: 10.1016/s0959-440x(96)80058-3. [DOI] [PubMed] [Google Scholar]
- 7.Leslin CM, Abyzov A, Ilyin VA. TOPOFIT-DB, a database of protein structural alignments based on the TOPOFIT method. Nucleic Acids Res. 2007;35:D317–D321. doi: 10.1093/nar/gkl809. [DOI] [PMC free article] [PubMed] [Google Scholar]
- 8.Holm L, Sander C. Dali: a network tool for protein structure comparison. Trends Biochem. Sci. 1995;20:478–480. doi: 10.1016/s0968-0004(00)89105-7. [DOI] [PubMed] [Google Scholar]
- 9.Lichtarge O, Sowa ME. Evolutionary predictions of binding surfaces and interactions. Curr. Opin. Struct. Biol. 2002;12:21–27. doi: 10.1016/s0959-440x(02)00284-1. [DOI] [PubMed] [Google Scholar]
- 10.Landau M, Mayrose I, Rosenberg Y, Glaser F, Martz E, Pupko T, Ben-Tal N. ConSurf: the projection of evolutionary conservation scores of residues on protein structures. Nucleic Acids Res. 2005;33:W299–W302. doi: 10.1093/nar/gki370. [DOI] [PMC free article] [PubMed] [Google Scholar]
- 11.Laskowski RA, Watson JD, Thornton JM. ProFunc: a server for predicting protein function from 3D structure. Nucleic Acids Res. 2005;33:W89–W93. doi: 10.1093/nar/gki414. [DOI] [PMC free article] [PubMed] [Google Scholar]
- 12.Holm L, Sander C. Mapping the protein universe. Science. 1996;273:595–603. doi: 10.1126/science.273.5275.595. [DOI] [PubMed] [Google Scholar]
- 13.Andreeva A, Howorth D, Chandonia J.-M, Brenner SE, Hubbard T.JP, Chothia C, Murzin AG. Data growth and its impact on the SCOP database: new developments. Nucleic Acids Res. 2007;36:D419–D425. doi: 10.1093/nar/gkm993. [DOI] [PMC free article] [PubMed] [Google Scholar]
- 14.Sam V, Tai CH, Garnier J, Gibrat JF, Lee B, Munson PJ. ROC and confusion analysis of structure comparison methods identify the main causes of divergence from manual protein classification. BMC Bioinformatics. 2006;7:206. doi: 10.1186/1471-2105-7-206. [DOI] [PMC free article] [PubMed] [Google Scholar]
- 15.Lindahl E, Elofsson A. Identification of related proteins on family, superfamily and fold level. J. Mol. Biol. 2000;295:613–625. doi: 10.1006/jmbi.1999.3377. [DOI] [PubMed] [Google Scholar]
- 16.Rosado CJ, Buckle AM, Law RH, Butcher RE, Kan WT, Bird CH, Ung K, Browne KA, Baran K, Bashtannyk-Puhalovich TA, et al. A common fold mediates vertebrate defense and bacterial attack. Science. 2007;317:1548–1551. doi: 10.1126/science.1144706. [DOI] [PubMed] [Google Scholar]
- 17.Hadders MA, Beringer DX, Gros P. Structure of C8alpha-MACPF reveals mechanism of membrane attack in complement immune defense. Science. 2007;317:1552–1554. doi: 10.1126/science.1147103. [DOI] [PubMed] [Google Scholar]
- 18.Lukoyanova N, Saibil HR. Friend or foe: the same fold for attack and defense. Trends Immunol. 2008;29:51–53. doi: 10.1016/j.it.2007.11.003. [DOI] [PubMed] [Google Scholar]
Associated Data
This section collects any data citations, data availability statements, or supplementary materials included in this article.


