


Abstract
Many protein families contain sub-families with functional specialization, such as binding different ligands or being involved in different protein–protein interactions. A small number of amino acids generally determine functional specificity. The identification of these residues can aid the understanding of protein function and help finding targets for experimental analysis. Here, we present multi-Harmony, an interactive web sever for detecting sub-type-specific sites in proteins starting from a multiple sequence alignment. Combining our Sequence Harmony (SH) and multi-Relief (mR) methods in one web server allows simultaneous analysis and comparison of specificity residues; furthermore, both methods have been significantly improved and extended. SH has been extended to cope with more than two sub-groups. mR has been changed from a sampling implementation to a deterministic one, making it more consistent and user friendly. For both methods Z-scores are reported. The multi-Harmony web server produces a dynamic output page, which includes interactive connections to the Jalview and Jmol applets, thereby allowing interactive analysis of the results. Multi-Harmony is available at http://www.ibi.vu.nl/ programs/shmrwww.
INTRODUCTION
Many protein families contain sub-families that exhibit functional specialization, often involving differences in ligand binding or protein–protein interactions (1). Consequently, an increasing number of methods and/or web applications has become available, which offer functional analyses of specificity-determining residues within protein families (2–10). These methods often require a multiple sequence alignment (MSA) with pre-determined groups or a phylogenetic tree as input. SDPpred (3) uses mutual information to identify positions that ‘are well conserved within specificity groups but differ between these groups’. PROUST-II (11) is a method based on cumulative relative entropy of the differences between hidden Markov profiles of user-defined sub-families.
Other methods only require the MSA and automatically group the sequences into sub-groups using, for example, Between Group Analysis (6) or phylogeny (2,12). Xdet (13) uses a classification derived from the alignment, and is based on mutual behaviour analysis of ‘tree-determinant’ residues. It can also be used, supervised by supplying an external (functional) classification. ProteinKeys (14) implements combinatorial entropy optimization to identify both specificity-determining residues and sub-families. A more recent method by Georgi et al. (10) requires only sequences and carries out sub-group discovery with simultaneous identification of functional residues.
Identifying specificity-determining residues in proteins has proved a difficult task (15) and methods have varying, but often modest success rates in determining these sites. Therefore, three different methods were combined by Chakrabarti and Panchenko (15) in an ensemble approach, and the predicted sites were studies in 3D context.
We here present a new interactive web server for the detection of sub-type specific sites in proteins. It combines improved versions of the validated Sequence Harmony (SH) (5,16) and multi-Relief (mR) (8) methods in a single server, multi-Harmony. SH is based on Shannon's entropy and determines to what extent amino acid compositions between groups differ. mR identifies residues based on the feature weighting algorithm RELIEF (17). We have generalized SH to handle multiple sub-groups, reimplemented mR and compare their performance relative to four methods: SDPpred (3), ProteinKeys (14), PROUST-II (11) and Xdet (13).
In this article, we will guide the user through all stages of the multi-Harmony web application. We will look for sub-type-specific sites for the five sub-families of the Smad protein family. The sub-type-specific sites found are the best candidates to explain functional differences. Other relevant applications of the method include protein–protein interaction (18), ligand specificity and combinations of both (19).
METHODS
Algorithms
Below, we briefly outline the Sequence Harmony and multi-Relief algorithms. For further details on the SH and mR algorithms, we refer to our earlier work (5,8,16) and the online documentation on the web server.
Multi Sequence Harmony
SH now has been generalized to handle more than two sequence groups. This generalization goes in two stages. First, the sum of residue probabilities ( ) in the two groups
  and
and  , used in the original SH Equation (5), has been extended to
  groups as follows:
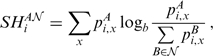 |
where  is the probability of residue type
  in group
  at position
  . Shannon's ‘alphabet size’
  for
for  amino acid types and
  sequences in a group is used as base for the logarithm. Second, the average is generalized as:
  . SH values range from zero for completely non-overlapping residue compositions, to one for identical compositions. A toy example with some typical columns and corresponding SH values is presented in Table 1.
Table 1.
Hypothetical alignment of three sub-families to illustrate the SH scores (range from 0 to 1) and mR weights (range from −1 to 1)
| Alignment position |
Distance matrix |
|||||||||||||||||
|---|---|---|---|---|---|---|---|---|---|---|---|---|---|---|---|---|---|---|
| 1 | 2 | 3 | 4 | 5 | 6 | 7 | 8 | 1 | 2 | 3 | 4 | 1 | 2 | 3 | 1 | 2 | 3 | |
| Group 1 | ||||||||||||||||||
| seq1 | R | E | L | A | A | K | K | A | – | 2 | 4 | 4 | 6 | 7 | 5 | 7 | 7 | 6 |
| seq2 | R | E | L | A | F | K | K | I | 2 | – | 4 | 3 | 6 | 7 | 4 | 7 | 6 | 6 |
| seq3 | R | E | A | A | Y | R | K | L | 4 | 4 | – | 2 | 4 | 5 | 6 | 5 | 6 | 6 |
| seq4 | R | E | A | A | F | R | K | M | 4 | 3 | 2 | – | 5 | 6 | 5 | 6 | 5 | 7 |
| Group 2 | ||||||||||||||||||
| seq1 | H | N | V | A | Y | R | K | K | 6 | 6 | 4 | 5 | – | 1 | 3 | 4 | 5 | 5 |
| seq2 | H | N | V | F | Y | R | K | K | 7 | 7 | 5 | 6 | 1 | – | 4 | 3 | 4 | 4 |
| seq3 | H | N | S | A | F | K | K | K | 5 | 4 | 6 | 5 | 3 | 4 | – | 6 | 5 | 5 |
| Group 3 | ||||||||||||||||||
| seq1 | H | S | F | F | Y | R | K | Q | 7 | 7 | 5 | 6 | 4 | 3 | 6 | – | 3 | 3 |
| seq2 | H | S | M | F | F | R | K | R | 7 | 6 | 6 | 5 | 5 | 4 | 5 | 3 | – | 3 |
| seq3 | H | S | M | F | Y | K | K | S | 6 | 6 | 6 | 7 | 5 | 4 | 5 | 3 | 3 | – |
| SH | 0.42 | 0.00 | 0.00 | 0.57 | 0.87 | 0.99 | 1.00 | 0.00 | ||||||||||
| mR | 1.00 | 1.00 | 0.67 | 1.00 | −0.42 | −0.19 | 0.00 | 0.50 | ||||||||||
The distance matrix is used by mR to find ‘nearest hits’ (within group; in bold italic) and ‘nearest misses’ (between groups; in bold) for each sequence.
multi-Relief
mR works by iterating RELIEF over pairs of groups and returning the average over the positive weights per position, or over the negative if no positive weights were obtained for that position (8). Given sequences from two groups, RELIEF assigns weights to features (alignment columns) by summation of the weight vector obtained as the bit-vector difference between a given sequence and its nearest neighbour from the opposite group, the ‘nearest miss’, and subtracting from that bit-vector difference with its nearest neighbour from the same group, the ‘nearest hit’.
The sampling strategy of mR has been changed from a stochastic to an exhaustive deterministic implementation. An all-against-all comparison of the sequences is carried out and all ‘nearest hits’ and ‘nearest misses’ are now compared (cf. 8). Thus, the user is no longer confronted with fine-tuning the number of iterations, or with results that differ between runs. In addition, the mR web output now reports support values. The toy example in Table 1 also shows the corresponding mR weights.
Toy example
Table 1 shows example values for a hypothetical alignment. If residues are completely different between groups (Table 1, pos. 3) or completely conserved within groups (pos. 2) the SH score is zero. In the latter case, the mR weight is one. Negative mR weights appear when the position has different residues within a sub-family, but show conservation between sub-families (pos. 5 and 6).
Statistical significance
The output now includes a significance measure in the form of empirical Z-scores for both SH and mR values. These values are produced by permuting the group labels and re-running  (=100) times. For mR for efficiency reasons, the random values are based on a sub-sampling of pairs of groups. Z-score measures how many standard deviations (SD) the observed SH or mR value deviates from the mean of the respective ‘random’ scores for that data set. Completely conserved alignment columns have zero SD over the random scores, yielding an undefined Z-score.
Web server
User input
An MSA in one of the main formats (FASTA, ClustalW, Stockholm, SELEX or GCG MSF) and a definition of sub-family groups within the alignment needs to be provided. Groups can either be defined within the sequence labels or provided as separate input. In addition, two optional inputs can be provided: (i) a reference sequence to compare the results for different alignments that contain the same reference sequence; (ii) a reference structure, either by PDB ID, file upload or on-the-fly ‘PDB BLAST’ against the PDB protein sequence database. Example input and output are provided as well as the possibility to regenerate the example output.
Processing
The server scripts are coded in Javascript, PHP, and (Bio)Perl. The main SH and mR scripts are coded in Python. If a reference sequence and/or a PDB structure is provided, the positions in the alignment are mapped to the corresponding positions in the reference sequence and/or PDB structure. ‘PDB BLAST’ uses NCBI BLAST (20) with a locally installed non-redundant PDB protein sequence database (pdbaa from NCBI).
Validation
The SH and mR methods rely on a ranking scheme that does not need ‘training’, only cut-off values applied to the score values determine the number of selected sites. Validation and comparison to other state-of-the-art specificity detection methods have been carried out previously for SH (5) and for mR (8). mR has also been benchmarked and was among the three best performing methods out of five (15).
We here include the validation results for SH and mR on 7 data sets detailed in Table 2 and 15 data sets from another benchmarking study (15) (five overlapping families, Gprotein, LacI, Smad, RasRal and Rab56, were excluded). We follow the validation protocol described by Capra and Singh (21). Figure 1 shows box plots summarizing the distribution of ranks obtained by the different methods, as well as average precision/recall (PR) curves for SH and mR, and Table 3 summarizes area under the PR curve per dataset. For comparison, also results for ProteinKeys, PROUST-II, SDPpred and Xdet are shown. ProteinKeys has been run with default settings and alignment filtering turned off. PROUST-II predictions were displayed with the default minimum ‘AA Prob’ of 0.2 and ranked on Z-score. Xdet was run both unsupervised and supervised, in which case the groups were supplied as binary matrices defining the membership of a sequence to a group.
Table 2.
Properties of our seven data sets used for benchmark comparison of the algorithms
| Data set | Number of classes | Average (SD) class size | Max, min class size | Number of sites | Site information | PDB ref | ‘True’ sites |
|---|---|---|---|---|---|---|---|
| GPCR | 77 | 26.8 (34) | 189, 3 | 214 | ligand | 1GZM | T94, T97, E113, G114, A117, T118, G121, L125, C167, L172, F203, V204, M207, F208, H211, Y268, A269, A272, A292, F293, K296 |
| GPCR-190 | 39 | 4.9 (3.8) | 21, 2 | like ‘GPCR’ | |||
| LacI | 15 | 3.6 (2.5) | 12, 2 | 339 | ligand and DNA | 1EFA | T5, L6, S16, Y17, Q18, R22, N25, Q26, H29, Q54, A57, S61, L73, A75, P76, I79, N125, P127, D149, S191, S193, W220, N246, Q248, Y273, D274, T276, F293 |
| Ras/Ral | 2 | 44.5 (24.5) | 69, 20 | 218 | protein | 5P21 | I24, Q25, D30, E31, D33, I36, E37, Q43, L53, M67, Q70, D92 |
| Rab5/Rab6 | 2 | 5.0 (1) | 4, 6 | 163 | protein | 1R2Q | K42, G43, Q44, H46, E47, F48, Q49, E50, S51, H83, A86, M88, Y90, G92, A93, Q94, E117, L118, Q119, R120, Q121, A122, S123, P124, N125, I126, V127, K183 |
| AQP/GLP | 2 | 30.0 (18) | 48, 12 | 430 | protein | 1FX8 | L21, W48, V52, A65, H66, L67, V71, T137, Y138, P139, N140, P141, L159, I163, I187, G195, P196, L197, G199, F200, A201, M202 |
| Smad | 2 | 10.0 (2) | 12, 8 | 211 | protein | 1KHX | L263, Q264, T267, Q284, Q294, P295, L297, T298, S308, E309, A323, V325, M327, I341, F346, P360, Q364, R365, Y366, W368, N381, R427, T430, S460, V461, R462, C463, M466 |
Data sets are the G-protein coupled receptors (GPCR) and a smaller version (GPCR-190), the LacI family of transcription factors, Ras super-family of small GTP-ases (Rab5 versus Rab6; Rab versus Ral), the aquaporins versus glycerol porins (AQP/GLP) and the Smad family of transcription factors [more details in (5,8)].
Figure 1.

Validation results for the SH and mR methods. ProteinKeys, PROUST-II, SDPpred v.2 and Xdet are shown for comparison. Results obtained by the different methods were averaged over all data sets weighted by the number of positives. (A) Box plots showing the distribution (as minimum, lower quartile, median, upper quartile and maximum) of ranks of positive sites. Lower is better. (B) Precision/recall (PR) curves showing the relative performance of the methods at different coverage (recall). Higher is better.
Table 3.
Validation for detection of specificity sites by SH and mR scored as area under curve (AUC) for the PR plots versus gold-standard specificity sites in the 22 data sets, 7 sets as defined in Table 2 and 15 sets obtained from Chakrabarti and Panchenko (15)
| Dataset | cbm9 | cd00 | cd00 | cd00 | cd00 | cd00 | cd00 | cd00 | CN- | GPCR | GPCR | GST | IDH/ | LacI | MDH/ | AQP/ | nucl | rab | ras/ | ricin | serine | Smad | Aver |
|---|---|---|---|---|---|---|---|---|---|---|---|---|---|---|---|---|---|---|---|---|---|---|---|
| 120 | 264 | 333 | 363 | 365 | 423 | 985 | myc | 190 | IMDH | LDH | GLP | cycl.a | 5/6 | ral | Wt'd | ||||||||
| # positives | 7 | 3 | 3 | 12 | 6 | 10 | 4 | 3 | 11 | 21 | 21 | 9 | 14 | 28 | 1 | 23 | 2 | 28 | 12 | 21 | 2 | 29 | |
| mR | 0.161 | 0.058 | 0.006 | 0.301 | 0.010 | 0.055 | 0.204 | 0.329 | 0.037 | 0.246 | 0.347 | 0.156 | 0.050 | 0.266 | 0.063 | 0.213 | 0.417 | 0.540 | 0.666 | 0.186 | 0.078 | 0.719 | 0.310 |
mR Z
|
0.161 | 0.058 | 0.006 | 0.301 | 0.010 | 0.055 | 0.204 | 0.329 | 0.037 | 0.252 | 0.347 | 0.156 | 0.050 | 0.282 | 0.063 | 0.216 | 0.417 | 0.539 | 0.666 | 0.186 | 0.078 | 0.721 | 0.312 |
| SH. | 0.074 | 0.054 | 0.003 | 0.287 | 0.008 | 0.119 | 0.080 | 0.198 | 0.067 | 0.486 | 0.489 | 0.242 | 0.048 | 0.124 | 0.125 | 0.249 | 0.413 | 0.602 | 0.540 | 0.194 | 0.261 | 0.713 | 0.330 |
SH Z
|
0.074 | 0.054 | 0.003 | 0.287 | 0.008 | 0.119 | 0.080 | 0.198 | 0.067 | 0.517 | 0.489 | 0.242 | 0.048 | 0.207 | 0.125 | 0.268 | 0.413 | 0.602 | 0.540 | 0.194 | 0.261 | 0.703 | 0.342 |
| ProteinKeys | 0.049 | 0.008 | 0.087 | 0.203 | 0.010 | 0.010 | 0.002 | 0.034 | 0.027 | 0.377 | 0.505 | 0.483 | 0.065 | 0.301 | 0.005 | 0.119 | 0.011 | 0.364 | 0.092 | 0.276 | 0.006 | 0.748 | 0.287 |
| PROUST-II | 0.349 | 0.079 | 0.012 | 0.055 | 0.011 | 0.016 | 0.049 | 0.058 | 0.122 | 0.308 | b | 0.446 | 0.089 | 0.111 | 0.015 | 0.187 | 0.305 | 0.455 | 0.378 | 0.256 | 0.750 | 0.723 | 0.258 |
| SDPpred v.2 | 0.122 | 0.126 | 0.017 | 0.376 | 0.012 | 0.126 | 0.234 | 0.509 | 0.162 | 0.508 | 0.508 | 0.615 | 0.196 | 0.146 | 0.250 | 0.242 | 0.413 | 0.416 | 0.357 | 0.201 | 0.542 | 0.522 | 0.333 |
| Xdet | 0.352 | 0.106 | 0.080 | 0.366 | 0.011 | 0.103 | 0.196 | 0.387 | 0.086 | 0.125 | b | 0.117 | 0.100 | 0.190 | 0.033 | 0.169 | 0.054 | 0.350 | 0.398 | 0.173 | 0.105 | 0.688 | 0.234 |
| Xdet supc | 0.209 | 0.106 | 0.019 | 0.346 | 0.012 | 0.189 | 0.171 | 0.534 | 0.101 | 0.275 | b | 0.402 | 0.129 | 0.207 | 0.250 | 0.208 | 0.292 | 0.346 | 0.545 | 0.193 | 0.750 | 0.677 | 0.279 |
| Average | 0.172 | 0.072 | 0.026 | 0.280 | 0.010 | 0.088 | 0.136 | 0.286 | 0.078 | 0.344 | 0.448 | 0.318 | 0.086 | 0.204 | 0.103 | 0.208 | 0.304 | 0.468 | 0.465 | 0.206 | 0.314 | 0.691 | 0.298 |
aNucleotidyl cyclase.
bThe GPCR data set is above the maximum of 1000 sequences for these methods.
cSupervised by using subgroupings.
A higher AUC corresponds to better performance. For comparison, predictions by ProteinKeys, PROUST-II, SDPpred v.2 and Xdet are also shown. Best-scoring methods for each data set are in bold. The final column list the average AUCs per method weighted by number of positives, and the bottom row the averages per data set.
The PR plots in Figure 1B show that SH outperforms the other methods up to a recall of 20%. Beyond that, the performance remains comparable to the other state-of-the-art methods. SH would, therefore, seem to be a good choice when one is interested in a small number of highly significant specificity determining sites.
RESULTS AND DISCUSSION
After uploading an MSA and sub-family groupings, the multi-Harmony server returns a highly dynamic results page as shown in Figure 2 The results for each alignment position are displayed in an interactive table (Figure 2A). The user can sort the table on any of the numerical fields (e.g. SH score or Z-score), can filter and highlight sites based on thresholds.
Figure 2.

An example of the multi-Harmony output. (A) The main output table, sorted by SH score and filtered on SH score ( 0.5) and high mR weight (
 0.8). Only ALA278 at position 17 in the alignment is not a confirmed functional residue. The columns with arrows can be sorted. Most of these columns can also be filtered to display only those alignment positions that satisfy the user-supplied thresholds. (B) The output view in Jalview. Groups are outlined in the alignment and filtered positions (from the output table) are marked in the annotation track ‘Filtered 1’ with a tooltip detailing the filter like ‘Positions passing criteria [score
  0.5; weight
  0.8] are indicated’. (C) View of the 3D context using Jmol with the protein coloured by mR weights, and filtered residues (from the output table) labelled and highlighted as space-filling spheres. Colouring by SH scores is also possible.
We have included the Jalview (22) and Jmol applets (23) and exploit their Javascript–Java interface for enhanced interactivity, as compared to the previous SH and mR servers, which provided only static output tables. The sequence groups, SH scores and mR weights are annotated on the Jalview alignment. In addition, the user can interactively add annotation tracks to the Jalview alignment to mark positions that pass the supplied table filter thresholds. Such a track is shown in Figure 2B. If a PDB structure is provided, the results can be visualized on the PDB structure (Jmol). The entire structure can be coloured according to SH scores or mR weights. Residues passing the filters can also be dynamically highlighted, thereby providing a view of these residues in 3D context (Figure 2C). Finally, the user can download the plain-text output of the analysis programs.
We illustrate multi-Harmony with receptor-regulated SMAD proteins (R-SMADs) (Figure 2). SMADs are transcription factors that play a crucial role in development (cell growth and differentiation) and disease (e.g. cancer) by mediating transforming growth factor β (TGF-β) signalling (24). SMADs can be divided into two major groups as is clear from the alignment (Figure 2) SMAD1, SMAD5 and SMAD8 are activated in response to bone morphogenetic protein signals, while SMAD2 and SMAD3 are activated in response to TGF-β or activin signals. Most of the interactions with SMADs occur via the Mad homology 2 (MH2) domain, which is responsible for the specificity of binding (25). The input alignment consists of 33 homologous vertebrate sequences of the MH2 domain from the five R-Smad groups.
The output table can be filtered on SH or mR values. In the case of sub-type specificity, we are interested in finding residues that are unique to sub-families. An SH score ranges from 0 to 1 and a mR weight from  1 to 1. A lower SH (harmony) indicates a more specific residue, while a higher mR weight indicates a more group-specific residue. Thus, the lower the SH score or the higher the mR weight, the better.
If we filter the output table for residues using a stringent mR weight threshold of  0.9, 42 (of 211) positions are returned. These include 24 of the 28 known functional sites (Table 2, cf. 5) Another additional eight residues (I277, T289, R337, L350, A371, E389, Q400 and R410) have an mR weight of 1, which means that these positions optimally differentiate between at least two groups in the SMAD alignment. For example, position I277 (pos. 16) is a conserved valine in the SMAD8 group, while it is an isoleucine in the other SMADs.
We can also filter the output table on SH scores and/or SH and mR Z-scores. The Z-score provides an intuitive way to filter the SH results: a Z-score of −3 indicates that the SH score is three SDs below the mean score of the 100 randomizations. Since the SH score should be lower than the ‘random’ mean, the most negative Z-scores are the most interesting. However, a very negative Z-score could also be obtained for a high SH score. This happens for example when the alignment column shows only two residues: one conserved in a small sub-group and one in all others, as in Table 1 pos. 1 and pos. 16 in Figure 2B. This indeed often coincides with an mR weight of one.
In general, by changing the Z-score, it is possible to tune the expected false discovery rate. A typical Z-score threshold would be less than −3 or, more stringent, less than −6. Indeed, a Z-score threshold of less than −12 returns a validated functional position (ARG365 for the SMADs, see also Figure 2A) and possibly positions that are different among the groups, but are conserved within a group. Table 3 illustrates the influence of the Z-score on the performance of SH. If the Z-score is used as a filter (less than −9) to split the SH scores in two groups, followed by ranking on SH score, the performance of SH increases by about 4%. For mR, this filtering has no clear advantage on these data sets. An optimal threshold is data set dependent, and particularly rises strongly with an increasing number of sub-groups. We, therefore, set a modest Z-score threshold of −3 by default.
CONCLUSION
This multi-Harmony server combines the enhanced Sequence Harmony and multi-Relief methods to study specificity-determining residues in proteins. The addition of multi-group handling to SH improves its useability. The new deterministic implementation of mR returns reproducible results in contrast to the previous (sampling) implementation. Furthermore, the empirical significance estimates for SH and mR improve the reliability of the results. The multi-Harmony server provides tabular output as an interactive environment to analyse selected residues in multiple alignment context using Jalview and in their 3D context with Jmol.
FUNDING
ENFIN, a Network of Excellence funded by the European Commission within its FP6 Programme, under the thematic area ‘Life sciences, genomics and biotechnology for health’ (LSHG-CT-2005-518254). The open access charges for this paper were partially waived by Oxford University Press, the rest was paid by ENFIN.
Conflict of interest statement. None declared.
REFERENCES
- 1.Whisstock JC, Lesk AM. Prediction of protein function from protein sequence and structure. Q. Rev. Biophys. 2003;36:307–340. doi: 10.1017/s0033583503003901. [DOI] [PubMed] [Google Scholar]
- 2.del Sol A, Pazos F, Valencia A. Automatic methods for predicting functionally important residues. J. Mol. Biol. 2003;326:1289–1302. doi: 10.1016/s0022-2836(02)01451-1. [DOI] [PubMed] [Google Scholar]
- 3.Kalinina OV, Mironov AA, Gelfand MS, Rakhmaninova AB. Automated selection of positions determining functional specificity of proteins by comparative analysis of orthologous groups in protein families. Protein Sci. 2004;13:443–456. doi: 10.1110/ps.03191704. [DOI] [PMC free article] [PubMed] [Google Scholar]
- 4.Donald JE, Shakhnovich EI. Predicting specificity-determining residues in two large eukaryotic transcription factor families. Nucleic Acids Res. 2005;33:4455–4465. doi: 10.1093/nar/gki755. [DOI] [PMC free article] [PubMed] [Google Scholar]
- 5.Pirovano W, Feenstra KA, Heringa J. Sequence comparison by sequence harmony identifies subtype-specific functional sites. Nucleic Acids Res. 2006;34:6540–6548. doi: 10.1093/nar/gkl901. [DOI] [PMC free article] [PubMed] [Google Scholar]
- 6.Wallace IM, Higgins DG. Supervised multivariate analysis of sequence groups to identify specificity determining residues. BMC Bioinformatics. 2007;8:135. doi: 10.1186/1471-2105-8-135. [DOI] [PMC free article] [PubMed] [Google Scholar]
- 7.Sankararaman S, Sjölander K. INTREPID—INformation-theoretic TREe traversal for protein functional site IDentification. Bioinformatics. 2008;10:2445–2452. doi: 10.1093/bioinformatics/btn474. [DOI] [PMC free article] [PubMed] [Google Scholar]
- 8.Ye K, Feenstra KA, Heringa J, IJzerman AP, Marchiori E. Multi-RELIEF: a method to recognize specificity determining residues from multiple sequence alignments using a machine-learning approach for feature weighting. Bioinformatics. 2008;24:18–25. doi: 10.1093/bioinformatics/btm537. [DOI] [PubMed] [Google Scholar]
- 9.Kalinina O, Gelfand M, Russell R. Combining specificity determining and conserved residues improves functional site prediction. BMC Bioinformatics. 2009;10:174. doi: 10.1186/1471-2105-10-174. [DOI] [PMC free article] [PubMed] [Google Scholar]
- 10.Georgi B, Schultz J, Schliep A. Partially-supervised protein subclass discovery with simultaneous annotation of functional residues. BMC Struct. Biol. 2009;9:68. doi: 10.1186/1472-6807-9-68. [DOI] [PMC free article] [PubMed] [Google Scholar]
- 11.Hannenhalli SS, Russell RB. Analysis and prediction of functional sub-types from protein sequence alignments. J. Mol. Biol. 2000;303:61–76. doi: 10.1006/jmbi.2000.4036. [DOI] [PubMed] [Google Scholar]
- 12.Pei J, Cai W, Kinch LN, Grishin NV. Prediction of functional specificity determinants from protein sequences using log-likelihood ratios. Bioinformatics. 2006;22:164–171. doi: 10.1093/bioinformatics/bti766. [DOI] [PubMed] [Google Scholar]
- 13.Pazos F, Rausell A, Valencia A. Phylogeny-independent detection of functional residues. Bioinformatics. 2006;22:1440–1448. doi: 10.1093/bioinformatics/btl104. [DOI] [PubMed] [Google Scholar]
- 14.Reva B, Antipin Y, Sander C. Determinants of protein function revealed by combinatorial entropy optimization. Genome Biol. 2007;8:R232. doi: 10.1186/gb-2007-8-11-r232. [DOI] [PMC free article] [PubMed] [Google Scholar]
- 15.Chakrabarti S, Panchenko AR. Ensemble approach to predict specificity determinants: benchmarking and validation. BMC Bioinformatics. 2009;10:207. doi: 10.1186/1471-2105-10-207. [DOI] [PMC free article] [PubMed] [Google Scholar]
- 16.Feenstra KA, Pirovano W, Krab K, Heringa J. Sequence Harmony: detecting functional specificity from alignments. Nucleic Acids Res. 2007;35:W495–W498. doi: 10.1093/nar/gkm406. [DOI] [PMC free article] [PubMed] [Google Scholar]
- 17.Kononenko I. Estimating attributes: analysis and extensions of RELIEF. In: Bergadano F, De Raedt L, editors. European Conference on Machine Learning. Vol. 784. New York, Secaucus, NJ, USA: Springer-Verlag; 1994. pp. 171–182. LNCS. [Google Scholar]
- 18.Feenstra KA, Bastianelli G, Heringa J. Predicting protein interactions from functional specificity. In: Hansmann UHE, Meinke JH, Mohanty S, Nadler W, Zimmermann O, editors. From Computational Biophysics to Systems Biology (CBSB08) John von Neumann Institute for Computing, Jülich (Germany), Vol. 40 of NIC Series; 2008. pp. 89–92. [Google Scholar]
- 19.Rausell A, Juan D, Pazos F, Valencia A. Protein interactions and ligand binding: from protein subfamilies to functional specificity. Proc. Natl Acad. Sci. USA. 2010;107:1995–2000. doi: 10.1073/pnas.0908044107. [DOI] [PMC free article] [PubMed] [Google Scholar]
- 20.Altschul SF, Madden TL, Schaffer AA, Zhang J, Zhang Z, Miller W, Lipman DJ. Gapped BLAST and PSI-BLAST: a new generation of protein database search programs. Nucleic Acids Res. 1997;25:3389–3402. doi: 10.1093/nar/25.17.3389. [DOI] [PMC free article] [PubMed] [Google Scholar]
- 21.Capra JA, Mona Singh M. Characterization and prediction of residues determining protein functional specificity. Bioinformatics. 2008;24:1473–1480. doi: 10.1093/bioinformatics/btn214. [DOI] [PMC free article] [PubMed] [Google Scholar]
- 22.Waterhouse AM, Procter JB, Martin DMA, Clamp M, Barton GJ. Jalview version 2—a multiple sequence alignment editor and analysis workbench. Bioinformatics. 2009;20:426–427. doi: 10.1093/bioinformatics/btp033. [DOI] [PMC free article] [PubMed] [Google Scholar]
- 23.Herráez A. Biomolecules in the computer: Jmol to the rescue. Biochem. Mol. Biol. Educ. 2006;34:255–261. doi: 10.1002/bmb.2006.494034042644. [DOI] [PubMed] [Google Scholar]
- 24.Attisano L, Wrana JL. Signal transduction by the TGF-β superfamily. Science. 2002;296:1646–1647. doi: 10.1126/science.1071809. [DOI] [PubMed] [Google Scholar]
- 25.Feng XH, Derynck R. Specificity and versatility in TGF-β signaling through Smads. Annu. Rev. Cell. Dev. Biol. 2005;21:659–693. doi: 10.1146/annurev.cellbio.21.022404.142018. [DOI] [PubMed] [Google Scholar]