Abstract
Aims/hypothesis
The aim of this study was to determine the dependency on peroxisome-proliferator-activated receptor-γ (PPAR-γ) of insulin sensitisation and glucose homeostasis by thiazolidinediones using a global Ppar-γ (also known as Pparg)-knockout mouse model.
Methods
Global Mox2-Cre-Ppar-γ-knockout (MORE-PGKO) mice were treated with rosiglitazone and analysed for insulin sensitivity and glucose metabolism. Metabolic and hormonal variables were determined. Adipose and other tissues were measured and analysed for gene expression.
Results
Rosiglitazone induced regrowth of fat in female but not male MORE-PGKO mice, and only in specific depots. Insulin sensitivity increased but, surprisingly, was not associated with the typical changes in adipokines, plasma NEFA or tissue triacylglycerol. However, increases in alternatively activated macrophage markers, which have been previously associated with metabolic improvement, were observed in the regrown fat. Rosiglitazone improved glucose homeostasis but not insulin sensitivity in male MORE-PGKO mice, with further increase of insulin associated with an apparent expansion of pancreatic islets.
Conclusions/interpretation
Stimulating fat growth by rosiglitazone is sufficient to improve insulin sensitivity in female mice with 95% PPAR-γ deficiency. This increase in insulin sensitivity is not likely to be due to changes typically seen in adipokines or lipids but may involve changes in macrophage polarisation that occur independent of PPAR-γ. In contrast, rosiglitazone improves glucose homeostasis in male mice with similar PPAR-γ deficiency by increasing insulin production independent of changes in adiposity. Further, the insulin-sensitising effect of rosiglitazone is dependent on PPAR-γ in this male lipodystrophic model.
Keywords: Adipose tissue, Insulin resistance, Macrophage, PPAR-γ, Rosiglitazone
Introduction
Insulin resistance is closely associated with type 2 diabetes, dyslipidaemia and hypertension. Thiazolidinediones (TZDs), including rosiglitazone, pioglitazone and troglitazone, can increase insulin sensitivity, lower blood glucose, decrease circulating NEFA and triacylglycerol, lower blood pressure and reduce atherosclerosis and other cardiovascular risks in insulin-resistant patients and animal models [1]. In 1995, these TZD drugs were identified as agonists of a nuclear transcription factor, peroxisome-proliferator-activated receptor-γ (PPAR-γ), that has since become a focus of studies on metabolism and diabetes [2].
Among the major insulin target tissues, PPAR-γ is much more abundant in adipose tissue than liver and muscle, but conflicting conclusions have been reached as to the importance of adipose tissue in the insulin-sensitising effects of TZDs [3, 4]. Troglitazone specifically improved insulin sensitivity in lipodystrophic mice that expressed diphtheria toxin A chain in fat [3]. However, insulin sensitivity in A-ZIP fatless mice was not improved by rosiglitazone or troglitazone [4].
PPAR-γ is also produced in abundance in macrophages [5]. Adipose tissue macrophages have been recognised as an important link between obesity, inflammation and insulin resistance [6]. Macrophage polarisation is a critical process in different pathological conditions such as atherosclerosis [7], obesity [8] and insulin resistance [9, 10]. Studies have defined some of these populations, including classically activated macrophages (M1) that are pro-inflammatory and a group of alternatively activated macrophages (M2) that are more anti-inflammatory [11, 12]. However, there is a spectrum of phenotypes within the alternatively activated macrophages [11, 13]. PPAR-γ has emerged as a crucial regulator of macrophage polarisation. Macrophage-specific PPAR-γ deficiency impairs M2 activation [14] and causes insulin resistance and glucose intolerance in mice [14, 15].
One fundamental question is whether TZDs exert all of their insulin-sensitising effects through PPAR-γ. Cell-type-specific Ppar-γ (also known as Pparg)-knockout (KO) studies demonstrated that PPAR-γ in fat, muscle, liver and macrophage all play important individual roles in the insulin-sensitising effects of TZDs [15–19]. However, because the germline Ppar-γ-knockout mice are embryonically lethal and the whole-body knockout of Ppar-γ2 is mostly restricted to adipocytes [20], there had been no mouse models to examine PPAR-γ-independent TZD effects.
The Mox2-Cre-Ppar-γ-knockout (MORE-PGKO) mouse model we created has generalised PPAR-γ (both γ1 and γ2) deficiency, severe lipodystrophy and insulin resistance [21]. In this study, we have used this unique model to study the effects of TZDs on insulin sensitivity and glucose homeostasis.
Methods
Materials
Rosiglitazone chow (0.0015% [wt/wt] rosiglitazone) was produced by mixing rosiglitazone with 5001 rodent chow (Harlan Teklad, Madison, WI, USA). Other reagents were purchased from Sigma-Aldrich (St Louis, MI, USA), except where otherwise indicated.
Animals
MORE-PGKO and littermate control (LC) mice were produced as before [21]. Six month old MORE-PGKO mice and LC mice were treated with either regular chow (5001 rodent chow) or rosiglitazone chow for a total of 8 weeks. The principles of laboratory animal care (NIH publication no. 85-23, revised 1985; http://grants1.nih.gov/grants/olaw/references/phspol.htm) were followed. All animal protocols were approved by the University Committee on Use and Care of Animals of the University of Michigan.
Insulin tolerance test and glucose tolerance test
Insulin tolerance test (ITT) and glucose tolerance test (GTT) were performed as previously described [21]. Tail blood, 100 µl, was collected at time point 0 of the ITT for blood profile analyses. For insulin measurements, 50 µl tail blood was collected at time point 0 of the GTT.
Insulin level measurement
Plasma insulin levels were measured with ELISA kits from Crystal Chem (Downers Grove, IL, USA).
Histological analysis
Tissues were fixed in 10% (vol./vol.) neutral buffered formalin and embedded in paraffin. Haematoxylin and eosin (H&E) was used to stain 5 µm sections. The islet size was quantified using NIH ImageJ 1.31V (National Institutes of Health, Bethesda, MD, USA) and expressed as the ratio of islet area to the total pancreatic area. The adipocyte size and subcutaneous fat thickness were also quantified using NIH ImageJ 1.31V. At least 100 adipocytes from each sample were measured.
Western blot analysis
Total protein was subjected to electrophoresis and transferred to polyvinylidene fluoride (PVDF) membranes as described before [22, 23]. Membranes were incubated with primary antibodies followed by incubation in secondary antisera conjugated with horseradish peroxidase. Detection and quantification were done as before [22]. The primary antibodies against phospho-AKT (p-AKT, serine 473) and total AKT were purchased from Cell Signaling Technology (Danvers, MA, USA).
Fat mass estimation
The ratio of fat mass to total mass was evaluated with dual energy x-ray absorptiometry (DEXA; Norland Medical Systems, Lake Forest, CA, USA) scanning. Dissection photographs were taken using digital camera and histological (see above) analyses of adipose tissue were performed to visualise the fat mass. Epididymal fat pads, peri-uterine fat pads, and interscapular brown adipose tissue (BAT) were weighed. The ratios of these fat pad weights to body weights were calculated.
Isolation of peritoneal macrophages
Both LC and MORE-PGKO mice were injected with 1 ml of 3% (wt/vol.) thioglycollate peritoneally [15]. Three days after the injections, peritoneal macrophages were harvested by washing the peritoneum with 3 ml of sterile PBS three times. Cells were spun down and frozen in −80°C for RNA analysis.
Gene expression analysis
RNA was isolated from tissues or cells using RNeasy kit (Qiagen, Valencia, CA, USA) and gene expression was assayed using reverse transcription quantitative PCR (RT-QPCR). SYBR green was used to detect PCR product and β-actin was used as an endogenous control.
Southern blot
Genomic DNA was digested with BamHI, separated by electrophoresis, transferred to nylon membrane and hybridised with a 32P-labelled DNA probe derived from the PPAR-γ gene (3'-probe) as described before [21, 23, 24]. Band density was analysed using Quantity One software (Bio-Rad Laboratories, Hercules, CA, USA). The percentage of null allele (null%) was calculated by dividing band density of null allele by total band density of null and floxed allele.
Statistics
The results were presented as mean ± SE and analysed using Prism (GraphPad Software, San Diego, CA, USA). Statistical comparisons between groups were performed by Student’s t test unless all the values in one group were zero, in which case Fisher’s exact test was used. The curves were compared by two-way ANOVA and Bonferroni post-tests. Groups were considered significantly different if p values were ≤ 0.05.
Results
Rosiglitazone improves insulin sensitivity in female MORE-PGKO mice
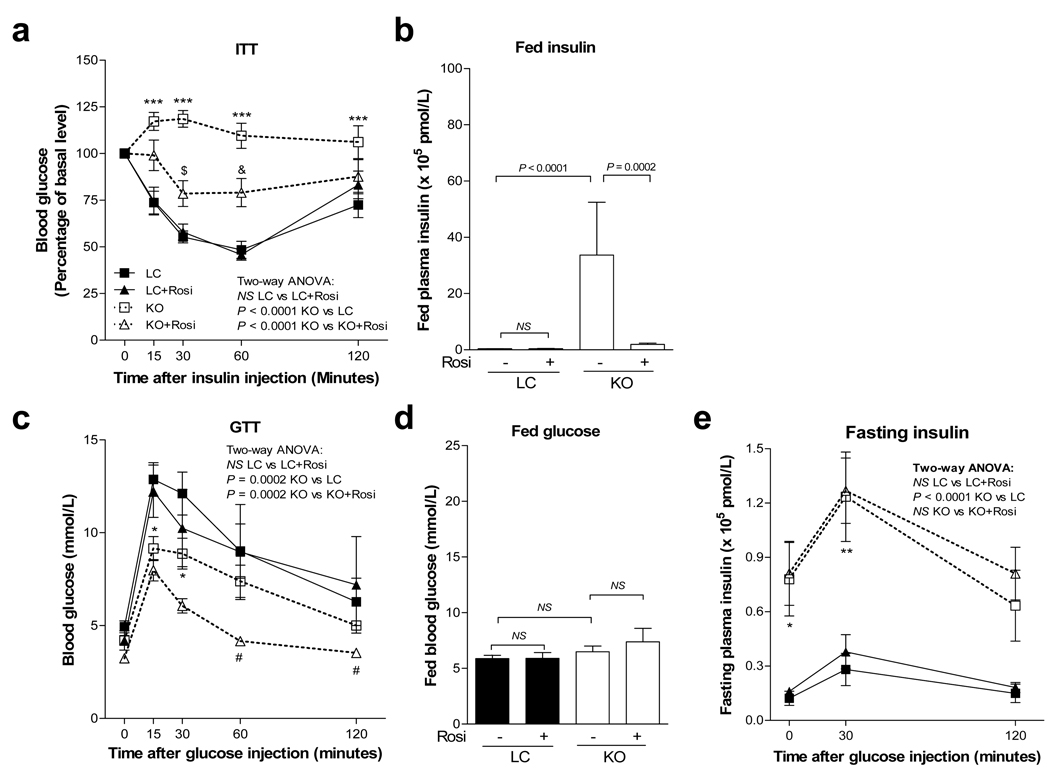
Consistent with our previous data [21], female MORE-PGKO mice have severe insulin resistance at baseline, demonstrated by impaired ITT and elevated fed plasma insulin (Fig. 1a,b). After 8 weeks of rosiglitazone treatment, the ITT of female MORE-PGKO mice was significantly improved (Fig. 1a) and the fed plasma insulin was significantly decreased (Fig. 1b), showing significant improvement of insulin sensitivity. This decrease of plasma insulin was observed as early as after 4 weeks of treatment in female MORE-PGKO mice (2.46 × 10⁵ ± 0.63 × 10⁵ pmol/l).
Fig. 1.
Rosiglitazone improves insulin sensitivity in female MORE-PGKO mice. Results for female LC and MORE-PGKO mice (n=8 for each group) before and after 8 weeks of rosiglitazone treatment: (a) ITT (two-way ANOVA: LC vs LC+Rosi, NS; KO vs LC, p<0.0001; KO vs KO+Rosi, p<0.0001); (b) fed plasma insulin levels (LC vs KO, p<0.0001; KO vs KO+Rosi, p=0.0002; LC vs LC+Rosi, NS); (c) GTT (two-way ANOVA: LC vs LC+Rosi, NS; KO vs LC, p=0.0002; KO vs KO+Rosi, p=0.0002); (d) fed blood glucose levels (LC vs LC+Rosi, NS; LC vs KO, NS; KO vs KO+Rosi, NS); and (e) fasting insulin levels (two-way ANOVA: LC vs LC+Rosi, NS; KO vs LC, p<0.0001; KO vs KO+Rosi, NS). Bonferroni post-tests: *p<0.05 KO vs LC; **p<0.01 KO vs LC; ***p<0.001 KO vs LC; †p<0.05 KO vs KO+Rosi; ††p<0.01 KO vs KO+Rosi; †††p<0.001 KO vs KO+Rosi. Rosi, rosiglitazone chow. LC, black squares; LC+Rosi, black triangles; KO, white squares; KO+Rosi, white triangles
As previously reported, the female MORE-PGKO mice were not diabetic and the GTT showed enhanced glucose tolerance compared with LC mice (Fig. 1c,d), and they had higher insulin levels than LC mice during GTT (Fig. 1e). Rosiglitazone further improved GTT in female MORE-PGKO mice (Fig. 1c), probably because of high insulin levels (Fig. 1e) and improved insulin sensitivity (Fig. 1a). The fed blood glucose was not affected significantly by rosiglitazone in female mice (Fig. 1d).
Data presented in the Electronic supplementary material (ESM) show that rosiglitazone slightly increased plasma leptin and adiponectin in female MORE-PGKO mice (ESM Fig. 2a,b). Expression of retinol binding protein 4 (Rbp4) in peri-uterine fat was not affected by rosiglitazone (ESM Fig. 2c). The level of plasma triacylglycerol decreased but NEFA did not change (ESM Fig. 3). Triacylglycerol levels were not changed in muscle and were increased in the livers of both sexes by rosiglitazone (ESM Fig. 5). Plasma 17β-oestradiol was decreased by rosiglitazone in LC mice and was lower in MORE-PGKO mice at baseline (ESM Fig. 6a).
Rosiglitazone improves glucose homeostasis in male MORE-PGKO mice
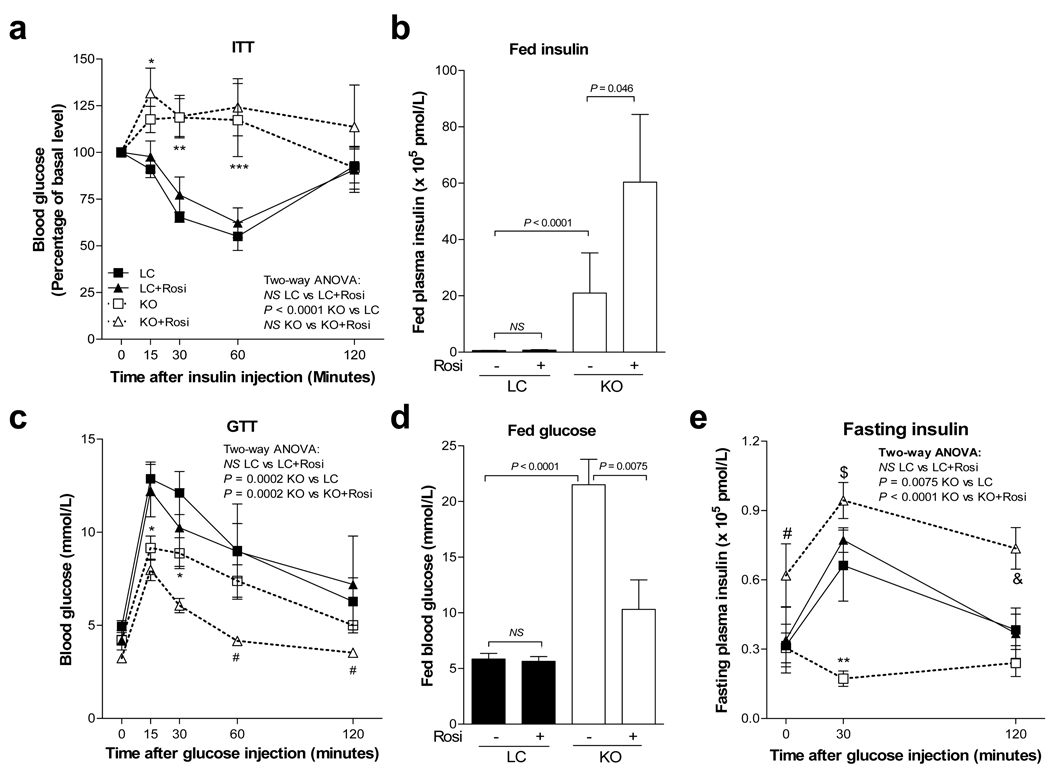
Male MORE-PGKO mice also have severe insulin resistance at baseline, with an impaired ITT and elevated fed plasma insulin [21]. After 8 weeks of rosiglitazone treatment, the ITT of male MORE-PGKO mice was not significantly changed (Fig. 2a) and the fed plasma insulin was further increased (Fig. 2b). The male MORE-PGKO mice were diabetic, with significantly impaired GTT and elevated fed blood glucose at baseline (Fig. 2c,d). Although both male and female MORE-PGKO mice had significantly higher insulin levels than their LC counterparts, male MORE-PGKO mice had lower levels than females (Fig 1b, Fig 2b), suggesting the beginning of beta cell failure in the males. After 8 weeks of rosiglitazone treatment, the GTT of male MORE-PGKO mice was normalised and the fed blood glucose was significantly decreased (Fig. 2c,d), demonstrating significant improvement in glucose homeostasis. Further, rosiglitazone significantly increased insulin levels of male MORE-PGKO mice during GTT (Fig. 2e).
Fig. 2.
Rosiglitazone improves glucose homeostasis in male MORE-PGKO mice. Results for male LC and MORE-PGKO mice before and after 8 weeks of rosiglitazone treatment: (a) ITT (two-way ANOVA: LC vs LC+Rosi, NS; KO vs LC, p<0.0001; KO vs KO+Rosi, NS), (b) fed plasma insulin levels (LC vs KO, p<0.0001; KO vs KO+Rosi, p=0.046; LC vs LC+Rosi, NS), (c) GTT (two-way ANOVA: LC vs LC+Rosi, NS; KO vs LC, p=0.0002; KO vs KO+Rosi, p=0.0002), (d) fed blood glucose levels (LC vs LC+Rosi, NS; LC vs KO, p<0.0001; KO vs KO+Rosi, p=0.0075), and (e) fasting insulin levels (two-way ANOVA: LC vs LC+Rosi, NS; KO vs LC, p=0.0075; KO vs KO+Rosi, p<0.0001). n=8 for each group. Bonferroni post-tests: *p<0.05 KO vs LC, **p<0.01 KO vs LC, ***p<0.001 KO vs LC, †p<0.05 KO vs KO+Rosi, ††p<0.01 KO vs KO+Rosi, †††p<0.001 KO vs KO+Rosi. Rosi, rosiglitazone chow. LC, black squares; LC+Rosi, black triangles; KO, white squares; KO+Rosi, white triangles
Rosiglitazone increases islet mass in male but not female MORE-PGKO mice
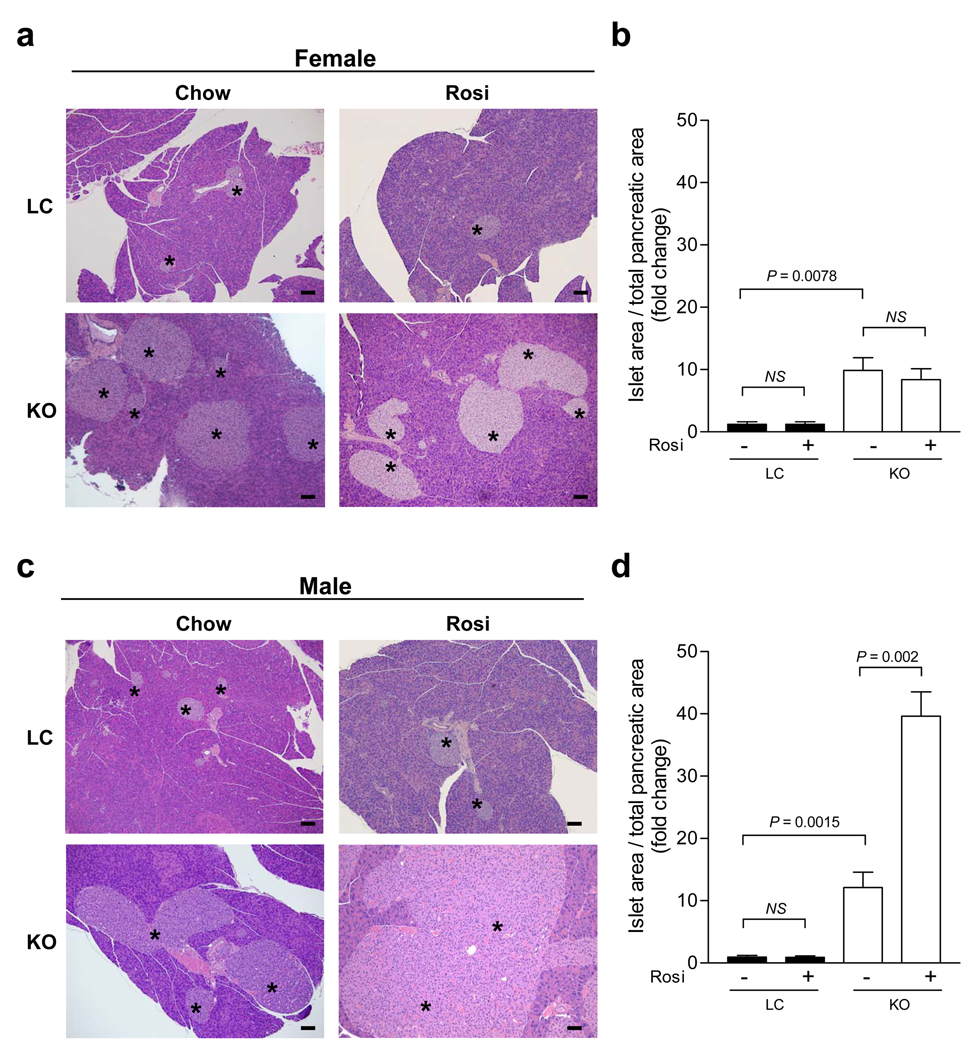
Reflecting insulin sensitivity, the pancreatic islets were enlarged in both male and female MORE-PGKO mice at baseline (Fig. 3). After rosiglitazone treatment, the islet mass was further increased significantly in the male but not the female MORE-PGKO mice (Fig. 3), indicating the preservation of beta cell function in the males.
Fig. 3.
Rosiglitazone increases islet mass in male but not female MORE-PGKO mice. a Representative H&E staining of pancreases from female LC and MORE-PGKO mice without or with 8 weeks of rosiglitazone treatment. The asterisks indicate islets. The bars indicate 100 µm. b Quantification of islet mass of female LC and MORE-PGKO mice without (−) or with (+) 8 weeks of rosiglitazone treatment (LC vs LC+Rosi, NS; KO vs LC, p=0.0078; KO vs KO+Rosi, NS; n=8 for each group). c Representative H&E staining of pancreases from male LC and MORE-PGKO mice without or with 8 weeks of rosiglitazone treatment. The bars indicate 100 µm. d Quantification of islet mass of male LC and MORE-PGKO mice without (−) or with (+) 8 weeks of rosiglitazone treatment (LC vs LC+Rosi, NS; KO vs LC, p=0.0015; KO vs KO+Rosi, p=0.002; n=8 for each group). Chow, 5001 rodent chow; Rosi, rosiglitazone chow
Rosiglitazone increases AKT phosphorylation in female but not male MORE-PGKO mice
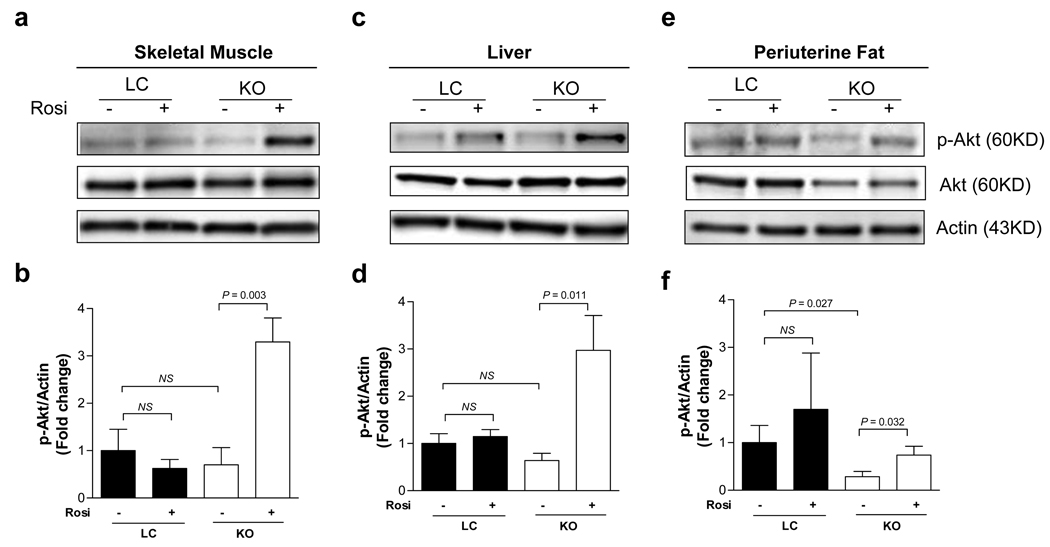
AKT activation by phosphorylation is a key step in the insulin signalling pathway [25]. In parallel with the whole-body physiological study of insulin sensitivity and glucose homeostasis, we studied AKT serine phosphorylation in skeletal muscle, liver and fat. In skeletal muscle, rosiglitazone did not significantly change the AKT phosphorylation in male MORE-PGKO mice (ESM Fig. 1a,b), but it increased the phosphorylation more than threefold in female MORE-PGKO mice (Fig. 4a,b). Similarly, rosiglitazone treatment only increased AKT phosphorylation significantly in female but not male MORE-PGKO mouse livers (Fig. 4c,d; ESM Fig. 1c,d). AKT phosphorylation was significantly reduced in the peri-uterine fat of female MORE-PGKO mice, probably contributing to the impaired insulin sensitivity, while rosiglitazone significantly increased AKT phosphorylation in this fat depot (Fig. 4e,f).
Fig. 4.
Rosiglitazone increases AKT phosphorylation in female MORE-PGKO mice. a Representative western blots of phosphorylated AKT (p-AKT) and total AKT of skeletal muscle from female LC and MORE-PGKO mice without (−) or with (+) 8 weeks of rosiglitazone treatment. Actin was used as a loading control. b Quantification of p-AKT over actin in skeletal muscle of female LC and MORE-PGKO mice (LC vs LC+Rosi, NS; KO vs LC, NS; KO vs KO+Rosi, p=0.003; n=8 for each group). c Representative western blots of p-AKT and total AKT in liver. d Quantification of p-AKT over actin in liver (LC vs LC+Rosi, NS; KO vs LC, NS; KO vs KO+Rosi, p=0.011; n=8 for each group). e Representative western blots of p-AKT and total AKT in peri-uterine fat. f Quantification of p-AKT over actin in peri-uterine fat (LC vs LC+Rosi, NS; KO vs LC, p=0.027; KO vs KO+Rosi, p=0.032; n=8 for each group). Rosi, rosiglitazone chow
Rosiglitazone stimulates fat growth in female but not male MORE-PGKO mice
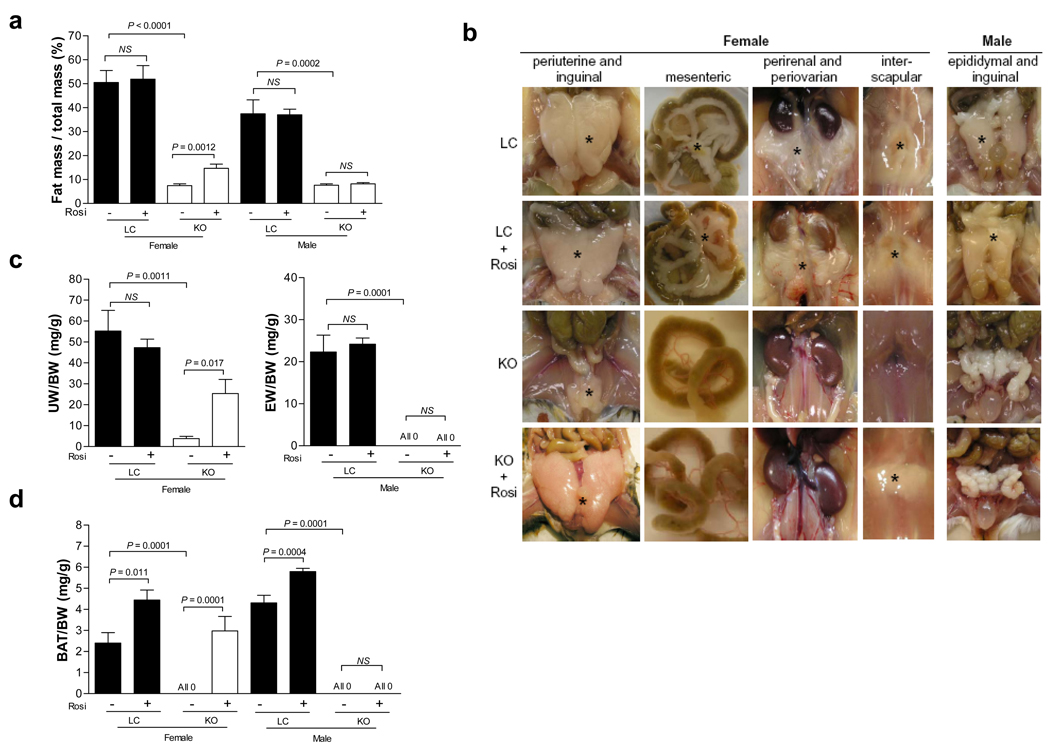
Fat transplantation can rescue the lipodystrophy and insulin resistance in A-ZIP mice [26, 27]. We found that female MORE-PGKO mice grew a significant amount of fat with the stimulation of rosiglitazone but males did not, suggesting that this was the critical difference in determining the insulin-sensitising response. After rosiglitazone treatment, the ratio of fat mass to total mass was significantly increased in female MORE-PGKO mice but not in male mice (Fig. 5a). This increase in fat mass was also observed after 4 weeks of treatment in female MORE-PGKO mice (11.29% ± 1.78%). The representative dissection photographs and ratios of fat pad weight to body weight demonstrated the lipodystrophy in both male and female MORE-PGKO mice (Fig. 5b–e). Rosiglitazone greatly increased the size of the peri-uterine and interscapular fat pads in female MORE-PGKO mice, but in male MORE-PGKO mice no epididymal or interscapular fat pads were found either with or without rosiglitazone (Fig. 5b–e, and data not shown).
Fig. 5.
Rosiglitazone increases fat mass in female but not male MORE-PGKO mice. a DEXA scan results (fat mass/total mass) of LC and MORE-PGKO mice without (−) or with (+) 8 weeks of rosiglitazone treatment. Female mice: LC vs LC+Rosi, NS; KO vs LC, p<0.0001; KO vs KO+Rosi, p=0.0012. Male mice: LC vs LC+Rosi, NS; KO vs LC, p=0.0002; KO vs KO+Rosi, NS. n=8 for each sex and each genotype. b Representative gross photographs of fat pads of LC and MORE-PGKO mice without or with rosiglitazone treatment. The fat pads are indicated by the asterisks. c–d. Ratios of fat pad weight to body weight for LC and MORE-PGKO mice without (−) or with (+) rosiglitazone treatment. c Peri-uterine fat weight (UW)/body weight (BW) in female mice: LC vs LC+Rosi, NS; KO vs LC, p=0.0011; KO vs KO+Rosi, p=0.017. d Epididymal fat weight (EW)/BW in male mice: LC vs LC+Rosi, NS; KO vs LC, p=0.0001; KO vs KO+Rosi, NS. e Interscapular brown adipose tissue weight (BAT)/BW. Female mice: LC vs LC+Rosi, p=0.011; KO vs LC, p=0.0001; KO vs KO+Rosi, p=0.0001. Male mice: LC vs LC+Rosi, p=0.0004; KO vs LC, p=0.0001; KO vs KO+Rosi, NS. Rosi, rosiglitazone chow
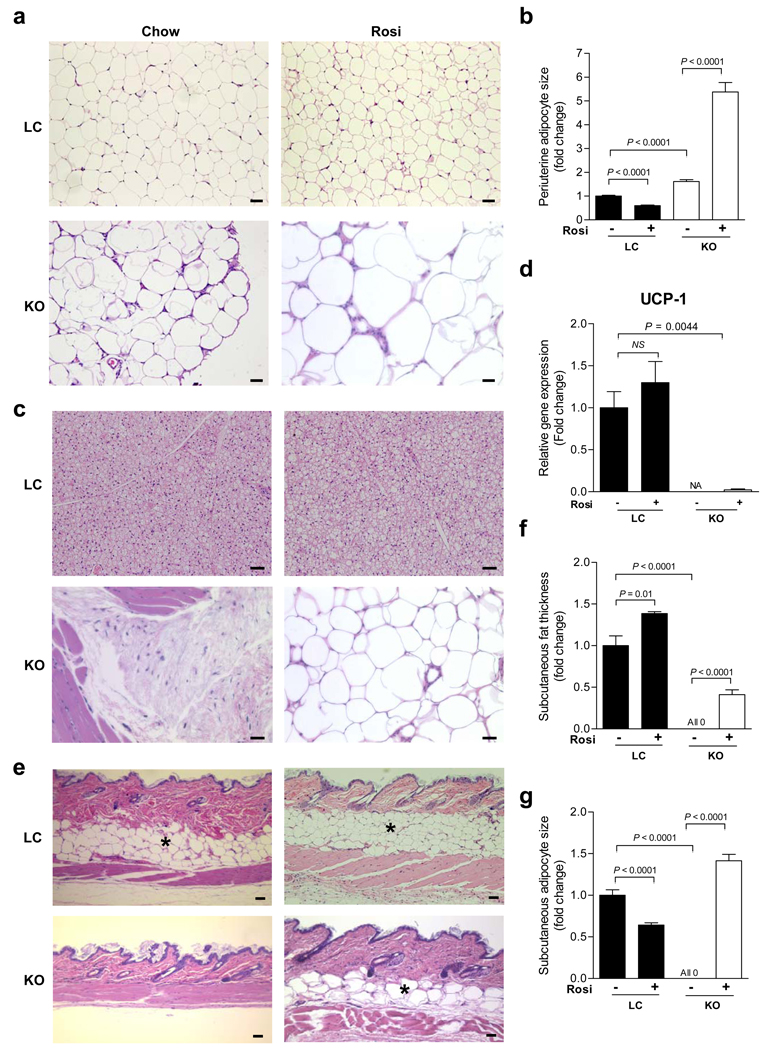
The histological results showed that the peri-uterine adipocyte size of female MORE-PGKO mice was significantly greater than that of LC mice at baseline (Fig. 6a,b), consistent with the fat-specific Ppar-γ-knockout mouse model [16]. Rosiglitazone further increased the adipocyte size significantly in female MORE-PGKO mice while it decreased the size in LC mice (Fig. 6a,b). A similar decrease of adipocyte size in wild-type mice was reported by others [28, 29]. Histologically, no interscapular fat was found in female MORE-PGKO mice at baseline (Fig. 6c). The regrown fat in this depot after the stimulation by rosiglitazone did not have the typical characteristics of BAT (Fig. 6c). Instead, it was characteristic of white adipose tissue. The expression of uncoupling protein 1 (Ucp1), the gene that is characteristically expressed in BAT [30], in the regrown interscapular fat was only 2% of that in BAT from LC mice, further indicating its non-BAT nature (Fig. 6d). No subcutaneous fat was detected by histology in MORE-PGKO mice at baseline; rosiglitazone stimulated the growth of this fat depot in female MORE-PGKO mice (Fig. 6e–g), but not males (data not shown). In the LC mice, rosiglitazone increased the thickness of the subcutaneous layer (Fig. 6f) but decreased the adipocyte size (Fig. 6g), which is consistent with previous reports [28, 31]. Rosiglitazone did not significantly change the body weights of either MORE-PGKO mice or LC mice (ESM Table 1). In addition, male MORE-PGKO mice were hyperphagic compared with their LC counterparts (0.22 ± 0.04 vs 0.15 ± 0.005 g day−1 body weight−1; p = 0.032). However, female MORE-PGKO mice were not (0.15 ± 0.01 vs 0.14 ± 0.005 day−1 body weight−1; p = 0.32).
Fig. 6.
Rosiglitazone increases adiposity in specific depots in female MORE-PGKO mice. a Representative H&E staining of peri-uterine fat from female LC and MORE-PGKO mice without or with weeks of rosiglitazone treatment. The bars indicate 100 µm. b Quantification of adipocyte size of peri-uterine fat from female LC and MORE-PGKO mice. LC vs LC+Rosi, p<0.0001; KO vs LC, p<0.0001; KO vs KO+Rosi, p<0.0001; n=8 for each group. At least 100 adipocytes from each sample were measured. c Representative H&E staining of interscapular fat from female LC and MORE-PGKO mice without or with rosiglitazone treatment. d RT-QPCR results of Ucp1 expression levels of interscapular fat from female LC and MORE-PGKO mice. The mRNA levels were normalised to β-actin. LC vs LC+Rosi, NS; LC vs KO+Rosi, p=0.0044; n=8 for each group. Data for KO not available due to lack of interscapular fat in MORE-PGKO mice at baseline. e Representative H&E staining of subcutaneous fat from female LC and MORE-PGKO mice without or with 8 weeks of rosiglitazone treatment. The subcutaneous fat layers are indicated by the asterisks. Scale bars, 100 µm. f Quantification of subcutaneous fat thickness from female LC and MORE-PGKO mice. LC vs LC+Rosi, p=0.01; KO vs LC, p<0.0001; KO vs KO+Rosi, p<0.0001. n=8 for each group. g Quantification of adipocyte size of subcutaneous fat from female LC and MORE-PGKO mice. LC vs LC+Rosi, p<0.0001; KO vs LC, p<0.0001; KO vs KO+Rosi, p<0.0001. Chow, 5001 rodent chow; Rosi, rosiglitazone chow
Taken together, rosiglitazone stimulated white fat growth in female but not male MORE-PGKO mice in specific depots: peri-uterine, interscapular and subcutaneous. The other depots, including perirenal, peri-ovarian and mesenteric fat, were not changed by rosiglitazone. Data in the ESM showed that expression of oestrogen receptor α (Erα, also known as Esr1) was increased by rosiglitazone in both LC and MORE-PGKO peri-uterine fat, but that of Erβ (also known as Esr2) was not significantly affected (ESM Fig. 6b,c).
Rosiglitazone does not change the percentage of inactivated Ppar-γ allele in adipose tissue of female MORE-PGKO mice
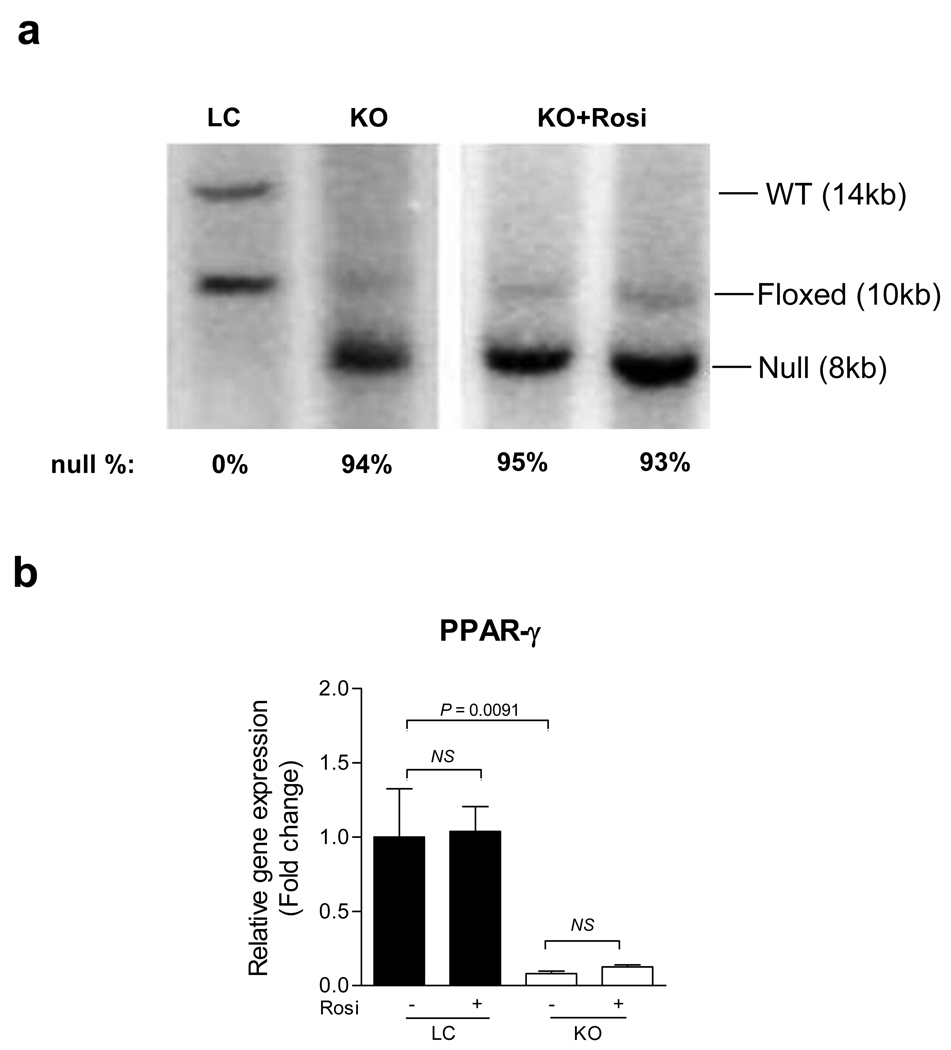
Previous reports have shown that PPAR-γ is required for adipogenesis [24, 32, 33]. TZDs decrease PPAR-γ production in 3T3-L1 adipocytes [34]. The effect of TZDs on adipocyte PPAR-γ production in vivo is unknown. As we discussed before [21], the residual ∼5% unrecombined allele in female MORE-PGKO mouse peri-uterine fat was most probably from the adipocytes that escaped the recombination event (Fig. 7a). After rosiglitazone treatment, the percentage of the unrecombined allele remained ∼5% (Fig. 7a), suggesting the number of PPAR-γ-positive cells was not changed. RT-QPCR results showed that rosiglitazone did not significantly change Ppar-γ expression in peri-uterine fat of LC or MORE-PGKO mice (Fig. 7b).
Fig. 7.
Rosiglitazone does not change Ppar-γ-null allele population in peri-uterine fat of female MORE-PGKO mice. a Representative Southern blot results of peri-uterine fat from female LC and MORE-PGKO mice without or with 8 weeks of rosiglitazone treatment. The endogenous wild-type (WT) allele is 14 kb. The floxed allele is 10 kb. The Cre-recombined null allele is 8 kb. b RT-QPCR results of Ppar-γ expression levels in peri-uterine fat from female LC and MORE-PGKO mice. The mRNA levels were normalised to β-actin. LC vs LC+Rosi, NS; KO vs LC, p=0.0091; KO vs KO+Rosi, NS. n=8 for each group. Rosi, rosiglitazone chow
Rosiglitazone increases M2 marker production in adipose tissue of female MORE-PGKO mice
PPAR-γ activation not only inhibits M1 activation but also promotes M2 activation in inflammatory models [35]. Conversely, macrophage-specific PPAR-γ deficiency leads to insulin resistance [15] and the likely underlying mechanism is impaired M2 activation [14]. Moreover, macrophage polarisation towards M2 protects mice from obesity-induced insulin resistance [9, 10].
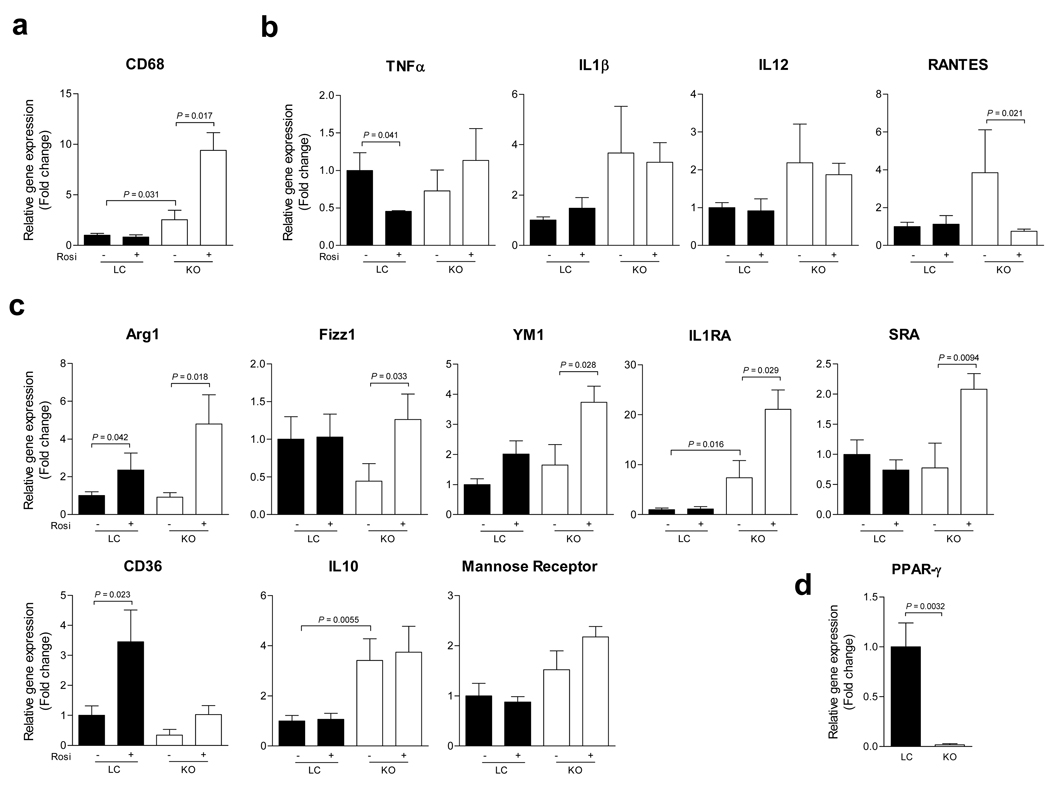
To address whether macrophages play a role in the insulin-sensitising effects of rosiglitazone in female MORE-PGKO mice, we used RT-QPCR to measure markers of M1 and M2 in peri-uterine fat. Gene expression of Cd68, a macrophage marker [14], was elevated in MORE-PGKO fat at baseline and was more dramatically increased by rosiglitazone (Fig. 8a). Rosiglitazone did not significantly change the expression of M1 markers [11, 12] including tumour necrosis factor-α (Tnfα [also known as Tnf]), interleukin 1-β (Il1β [also known as Il1b]), IL12b, except for regulated upon activation normal T cell expressed and secreted (Rantes [also known as Ccl5]), which was decreased in MORE-PGKO fat with treatment (Fig. 8b – e). In contrast, rosiglitazone dramatically increased the expression of a set of M2 markers [11, 12] including arginase 1 (Arg1), found in inflammatory zone 1 (Fizz1 [also known as Retnla]), IL1 receptor antagonist (Il1ra [also known as Il1rn]) and macrophage scavenger receptor A (Sra [also known as Sra1]); the expression of other M2 markers [12, 35], including Cd36, Il10 and mannose receptor, was not significantly affected by rosiglitazone (Fig. 8f – m).
Fig. 8.
Rosiglitazone increases alternatively activated macrophages in peri-uterine fat of female MORE-PGKO mice. a RT-QPCR results of macrophage marker Cd68 in peri-uterine fat. KO vs LC, p=0.031; KO vs KO+Rosi, p<0.017. b–e RT-QPCR results of M1 macrophage markers in peri-uterine fat. (b)Tnfα (LC vs LC+Rosi, p=0.041); (c) Il1β; (d) Il12b; (e) RANTES (KO vs KO+Rosi, p=0.021). f–m RT-QPCR results of M2 macrophage markers in peri-uterine fat. (f) Arg1 (LC vs LC+Rosi, p=0.042; KO vs KO+Rosi, p=0.018); (g) Fizz1 (KO vs KO+Rosi, p=0.033); (h) Ym1 (KO vs KO+Rosi, p=0.028); (i) Ilra (LC vs KO, p=0.016; KO vs KO+Rosi, p=0.029); (j) Sra (KO vs KO+Rosi, p=0.0094); (k) Cd36 (LC vs LC+Rosi, p=0.023); (l) Il10 (LC vs KO, p=0.0055); and (m) mannose receptor. n RT-QPCR results of Ppar-γ expression in peritoneal macrophages. p=0.0032. The mRNA levels were normalised to β-actin. n=8 for each group
Although we have shown ∼95% knockout of Ppar-γ in MORE-PGKO peri-uterine fat (Fig. 7), it is not clear what the expression level of Ppar-γ is in macrophages. RT-QPCR results demonstrated ∼98% reduction of Ppar-γ expression in MORE-PGKO peritoneal macrophages compared with LC (Fig. 8n).
Discussion
TZDs decrease blood glucose by increasing insulin sensitivity in type 2 diabetic patients and animal models [1]. However, the exact mechanisms remain unclear at two levels at least. First, is adipose tissue required for the insulin-sensitising effects of TZDs? Second, is PPARγ required for all of the TZD effects observed? We used the generalised Ppar-γ-knockout mice, which lack at least 95% PPAR-γ in all tissues and are lipodystrophic, to investigate these two questions.
PPAR-γ, TZDs, insulin sensitivity and glucose homeostasis
Rosiglitazone improved insulin sensitivity in female but not male MORE-PGKO mice. However, rosiglitazone improved the glucose tolerance and decreased blood glucose levels in male MORE-PGKO mice. Because the insulin sensitivity in males was not improved, the improvement of glucose homeostasis is most likely due to the higher plasma insulin levels in these mice. Similar to the results at baseline, the female MORE-PGKO mice were more glucose tolerant than the LC mice after rosiglitazone treatment. Again, the higher insulin levels during GTT would account for this. And the insulin sensitivity increase would account for the further increase in glucose tolerance in female MORE-PGKO mice after rosiglitazone treatment. It is worth mentioning that before treatment the male MORE-PGKO mice were diabetic but the females were not, even though both sexes had severe insulin resistance. This difference in glucose homeostasis between sexes might at least partially account for the difference in insulin sensitisation response to rosiglitazone.
Consistent with the insulin-sensitising effect in female but not male MORE-PGKO mice, AKT phosphorylation was elevated in all major insulin target tissues (muscle, liver and fat) of female but not male MORE-PGKO mice by rosiglitazone. These data suggest these insulin target tissues all have increased insulin sensitivity despite the marked deficiency of PPAR-γ. The regrowth of fat is most probably responsible for the increased insulin sensitivity. The lack of insulin-sensitising effects in male MORE-PGKO mice suggests that such effects of rosiglitazone are dependent on PPAR-γ in this lipodystrophic model. We further explored the phosphorylation of a possible mediator, AMPK, and found no significant changes in MORE-PGKO tissues by rosiglitazone (ESM Fig. 7). As discussed in the ESM, the changes in leptin, adiponectin, retinol-binding protein 4, NEFA or triacylglycerol do not explain the changes in insulin sensitivity.
PPAR-γ, TZDs and islet mass
MORE-PGKO mice have greater islet mass than LC mice at baseline, and this effect is even greater than that in islet-specific Ppar-γ-knockout mice, most likely because the latter lack insulin resistance and lipodystrophy [36]. TZDs have been reported to preserve islet structure and function in obese mice and rats [37, 38].
The effects of TZDs on islet mass and function in lipodystrophic models have not been well studied. In rosiglitazone-treated MORE-PGKO mice, the islet mass in the females was unchanged while the plasma insulin levels dropped, probably resulting from the increased insulin sensitivity. However, the islet mass in the male mice further increased and this was accompanied by the further increased plasma insulin levels. Rosiglitazone may have preserved islet function resulting in higher insulin levels in male MORE-PGKO mice.
Depot-specific fat growth by TZD stimulation
Rosiglitazone also stimulated fat growth only in the female MORE-PGKO mice. Oestrogens but not androgens have the capability to induce proliferation and differentiation of pre-adipocytes [39]. Further, these effects are depot specific: generally pre-adipocytes from a subcutaneous fat depot are more responsive than those from abdominal fat [39], mostly consistent with our observations. Pre-adipocytes from the subcutaneous fat depot can be induced to differentiate by TZDs, but those from the omental fat depot are refractory [40]. More recently, it has been shown that fat depots, particularly intra-abdominal fat, from female mice are more insulin sensitive than those from males and that sex hormones play a central role [41]. These data imply that fat growth and insulin sensitisation by TZD in MORE-PGKO mice are likely to be related to sex hormones. Although TZD was effective in stimulating not only subcutaneous fat growth but also the growth of interscapular and peri-uterine fat, in female MORE-PGKO mice the other visceral depots—including mesenteric fat, perirenal and peri-ovarian fat—did not grow, suggesting different TZD responsiveness of visceral fat depots. The mechanisms responsible for the different responses in peri-uterine compared with other visceral fat depots need further investigation. The increases of ERα in peri-uterine fat by rosiglitazone may contribute to adipogenesis and ultimately insulin sensitisation.
TZDs cause weight gain in humans. However, the effects of TZDs on body weight and adiposity in animals are not consistent. Pioglitazone increased body weight and adiposity in obese rats [42], but troglitazone did not [43]. In wild-type animals, body weight and adiposity were either increased or not affected by TZDs [37, 43, 44]. TZDs can either increase [19] or decrease white adipose tissue (WAT) weight [45] in wild-type mice. In lipodystrophic mice, TZDs did not affect body weight or adiposity [46]. These apparent inconsistencies probably reflect, at least in part, differences in genetic background and age. Our data showed that rosiglitazone did not affect the total adiposity and WAT weight of LC mice. BAT weights were increased by rosiglitazone in LC mice, consistent with a previous report [45]. Our data on body weight are consistent with those from the A-ZIP lipodystrophic mice [46].
PPAR-γ, TZDs, adipocyte size and insulin sensitivity
TZDs decrease adipocyte size in obese and wild-type rats and mice and this decrease is thought to be part of the mechanisms of the insulin-sensitising effects of TZDs [28, 29, 42, 43]. Fat-specific deletion of Ppar-γ in mice causes hypertrophy of adipocytes [16]. Similarly, the MORE-PGKO female mice have hypertrophic adipocytes. The size of adipocytes was further increased by rosiglitazone treatment while the insulin sensitivity was improved, which is contrary to the dogma that TZDs increase insulin sensitivity by, at least in part, decreasing adipocyte size. However, most of the studies that link the insulin-sensitising effects of TZDs to decreased adipocyte size were performed in obese animal models [29, 42, 43] and similar experiments in lipodystrophic models have not been reported. It is clear that when lipodystrophic mice are given fat transplantation their insulin sensitivity improves [26, 27]. Under lipodystrophic conditions, the fat mass might be a more important factor than adipocyte size for affecting insulin sensitivity.
TZDs and PPAR-γ expression in adipose tissue
PPAR-γ is required for adipogenesis in vivo [24, 32, 33]. TZDs decrease Ppar-γ expression in mature adipocytes in vitro [34]. Our data demonstrate that rosiglitazone does not change Ppar-γ expression in adipose tissue in vivo. Neither does rosiglitazone change the proportion of unrecombined allele in MORE-PGKO adipose tissue. It remains unclear whether the regrowth of fat is independent of PPAR-γ because of the difficulty of staining for nuclear PPAR-γ and unambiguously determining whether the adipocytes are PPAR-γ positive. Therefore, it remains uncertain whether fat could have arisen from a few stem cells that escaped recombination.
PPAR-γ, TZDs, macrophage polarisation and insulin resistance
Macrophage polarisation is increasingly appreciated as an important mechanism in regulating insulin sensitivity [6]. PPAR-γ is an important regulator of macrophage polarisation. PPAR-γ agonists promote M2 differentiation of human monocytes and PPAR-γ antagonists inhibit this effect [7]. Further, rosiglitazone stimulates M2 macrophage infiltration into adipose tissue, which improves insulin sensitivity in an obese mouse model [47].
Our data suggest that rosiglitazone increases M2 macrophages and this may be associated with its effects on insulin sensitisation and fat expansion in the lipodystrophic MORE-PGKO mice. Future studies will determine whether the increase of M2 in adipose tissue is due to more recruitment or more shift from M1. In addition, M2 activation by rosiglitazone may occur in macrophages that lack PPAR-γ, suggesting that PPAR-γ is not required. Although PPAR-δ can be activated by TZDs in macrophages, in vitro data suggest that it does not mediate the effects of rosiglitazone in M2 activation (ESM Fig. 8).
Possible mechanisms for non-PPAR-γ effects of TZDs
Rosiglitazone induced fat growth, macrophage polarisation and insulin sensitisation in female MORE-PGKO mice, suggesting that these effects might be independent of PPAR-γ. TZDs have been shown to promote growth of bronchial epithelial cells independent of PPAR-γ, instead, through GPR40, a G-protein-coupled receptor [48]. GPR40 can also act as a mediator for the rosiglitazone effects in female MORE-PGKO mice. In addition, TZDs can work through affecting the ERα pathway in cancer cells [49]. Such a mechanism may work in our MORE-PGKO model as well. In fact, our data demonstrated that rosiglitazone increased the expression of Erα in peri-uterine fat. Another possibility is that rosiglitazone binds to mitochondrial protein ‘mitoNEET’ to have its effects. Pioglitazone has been shown to bind to mitoNEET [50]. Future studies will explore these possibilities.
In summary, the stimulation of fat growth by rosiglitazone in female mice is sufficient to improve insulin sensitivity when 95% of PPAR-γ is deleted. This improvement of insulin sensitivity is not likely to be due to changes in adipokines or lipids. Instead, it may be related to the increase in M2 macrophages in adipose tissue by rosiglitazone that occurs independent of PPAR-γ. In contrast, rosiglitazone improves glucose homeostasis in male mice by increasing insulin production independent of changes in insulin sensitivity or adiposity.
Supplementary Material
Acknowledgements
This work was funded by grants R01HL083201 from the National Heart, Lung, and Blood Institute, NIH and 1-08-RA-137 from American Diabetes Association (to R. M. Mortensen), R01HD040895 from the National Institute of Child Health and Human Development, NIH (to D. S. Milstone). S. Z. Duan is a recipient of an American Heart Association postdoctoral fellowship award (0825861G).
Abbreviations
- BAT
Brown adipose tissue
- DEXA
Dual-energy x-ray absorptiometry
- GTT
Glucose tolerance test
- H&E
haematoxylin and eosin
- ITT
Insulin tolerance test
- KO
Knockout
- LC
Littermate control
- M1
Classically activated macrophages
- M2
Alternatively activated macrophages
- MORE-PGKO
Mox2-Cre-Ppar-γ-knockout
- PPAR-γ
Peroxisome-proliferator-activated receptor-γ
- RT-QPCR
reverse transcription quantitative PCR
- TZDs
Thiazolidinediones
Footnotes
Duality of interest
The authors declare that there is no duality of interest with this manuscript.
References
- 1.Berger JP, Akiyama TE, Meinke PT. PPARs: therapeutic targets for metabolic disease. Trends Pharmacol Sci. 2005;26:244–251. doi: 10.1016/j.tips.2005.03.003. [DOI] [PubMed] [Google Scholar]
- 2.Lehmann JM, Moore LB, Smith-Oliver TA, Wilkison WO, Willson TM, Kliewer SA. An antidiabetic thiazolidinedione is a high affinity ligand for peroxisome proliferator-activated receptor gamma (PPAR gamma) J Biol Chem. 1995;270:12953–12956. doi: 10.1074/jbc.270.22.12953. [DOI] [PubMed] [Google Scholar]
- 3.Burant CF, Sreenan S, Hirano K, et al. Troglitazone action is independent of adipose tissue. J Clin Invest. 1997;100:2900–2908. doi: 10.1172/JCI119839. [DOI] [PMC free article] [PubMed] [Google Scholar]
- 4.Chao L, Marcus-Samuels B, Mason MM, et al. Adipose tissue is required for the antidiabetic, but not for the hypolipidemic, effect of thiazolidinediones. J Clin Invest. 2000;106:1221–1228. doi: 10.1172/JCI11245. [DOI] [PMC free article] [PubMed] [Google Scholar]
- 5.Ricote M, Li AC, Willson TM, Kelly CJ, Glass CK. The peroxisome proliferator-activated receptor-gamma is a negative regulator of macrophage activation. Nature. 1998;391:79–82. doi: 10.1038/34178. [DOI] [PubMed] [Google Scholar]
- 6.Schenk S, Saberi M, Olefsky JM. Insulin sensitivity: modulation by nutrients and inflammation. J Clin Invest. 2008;118:2992–3002. doi: 10.1172/JCI34260. [DOI] [PMC free article] [PubMed] [Google Scholar]
- 7.Bouhlel MA, Derudas B, Rigamonti E, et al. PPARgamma activation primes human monocytes into alternative M2 macrophages with anti-inflammatory properties. Cell Metab. 2007;6:137–143. doi: 10.1016/j.cmet.2007.06.010. [DOI] [PubMed] [Google Scholar]
- 8.Lumeng CN, Bodzin JL, Saltiel AR. Obesity induces a phenotypic switch in adipose tissue macrophage polarization. J Clin Invest. 2007;117:175–184. doi: 10.1172/JCI29881. [DOI] [PMC free article] [PubMed] [Google Scholar]
- 9.Kang K, Reilly SM, Karabacak V, et al. Adipocyte-derived Th2 cytokines and myeloid PPARdelta regulate macrophage polarization and insulin sensitivity. Cell Metab. 2008;7:485–495. doi: 10.1016/j.cmet.2008.04.002. [DOI] [PMC free article] [PubMed] [Google Scholar]
- 10.Odegaard JI, Ricardo-Gonzalez RR, Red Eagle A, et al. Alternative M2 activation of Kupffer cells by PPARdelta ameliorates obesity-induced insulin resistance. Cell Metab. 2008;7:496–507. doi: 10.1016/j.cmet.2008.04.003. [DOI] [PMC free article] [PubMed] [Google Scholar]
- 11.Martinez FO, Sica A, Mantovani A, Locati M. Macrophage activation and polarization. Front Biosci. 2008;13:453–461. doi: 10.2741/2692. [DOI] [PubMed] [Google Scholar]
- 12.Gordon S. Alternative activation of macrophages. Nat Rev Immunol. 2003;3:23–35. doi: 10.1038/nri978. [DOI] [PubMed] [Google Scholar]
- 13.Mosser DM, Edwards JP. Exploring the full spectrum of macrophage activation. Nat Rev Immunol. 2008;8:958–969. doi: 10.1038/nri2448. [DOI] [PMC free article] [PubMed] [Google Scholar]
- 14.Odegaard JI, Ricardo-Gonzalez RR, Goforth MH, et al. Macrophage-specific PPARgamma controls alternative activation and improves insulin resistance. Nature. 2007;447:1116–1120. doi: 10.1038/nature05894. [DOI] [PMC free article] [PubMed] [Google Scholar]
- 15.Hevener AL, Olefsky JM, Reichart D, et al. Macrophage PPAR gamma is required for normal skeletal muscle and hepatic insulin sensitivity and full antidiabetic effects of thiazolidinediones. J Clin Invest. 2007;117:1658–1669. doi: 10.1172/JCI31561. [DOI] [PMC free article] [PubMed] [Google Scholar]
- 16.He W, Barak Y, Hevener A, et al. Adipose-specific peroxisome proliferator-activated receptor gamma knockout causes insulin resistance in fat and liver but not in muscle. Proc Natl Acad Sci U S A. 2003;100:15712–15717. doi: 10.1073/pnas.2536828100. [DOI] [PMC free article] [PubMed] [Google Scholar]
- 17.Hevener AL, He W, Barak Y, et al. Muscle-specific Pparg deletion causes insulin resistance. Nat Med. 2003;9:1491–1497. doi: 10.1038/nm956. [DOI] [PubMed] [Google Scholar]
- 18.Matsusue K, Haluzik M, Lambert G, et al. Liver-specific disruption of PPARgamma in leptin-deficient mice improves fatty liver but aggravates diabetic phenotypes. J Clin Invest. 2003;111:737–747. doi: 10.1172/JCI17223. [DOI] [PMC free article] [PubMed] [Google Scholar]
- 19.Gavrilova O, Haluzik M, Matsusue K, et al. Liver peroxisome proliferator-activated receptor gamma contributes to hepatic steatosis, triglyceride clearance, and regulation of body fat mass. J Biol Chem. 2003;278:34268–34276. doi: 10.1074/jbc.M300043200. [DOI] [PubMed] [Google Scholar]
- 20.Tontonoz P, Hu E, Graves RA, Budavari AI, Spiegelman BM. mPPAR gamma 2: tissue-specific regulator of an adipocyte enhancer. Genes Dev. 1994;8:1224–1234. doi: 10.1101/gad.8.10.1224. [DOI] [PubMed] [Google Scholar]
- 21.Duan SZ, Ivashchenko CY, Whitesall SE, et al. Hypotension, lipodystrophy, and insulin resistance in generalized PPARgamma-deficient mice rescued from embryonic lethality. J Clin Invest. 2007;117:812–822. doi: 10.1172/JCI28859. [DOI] [PMC free article] [PubMed] [Google Scholar]
- 22.Sowell MO, Ye C, Ricupero DA, et al. Targeted inactivation of alphai2 or alphai3 disrupts activation of the cardiac muscarinic K+ channel, IK+Ach, in intact cells. Proc Natl Acad Sci U S A. 1997;94:7921–7926. doi: 10.1073/pnas.94.15.7921. [DOI] [PMC free article] [PubMed] [Google Scholar]
- 23.Duan SZ, Ivashchenko CY, Russell MW, Milstone DS, Mortensen RM. Cardiomyocyte-specific knockout and agonist of peroxisome proliferator-activated receptor-gamma both induce cardiac hypertrophy in mice. Circ Res. 2005;97:372–379. doi: 10.1161/01.RES.0000179226.34112.6d. [DOI] [PubMed] [Google Scholar]
- 24.Rosen ED, Sarraf P, Troy AE, et al. PPAR gamma is required for the differentiation of adipose tissue in vivo and in vitro. Mol Cell. 1999;4:611–617. doi: 10.1016/s1097-2765(00)80211-7. [DOI] [PubMed] [Google Scholar]
- 25.Saltiel AR. Putting the brakes on insulin signaling. N Engl J Med. 2003;349:2560–2562. doi: 10.1056/NEJMcibr031668. [DOI] [PubMed] [Google Scholar]
- 26.Kim JK, Gavrilova O, Chen Y, Reitman ML, Shulman GI. Mechanism of insulin resistance in A-ZIP/F-1 fatless mice. J Biol Chem. 2000;275:8456–8460. doi: 10.1074/jbc.275.12.8456. [DOI] [PubMed] [Google Scholar]
- 27.Gavrilova O, Marcus-Samuels B, Graham D, et al. Surgical implantation of adipose tissue reverses diabetes in lipoatrophic mice. J Clin Invest. 2000;105:271–278. doi: 10.1172/JCI7901. [DOI] [PMC free article] [PubMed] [Google Scholar]
- 28.Yamauchi T, Kamon J, Waki H, et al. The mechanisms by which both heterozygous peroxisome proliferator-activated receptor gamma (PPARgamma) deficiency and PPARgamma agonist improve insulin resistance. J Biol Chem. 2001;276:41245–41254. doi: 10.1074/jbc.M103241200. [DOI] [PubMed] [Google Scholar]
- 29.Tsuchida A, Yamauchi T, Takekawa S, et al. Peroxisome proliferator-activated receptor (PPAR){alpha} activation increases adiponectin receptors and reduces obesity-related inflammation in adipose tissue: comparison of activation of PPAR{alpha}, PPAR{gamma}, and their combination. Diabetes. 2005;54:3358–3370. doi: 10.2337/diabetes.54.12.3358. [DOI] [PubMed] [Google Scholar]
- 30.Cannon B, Nedergaard J. Brown adipose tissue: function and physiological significance. Physiol Rev. 2004;84:277–359. doi: 10.1152/physrev.00015.2003. [DOI] [PubMed] [Google Scholar]
- 31.Miyazaki Y, Mahankali A, Matsuda M, et al. Effect of pioglitazone on abdominal fat distribution and insulin sensitivity in type 2 diabetic patients. J Clin Endocrinol Metab. 2002;87:2784–2791. doi: 10.1210/jcem.87.6.8567. [DOI] [PubMed] [Google Scholar]
- 32.Barak Y, Nelson MC, Ong ES, et al. PPAR gamma is required for placental, cardiac, and adipose tissue development. Mol Cell. 1999;4:585–595. doi: 10.1016/s1097-2765(00)80209-9. [DOI] [PubMed] [Google Scholar]
- 33.Tontonoz P, Spiegelman BM. Fat and beyond: the diverse biology of PPARgamma. Annu Rev Biochem. 2008;77:289–312. doi: 10.1146/annurev.biochem.77.061307.091829. [DOI] [PubMed] [Google Scholar]
- 34.Watanabe M, Inukai K, Katagiri H, Awata T, Oka Y, Katayama S. Regulation of PPAR gamma transcriptional activity in 3T3-L1 adipocytes. Biochem Biophys Res Commun. 2003;300:429–436. doi: 10.1016/s0006-291x(02)02860-7. [DOI] [PubMed] [Google Scholar]
- 35.Van Ginderachter JA, Movahedi K, van den Bossche J, de Baetselier P. Macrophages, PPARs, and Cancer. PPAR Res. 2008;2008:169414. doi: 10.1155/2008/169414. [DOI] [PMC free article] [PubMed] [Google Scholar]
- 36.Rosen ED, Kulkarni RN, Sarraf P, et al. Targeted elimination of peroxisome proliferator-activated receptor gamma in beta cells leads to abnormalities in islet mass without compromising glucose homeostasis. Mol Cell Biol. 2003;23:7222–7229. doi: 10.1128/MCB.23.20.7222-7229.2003. [DOI] [PMC free article] [PubMed] [Google Scholar]
- 37.Kawasaki F, Matsuda M, Kanda Y, Inoue H, Kaku K. Structural and functional analysis of pancreatic islets preserved by pioglitazone in db/db mice. Am J Physiol Endocrinol Metab. 2005;288:E510–E518. doi: 10.1152/ajpendo.00128.2004. [DOI] [PubMed] [Google Scholar]
- 38.Diani AR, Peterson T, Sawada GA, et al. Ciglitazone, a new hypoglycaemic agent. 4. Effect on pancreatic islets of C57BL/6J-ob/ob and C57BL/KsJ-db/db mice. Diabetologia. 1984;27:225–234. doi: 10.1007/BF00273811. [DOI] [PubMed] [Google Scholar]
- 39.Anderson LA, McTernan PG, Barnett AH, Kumar S. The effects of androgens and estrogens on preadipocyte proliferation in human adipose tissue: influence of gender and site. J Clin Endocrinol Metab. 2001;86:5045–5051. doi: 10.1210/jcem.86.10.7955. [DOI] [PubMed] [Google Scholar]
- 40.Adams M, Montague CT, Prins JB, et al. Activators of peroxisome proliferator-activated receptor gamma have depot-specific effects on human preadipocyte differentiation. J Clin Invest. 1997;100:3149–3153. doi: 10.1172/JCI119870. [DOI] [PMC free article] [PubMed] [Google Scholar]
- 41.Macotela Y, Boucher J, Tran TT, Kahn CR. Sex and depot differences in adipocyte insulin sensitivity and glucose metabolism. Diabetes. 2009;58:803–812. doi: 10.2337/db08-1054. [DOI] [PMC free article] [PubMed] [Google Scholar]
- 42.de Souza CJ, Eckhardt M, Gagen K, et al. Effects of pioglitazone on adipose tissue remodeling within the setting of obesity and insulin resistance. Diabetes. 2001;50:1863–1871. doi: 10.2337/diabetes.50.8.1863. [DOI] [PubMed] [Google Scholar]
- 43.Okuno A, Tamemoto H, Tobe K, et al. Troglitazone increases the number of small adipocytes without the change of white adipose tissue mass in obese Zucker rats. J Clin Invest. 1998;101:1354–1361. doi: 10.1172/JCI1235. [DOI] [PMC free article] [PubMed] [Google Scholar]
- 44.Fujiwara T, Wada M, Fukuda K, et al. Characterization of CS-045, a new oral antidiabetic agent, II. Effects on glycemic control and pancreatic islet structure at a late stage of the diabetic syndrome in C57BL/KsJ-db/db mice. Metabolism. 1991;40:1213–1218. doi: 10.1016/0026-0495(91)90218-l. [DOI] [PubMed] [Google Scholar]
- 45.Rzonca SO, Suva LJ, Gaddy D, Montague DC, Lecka-Czernik B. Bone is a target for the antidiabetic compound rosiglitazone. Endocrinology. 2004;145:401–406. doi: 10.1210/en.2003-0746. [DOI] [PMC free article] [PubMed] [Google Scholar]
- 46.Kim JK, Fillmore JJ, Gavrilova O, et al. Differential effects of rosiglitazone on skeletal muscle and liver insulin resistance in A-ZIP/F-1 fatless mice. Diabetes. 2003;52:1311–1318. doi: 10.2337/diabetes.52.6.1311. [DOI] [PubMed] [Google Scholar]
- 47.Stienstra R, Duval C, Keshtkar S, van der Laak J, Kersten S, Muller M. Peroxisome proliferator-activated receptor gamma activation promotes infiltration of alternatively activated macrophages into adipose tissue. J Biol Chem. 2008;283:22620–22627. doi: 10.1074/jbc.M710314200. [DOI] [PubMed] [Google Scholar]
- 48.Gras D, Chanez P, Urbach V, Vachier I, Godard P, Bonnans C. Thiazolidinediones induce proliferation of human bronchial epithelial cells through the GPR40 receptor. Am J Physiol Lung Cell Mol Physiol. 2009;296:L970–L978. doi: 10.1152/ajplung.90219.2008. [DOI] [PubMed] [Google Scholar]
- 49.Lecomte J, Flament S, Salamone S, et al. Disruption of ERalpha signalling pathway by PPARgamma agonists: evidences of PPARgamma-independent events in two hormone-dependent breast cancer cell lines. Breast Cancer Res Treat. 2008;112:437–451. doi: 10.1007/s10549-007-9886-z. [DOI] [PubMed] [Google Scholar]
- 50.Colca JR, McDonald WG, Waldon DJ, et al. Identification of a novel mitochondrial protein ("mitoNEET") cross-linked specifically by a thiazolidinedione photoprobe. Am J Physiol Endocrinol Metab. 2004;286:E252–E260. doi: 10.1152/ajpendo.00424.2003. [DOI] [PubMed] [Google Scholar]
Associated Data
This section collects any data citations, data availability statements, or supplementary materials included in this article.


