

Abstract
Background
Transfusional therapy for thalassemia major and sickle cell disease can lead to iron deposition and damage to the heart, liver, and endocrine organs. Iron causes the MRI parameters T1, T2, and T2* to shorten in these organs, which creates a potential mechanism for iron quantification. However, because of the danger and variability of cardiac biopsy, tissue validation of cardiac iron estimates by MRI has not been performed. In this study, we demonstrate that iron produces similar T1, T2, and T2* changes in the heart and liver using a gerbil iron-overload model.
Methods and Results
Twelve gerbils underwent iron dextran loading (200 mg · kg−1 · wk−1) from 2 to 14 weeks; 5 age-matched controls were studied as well. Animals had in vivo assessment of cardiac T2* and hepatic T2 and T2* and postmortem assessment of cardiac and hepatic T1 and T2. Relaxation measurements were performed in a clinical 1.5-T magnet and a 60-MHz nuclear magnetic resonance relaxometer. Cardiac and liver iron concentrations rose linearly with administered dose. Cardiac 1/T2*, 1/T2, and 1/T1 rose linearly with cardiac iron concentration. Liver 1/T2*, 1/T2, and 1/T1 also rose linearly, proportional to hepatic iron concentration. Liver and heart calibrations were similar on a dry-weight basis.
Conclusions
MRI measurements of cardiac T2 and T2* can be used to quantify cardiac iron. The similarity of liver and cardiac iron calibration curves in the gerbil suggests that extrapolation of human liver calibration curves to heart may be a rational approximation in humans.
Keywords: magnetic resonance imaging, anemia, iron overload, thalassemia, cardiomyopathy
Thalassemia is the most common genetic disease worldwide and is becoming an important health challenge in the United States because of increasing Asian immigration.1,2 Chronic blood transfusion produces progressive tissue iron loading and toxicity, which results in severe endocrine, liver, and cardiac failure. Iron chelation with deferoxamine has dramatically improved length and quality of life for thalassemia patients; however, cardiac complications remain common.3 Long-term outcome studies have correlated liver iron concentrations and high ferritin values with subsequent risk of cardiac iron toxicity; hence, these parameters are often used as surrogates for cardiac risk.4–6 However, despite monitoring of the iron burden by these indices, cardiac failure and arrhythmias remain the leading cause of death in thalassemia patients.7,8 Cardiac function monitored conventionally remains “normal” until clinical symptoms develop, with relatively high subsequent mortality.9–11 Thus, sensitive techniques to assess cardiac iron load and its response to chelator therapy are critically needed to better manage thalassemia major patients.
Cardiac MRI measurements of the iron-sensitive relaxation time, T2*, show promise for identifying patients with pre-clinical myocardial iron overload.12–14 Patients with low cardiac T2* have significantly greater risk of resting systolic dysfunction and need for cardiac medications than patients with T2* in the normal range.12,14,15 No correlation between cardiac T2* and liver iron has been observed, which challenges the view that liver iron adequately predicts cardiac iron burden. However, some investigators have questioned whether cardiac T2* changes represent cardiac iron or instead represent changes in tissue oxygenation and blood flow.16,17 In humans, liver T2* correlates well with hepatic iron concentration.12,18 However, direct tissue validation of cardiac T2* measurements has not been performed because endomyocardial biopsy is a dangerous and unreliable indicator of cardiac iron overload.19,20
Therefore, the purpose of the present study was to validate T2* measurements as a metric of liver and cardiac iron in a gerbil model of iron cardiomyopathy. Iron dextran loading of the Mongolian gerbil mimics many of the functional and ECG abnormalities observed in human iron cardiomyopathy.21–24 As a secondary end point, we also investigated the magnetic relaxation parameters T1 and T2 in liver and heart. We hypothesized that myocardial 1/T2* would increase linearly with iron concentration, similar to results observed in human liver.
Methods
Animal Model
Experiments were conducted on 8- to 10-week-old bacterial-pathogen–free female gerbils purchased from Charles River Laboratories (Wilmington, Mass). Animals were housed in a pathogen-free environment monitored by a sentinel animal. Gerbils had free access to water and standard rodent diet. Animal facilities conform to the National Institutes of Health Guide for the Care and Use of Laboratory Animals. Investigations were approved by the institutional Animal Care and Use Committee at the Saban Research Institute at Children’s Hospital Los Angeles. Iron overload was induced with a standard protocol25 of weekly subcutaneous iron dextran injections (ferric hydroxide-dextran complex; Sigma Chemical Co) at 200 mg/kg per dose. Under this protocol, it takes approximately 10 to 20 weeks to achieve cardiac iron levels consistent with human autopsy values.21,22 ECG or functional abnormalities typically take much longer to manifest, with a median survival of >1 year.21,22
A total of 12 animals were iron loaded, and 5 animals served as controls. Two iron-loaded animals were imaged and killed at each of the following time points: 2, 4, 6, 8, 10, and 14 weeks. One control animal was imaged and killed at 0, 2, 4, 10, and 14 weeks. MRI reproducibility was assessed in 2 unloaded animals and 4 iron-loaded animals by performing complete MRI examinations 3 to 7 days apart.
MRI Imaging
All studies were performed on a clinical General Electric 1.5-T CVi system (General Electric Medical Systems). Custom isoflurane anesthesia delivery systems and imaging enclosures were used to anesthetize and secure the animals during imaging. Temperature was maintained through passive thermal capacitors within the enclosure. A 3-loop solenoidal coil was coupled through a custom transmit-receive switch and input to the scanner as a standard surface coil.
Cardiac T2* was measured at 6 cardiac levels with single-echo/gradient-echo sequences that had the following parameters: effective repetition time (TR) of ≈650 ms (2 to 4 R-R intervals, heart rate ranges from 180 to 360 bpm depending on the depth and duration of anesthesia); echo time (TE) of 5.6, 6.5, 7.5, 9, 12, and 15 ms; number of excitations=2; field of view=4.5×6 cm; slice thickness=1 mm; 0.1-mm gap; matrix=128×256; and bandwidth=16 kHz. Multiecho cardiac T2* could not be performed at the heart rates and imaging resolution necessary for gerbil imaging. Cardiac T2 was not measured in vivo because through-plane cardiac motion resulted in large artifactual signal decay from inadequate signal refocusing not present in the cardiac T2* measurements. To compensate for this deficiency, single-echo and multiecho T2 analysis was performed on fresh postmortem samples with a Bruker Minispectrometer (described below).
Liver T2* was measured with a multiphase, ungated, single-echo/gradient-echo sequence, TR=25 ms, TE=1.9 to 5.9 ms at 0.25-ms intervals, bandwidth=83 kHz, slice thickness=3 mm, 128×128 matrix, and field of view=8×4 cm. Liver T2 was measured with a Hahn 90°-90° echo sequence with TR=300 ms; TE=4.5, 6, 7.5, 9, 12, 18, and 30 ms; field of view=4 cm; slice thickness=3 mm; matrix=64×64; and bandwidth=16 kHz. The 2 liver sequences are nearly identical to the previously validated techniques used for human iron overload except that imaging parameters (including echo times) had to be scaled to gerbil dimensions.18
Image and Processing
Cardiac T2* was assessed in 3 to 5 consecutive slices by tracing a region of interest that encompassed the interventricular septum and anterior left ventricular wall. Relative signal intensity at each TE was fit to a monoexponential function:
| (1) |
where S(TE) is the signal intensity at echo time TE and A is the signal amplitude at a TE of zero. Equation 1 provided a simple and robust fit to the cardiac T2* data. At higher iron levels, such as in the liver, a constant offset had to be added to Equation 1 to compensate for contributions from background noise bias, digitizer offsets, and iron-poor tissues, ie:
| (2) |
where C is a constant offset parameter and the other variables are the same as previously described. Median 1/T2* was compared with cardiac iron concentration by linear regression. The median was used instead of the mean because motion and flow artifacts occasionally produced large outliers. MRI T2 values were also calculated with Equations 1 and 2. Nuclear magnetic resonance (NMR) T1 and T2 values were generated by the Bruker relaxometer.
Because the liver position does not change between echo times, a “map” of hepatic T2 and T2* was constructed by fitting Equation 2 to every pixel in the image. By tracing the whole liver outline, a histogram of 1/T2 and 1/T2* values was generated; the median of this distribution (over all slices) was compared with hepatic iron concentration by linear regression. The use of pixel-wise calculations and nonparametric statistics improved robustness to image artifacts. The standard deviation of slice-to-slice variation in median 1/T2 and 1/T2* was used to generate confidence intervals for the heart and liver iron estimates.
Tissue Processing
After imaging, animals were killed by CO2 intoxication (standard operating procedures of the institutional Animal Care and Use Committee). Heart and liver were rapidly excised and weighed. A short-axis cross section of the heart ≈3 mm thick was weighed (wet) and sent for quantitative iron measurements (Mayo Medical Laboratories, Rochester, Minn). The laboratory reported total dry weight of the specimen (oven-dried) as well as iron content per dry weight of tissue. The cardiac apex was transferred to a polytetrafluoroethylene (PTFE) holder for NMR relaxometer measurements. The rest of the heart was fixed in formalin, paraffin embedded, and sectioned for histological analysis. Hematoxylin and eosin, Masson’s trichrome, and Prussian blue stain were used to qualitatively assess iron deposition, cell integrity, and fibrosis. A roughly 5×5×5-mm liver sample was cut from the right lobe of the liver, weighed (wet), and sent for quantitative iron determination. A similar specimen was cut and transferred to a PTFE holder for NMR relaxometer measurements. The remainder of the liver was fixed in 10% formalin, embedded, sectioned, and stained as described previously.
NMR Relaxometer Studies
Tissue (heart/liver) cores were placed in a custom-milled 5/32 PTFE cylinder and sealed with plastic wrap and PTFE tape. The PTFE cylinder subsequently was positioned in an 8-mm glass NMR tube. R1, single-echo T2, and multiecho T2 measurements were performed at 37°C in a Bruker mini-spectrometer within 30 minutes of animal euthanasia. Single-echo T2 was calculated by single Hahn spin-echo techniques with 20 echo times logarithmically distributed between 2 and 60 ms. Other parameters included TR of 4 seconds (≈5 times the tissue T1) and 4 excitations with phase cycling. Data were fit to a monoexponential with a Levenberg-Marquardt algorithm. T1 was measured with an inversion-recovery sequence, 4-second recycle time, and 10 inversion times arranged logarithmically up to 2 seconds. After the NMR measurements were completed, the apical heart sample was sent to the referral clinical laboratory for iron quantification.
Statistical Methods
MRI relaxation parameters 1/T2, 1/T2*, and 1/T1 were compared with assayed iron content by weighted least-squares linear regression (JMP 5.1.2, SAS). Cardiac and liver MRI measurements were weighted by slice-to-slice variability. Because the NMR measurements were collected from a single anatomic sample, T1 and T2 uncertainties were derived from the Levenberg-Marquardt fitting algorithm (Bruker Instruments). Slopes of linear regression equations were compared between liver and heart by standard techniques.26
Paired reproducibility values were compared by Bland-Altman analysis. Median relative deviations were also reported because they were more robust with respect to outliers.
Results
Organ Iron Accumulation and Histology
Control animals had minimal detectable iron at baseline and did not accumulate iron in the liver or the heart over the 14-week study interval (Table 1). Organ size, organ iron content, and wet-to-dry-weight ratios also did not change over the study period. Iron dextran injections increased iron concentration and iron content linearly (Figure 1). Chemically assayed heart iron concentration increased 0.078 mg/g wet wt per week (r2=0.98); iron content paralleled this trajectory, rising 0.022 mg/wk (r2=0.92, not shown). Similarly, assayed liver iron concentration increased 1.15 mg/g wet wt per week (r2=0.93) over a 10-week interval, and liver iron content increased 3.82 mg/wk (r2=0.96). From 10 to 14 weeks, liver iron concentration plateaued, but iron content increased along its prior trajectory, reflecting increased organ weight. Mean liver weight of the iron-loaded animals was increased to 3.39±0.39 g, but correlation with length of iron dextran loading was quite variable (r2=0.30, slope ≈50 mg/wk). Wet-to-dry ratio was independent of iron loading for both organs, yielding 3.77±0.55 for liver and 5.07±0.51 for heart (data pooled from 5 controls and 12 iron-loaded animals).
TABLE 1.
Iron Concentrations in 5 Control Animals
| Liver | Heart | |
|---|---|---|
| Iron concentration, mg/g wet weight | 0.247±0.144 | 0.089±0.013 |
| Organ wet weight, g | 2.13±0.26 | 0.333±0.042 |
| Iron content, mg | 0.507±0.291 | 0.029±0.005 |
| Wet/dry weight ratio | 3.66±0.44 | 5.25±0.65 |
Data represent mean±SD.
Figure 1.

Top, Prussian blue staining of liver (left) and heart (right) at baseline and at 4 and 14 weeks of iron dextran loading. Bottom, Hepatic and cardiac iron concentration (in mg/g wet weight) as a function of weeks of iron loading. Linear fits and 95% CI intervals are shown.
Liver iron deposition was prominent in both sinusoidal cells and hepatocytes (Figure 1). Large iron-dense multinucleated cells were evident at higher iron loads, which represented either macrophage collections or regenerating hepatocytes. Masson’s trichrome staining demonstrated mild interstitial fibrosis that did not bridge portal triads (not shown). No necrosis was evident.
Cardiac iron deposition was predominantly interstitial (within the endomysium), generally sparing the myocytes themselves (Figure 1). Mild interstitial fibrosis was detectable in a few animals, originating from areas of high iron concentration (not shown). No myocyte necrosis was observed; however, myocyte hypertrophy was evident at high iron concentrations.
MRI Parameters and Cardiac Iron
Figure 2 illustrates the effect of cardiac iron on the MRI image in age-matched control and iron-loaded animals. Images darkened with increasing echo time through T2* decay for both animals, but they darkened more rapidly in iron-loaded heart tissue than in control animals. Greater signal loss was seen in the left ventricular endocardium than in the epicardium; this trend was fairly consistent at different iron loads. Average signal intensity in the septum and anterior wall declined exponentially with echo time (bottom), yielding a T2* of 33 ms in the unloaded animal and 7.7 ms in the iron-loaded animal.
Figure 2.
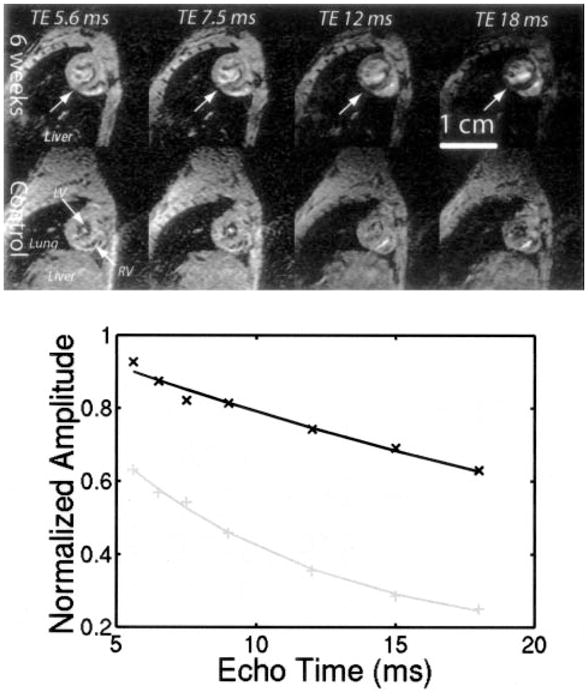
Top, Representative short-axis images at 4 different echo times illustrating T2* darkening in heart. Liver, lung, left ventricular cavity (LV), and right ventricular cavity (RV) are shown in bottom left panel. All tissues darken from left to right with a rate proportional to T2*. Top 4 panels represent iron-loaded animal, and middle 4 panels represent age-matched control. Liver signal is completely obliterated in iron-loaded animal, but heart T2* darkening can be appreciated by tracking LV myocardium from left to right (arrows, top panels). Bottom, Average signal intensity in interventricular septum as function of echo time. Data were fit to monoexponential T2* decay. Control animal had T2* of 31.5 ms, and iron-loaded animal had T2* of 7.7 ms.
Figure 3 demonstrates cardiac 1/T2* as a function of cardiac iron. There was a strong linear dependence between 1/T2* and iron (r2=0.96). All of the control animals had cardiac 1/T2* <40 Hz. Iron was detectable at 4 weeks of loading and was measurable up to cardiac iron concentrations of 1.3 mg/g wet weight (≈6.6 mg/g dry weight). Ex vivo cardiac 1/T2 measurements made with the NMR relaxometer are shown in Figure 4. 1/T2 increased linearly with cardiac iron concentration (r2=0.94). 1/T1 also increased linearly with cardiac iron, although the relationship had greater variability (r2=0.74).
Figure 3.
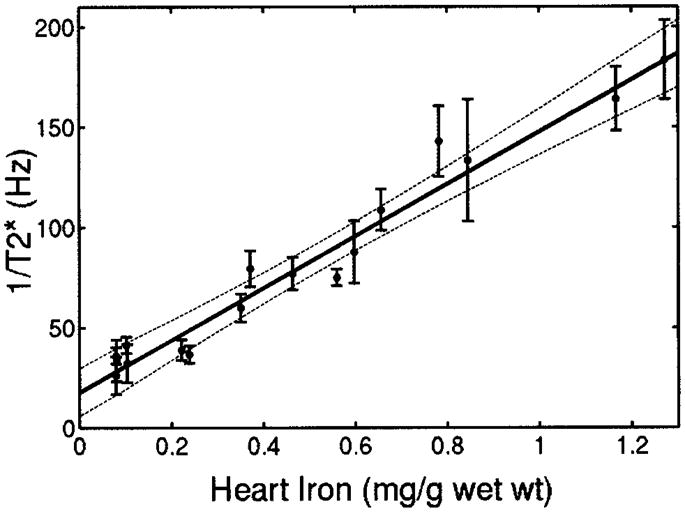
Plot of cardiac 1/T2* vs cardiac iron concentration (wet weight). Strong linear correlation is observed with coefficient of determination (r2) of 0.94. Dashed lines represent 95% CI for regression. Individual error bars represent SEs of slice-to-slice T2* variability.
Figure 4.
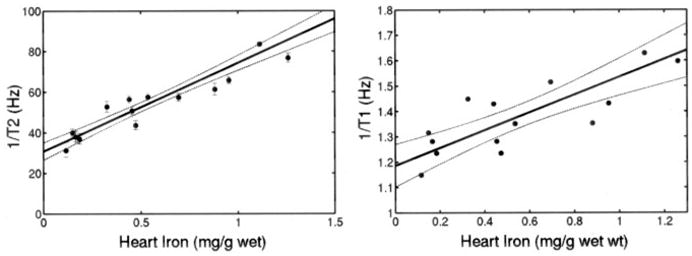
Plot of ex vivo cardiac 1/T2 and cardiac 1/T1 (measured by NMR relaxometer) vs cardiac iron concentration (wet weight). Linear fit is shown; r2 is 0.955 and 0.776, respectively. Dashed lines represent 95% CI for regression. Individual error bars represent 95% CI predicted by NMR spectrometer fitting algorithm (T1 fitting errors too small to be plotted).
MRI Parameters and Liver Iron
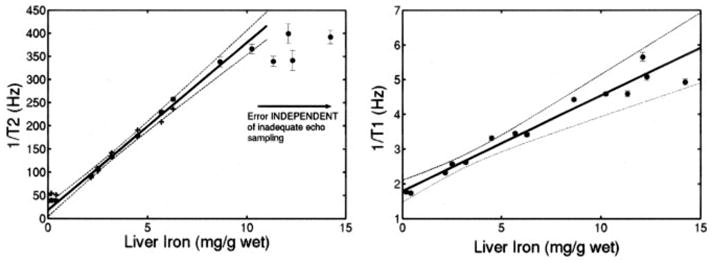
1/T2* and 1/T2 rose linearly with hepatic iron concentration for iron values up to 7 mg/g wet weight (26.4 mg/g dry weight), as shown in Figure 5. Above this iron level, hardware limitations (long echo times because of small imaging voxels) prevented accurate measurement of 1/T2* and 1/T2 (indicated by arrows); this phenomenon is explained in the Discussion.
Figure 5.
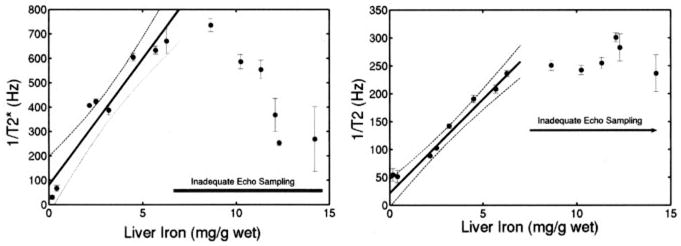
Left, MRI-measured 1/T2* as function of hepatic iron content (HIC). 1/T2* rises linearly with HIC but is also limited to HICs <7 mg/g from inadequate echo sampling. Simple regression line and its 95% CIs over valid range are shown (r2=0.904). Right, MRI-measured 1/T2 vs assayed HIC, reported in mg/g wet weight. 1/T2 rises linearly with HIC up to liver iron concentrations of 7 mg/g wet weight (27 mg/g dry weight). MRI could not accurately estimate 1/T2 values greater than this because hardware limitations prevented adequate echo sampling. Simple regression line and its 95% CIs over the valid range are shown (r2=0.959).
Liver 1/T2 was also measured, ex vivo, with the NMR relaxometer. NMR measurements have much shorter echo times, down to 2 ms in these studies, which allows characterization of the 1/T2-iron relationship to higher iron loads. Figure 6 demonstrates excellent linear fit up to a liver iron concentration of 10 mg/g wet weight (r2=0.991). Despite major differences in measurement techniques, the MRI and spectrometer T2 measurements had excellent concordance over the range that the MRI measurements were valid (≤7 mg/g). The magnetic relaxation parameter R1 (1/T1) was also proportional to iron load (r2=0.966; Figure 6).
Figure 6.
Left, 1/T2 as function of hepatic iron content (HIC), measured postmortem with NMR relaxometer. NMR 1/T2 values have been linearly scaled to account for small difference in magnetic field strength (1.42 T versus 1.5 T). Individual error bars indicate 95% CIs generated by NMR relaxometer fitting algorithm. NMR values (solid dots) demonstrate good agreement with valid MRI measurements (plus signs, redrawn from Figure 5). NMR spectrometer was not limited by echo spacing; hence, 1/T2 rises linearly for greater range of liver iron (up to 10 mg/g wet weight). Simple regression line over this interval and its 95% CI are shown (r2=0.991). 1/T2-iron relationship does flatten somewhat for HICs >10 mg/g; this phenomenon occurs despite adequate echo sampling and has been described in humans.37 Right, 1/T1 as function of HIC. Simple regression line and its 95% CIs are shown (r2=0.966).
Comparison of Cardiac and Liver Relaxivity
The strength of the influence of iron on the MRI signal, represented by the slope of the linear relationships of Figures 3 through 6, is summarized in Table 2; this value is expressed on both a wet-weight and a dry-weight basis. For all 3 parameters (1/T2*, 1/T2, and 1/T1), the slope was 21% to 27% steeper in heart than in liver when calculated on a wet-weight basis. However, when calculated on a dry-weight basis, the 1/T2*, 1/T2, and 1/T1 slopes were 5% to 10% shallower in heart than in liver, which reflects the higher water content of cardiac tissue.
TABLE 2.
Slope of MRI-Iron Calibration Curves for Heart and Liver
| MRI Parameter | Wet-Weight Calibration Slope |
Dry-Weight Calibration Slope |
||
|---|---|---|---|---|
| Heart | Liver | Heart | Liver | |
| T2* | 130.9±9.1 | 104±12.7 | 25.6±1.8 | 27.5±3.4 |
| T2 | 43.6±2.6 | 36.2±1.2 | 8.6±0.5 | 9.6±0.3 |
| T1 | 0.35±0.05 | 0.275±0.015 | 0.069±0.010 | 0.073±0.004 |
Reproducibility of Cardiac and Liver MRI Measurements
Reproducibility of the in vivo MRI measurements was assessed in 6 animals (2 animals with no loading, 2 animals with 2 weeks of iron dextran injections, and 2 animals with 8 weeks of iron dextran injections). Results are summarized in Table 3. Inter-study variability for heart and liver 1/T2* measurements were −2.6±17.6% and 8.8±12.8%, respectively. Median relative differences were 11.3% and 7.2%. Liver 1/T2 measurements were the most robust, with interstudy variability of 1.8±7.6%. Median relative difference was 4.4%. Regional variability of cardiac iron measurements was assessed by comparing assayed iron concentrations from the cardiac apex with those from the midpapillary region. Bland-Altman agreement was −4.6±12.9%, with a relative median difference of 8.6%.
TABLE 3.
Reproducibility Data for MRI and Heart Iron Measurements
| Mean Relative Difference | SD | Median Relative Difference | |
|---|---|---|---|
| Heart 1/T2* | −2.6% | 17.6% | 11.3% |
| Liver 1/T2* | 8.8% | 12.8% | 7.2% |
| Liver 1/T2 | 1.8% | 7.6% | 4.4% |
| Heart iron | −4.6% | 12.9% | 8.6% |
Discussion
Relationship Between Cardiac MRI and Cardiac Iron
The MRI relaxivities 1/T2*, 1/T2, and 1/T1 rose linearly with tissue iron concentration over most of the clinically relevant range in both the liver and the heart. The slopes of these relationships were 20% to 27% steeper in the heart than the liver on a physiological (wet weight) basis. Differences were not due to variation in water content. Although heart has a higher wet-to-dry ratio than liver (5.07 versus 3.82), the ratio is independent of iron load. Instead, the slope differences reflect intrinsic differences in iron susceptibility, proton mobility, or iron scale between the tissues. The magnetic susceptibility of iron may be tissue specific, because core magnetic properties of ferritin and hemosiderin vary slightly from organ to organ.27 It is also obvious (Figure 1) that iron distribution and proton accessibility are different in heart and liver; this may change 1/T2 and 1/T2* independently of differences in magnetic susceptibility. Despite all of these potential disparities, the overall magnetic behavior was quite similar in both tissues, comparable to in vitro results from the thalassemia mouse model.28 The cardiac 1/T2 values in the present study are consistent with recently reported values in a post-mortem gerbil model.29
Possible Confounding Influences for Cardiac MRI-Iron Dependence
Many factors beside tissue iron contribute to cardiac T2*, including blood oxygenation level dependence (BOLD) changes, motion artifacts, and long-range susceptibility effects from the lungs or iron-loaded liver, as well as changes in tissue microstructure. There is little a priori reason to suspect that changes in the BOLD signal accounted for the observed 1/T2* changes.17 Animals were asymptomatic and had a degree of iron loading that previously has not been associated with ECG abnormalities, decreased ventricular function, or exercise intolerance.21,22 Furthermore, BOLD effects are small (20% with maximal vasodilation)30 compared with the 300% to 500% changes observed in cardiac 1/T2 and 1/T2* relaxivities.
Cardiac motion and extrinsic susceptibility effects on 1/T2* from the air-tissue interfaces were more problematic in the gerbil than in the human because of the small geometry and large voxel sizes (compared with the anatomy). However, both in vivo and ex vivo cardiac measurements demonstrated similar dependence with iron, which makes it unlikely that decreased cardiac 1/T2* reflected remote effects from iron-loaded liver. Motion artifacts, although present, are unlikely to be correlated with iron load in the absence of cardiac dysfunction.
Although tissue microstructure and capillary density play a role in determining 1/T2* in the absence of iron, these effects were too small to explain the strong linear dependence with iron observed in the present study. Myocyte hypertrophy and interstitial fibrosis were minimal and were only observed at the highest iron loads. Furthermore, 1/T2-iron relationships have been shown to be relatively robust even in response to overt liver cirrhosis.31
Relationship Between Cardiac Iron and Cardiac Function: A Thought Experiment
Gerbil 1/T2*-iron calibrations cannot be applied directly to humans because the species-specific differences in iron susceptibility and distribution are too large. However, close examination of Table 2 demonstrates that liver and heart 1/T2* calibration curves are within 8% of one another when calculated on a dry-weight basis. If we make the fundamental assumption that the same property is true in humans, then human liver 1/T2*-iron dry-weight calibration could be used as a first approximation to human heart 1/T2*-iron dry-weight calibration. The equation for this relationship is as follows:
| (3) |
where T2* is the observed cardiac T2*, T20* represents cardiac T2* in the absence of iron, [Fe]dry is the estimated dry-weight cardiac iron concentration, and kdry is the proportionality constant derived from human liver. T20* is 35.7 ms in our laboratory.14 The slope, kdry, has been estimated at 37.4 Hz · mg−1 · g dry weight−1 and was derived over a range of liver iron varying from 1.4 to 32.9 mg/g dry weight.18
Given Equation 3, we can now look at the relationship between cardiac function and estimated iron content in previously published work. Figure 7 demonstrates the relationship between left ventricular ejection fraction and cardiac T2* reported by Anderson et al in 2001.12 Ejection fraction is normal in all patients with T2* >20 ms, but the probability of ventricular dysfunction increases as T2* decreases, particularly when T2* is <10 ms. The bold line represents the estimated cardiac iron concentration from Equation 3; iron values are displayed on the right axis. Estimated iron rises steeply for T2* <10 ms, corresponding visually with the increased relative risk of cardiac dysfunction at low T2*. Cardiac T2* values in the 2- to 15-ms range predict cardiac iron contents between 1 and 9.6 mg/g, closely matching assayed iron contents observed in autopsy studies of iron cardiomyopathy patients.32,33 Although only a “thought experiment,” Equation 3 predicts qualitatively and quantitatively sensible cardiac iron levels.
Figure 7.
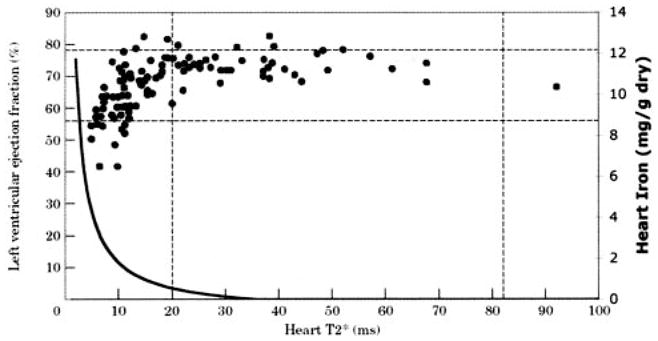
Predicted cardiac iron concentration is superimposed on previously published relationship between ejection fraction and cardiac T2* (reprinted from Anderson et al12 by permission of The European Society of Cardiology). T2* is displayed on horizontal axis, left ventricular ejection fraction on left vertical axis, and estimated cardiac iron on right vertical axis. Curve was drawn as described in Equation 3, with estimated T2*0 of 35.7 ms and slope k of 37.4 Hz · mg−1 · g dry weight−1. Estimated cardiac iron rises steeply for T2* <10 ms.
Lessons From Liver Iron Studies, Relevance to Heart Measurements
The liver imaging performed in the present study highlights important points for cardiac iron detection/estimation. In particular, we demonstrate 4 key points: (1) the importance of short minimum echo times, (2) high concordance between in vivo 1/T2 and in vitro 1/T2 measurements, (3) the intrinsic nonlinearity of 1/T2, and (4) changes in 1/T1 with iron.
Figure 5 graphically demonstrates the importance of having short minimum echo times. Both 1/T2 and 1/T2* rise linearly with iron for low iron loads, followed by an abrupt plateau. The explanation for this effect is quite simple. For any average iron level, the MRI signal contains contributions from relatively iron-rich and iron-poor areas (coefficient of variation is ≈30%18,34). If the first echo occurs quickly, the MRI signal will accurately reflect “average” iron content because both iron-rich and iron-poor tissues will contribute to the signal-decay curves. If the first echo time occurs too late, MRI signal from the relatively iron-rich areas will have decayed away completely, as though they were not even present. The “observed” signal-decay curve will therefore only reflect iron concentration of the relatively iron-poor tissues. As a rule of thumb, MRI estimation of T2 and T2* begins to break down once the minimum echo time is longer than the T2 or T2* by ≈20%, although the transition point also depends on iron distribution. That corresponds to a 1/T2* value of 631 Hz and a 1/T2 value of 263 Hz in liver (Figure 5) and to a 1/T2* of 214 Hz in heart (Figure 3). This phenomenon also can be observed in early human studies (Figure 7, minimum echo time 5.6 ms). Minimum echo times for human T2* imaging should therefore be 2 ms or less to avoid underestimating cardiac iron content.35,36
The excellent agreement between in vivo MRI 1/T2 measurements and ex vivo NMR 1/T2 measurements is quite reassuring (Figure 6). Despite the constraints and compromises that must be performed on a clinical scanner to obtain T2 estimates, the in vivo MRI appears to be measuring intrinsic tissue properties. Hardware and software differences among clinical MRI manufacturers and pulse sequences are much smaller than those between our clinical scanner and NMR relaxometer. Therefore, one would expect 1/T2-iron calibrations to be robust to the choice of MRI manufacturer.37 Initial studies of interscanner robustness for T2* measurements are encouraging but less thoroughly evaluated.36
Recent work in humans suggests that 1/T2 may actually have a curved rather than a linear relationship with liver iron concentration.37 The NMR relaxometer measurements for liver support that hypothesis (Figure 6). This curvilinearity is neither a measurement artifact (minimum echo time of 2 ms is adequate) nor does it represent any changes in weight-to-dry-weight ratio. The most likely explanation is an increase in the size of iron deposits at high iron load. T2 is less sensitive to large magnetic inhomogeneities than smaller ones.38,39 However, 1/T2 nonlinearity is probably not apparent in cardiac iron measurement because cardiac iron levels cover less than one sixth the range of liver iron concentrations (<10 mg/g dry weight). Hence, the linear rise of cardiac 1/T2 and 1/T2* appears to be a reasonable approximation (Figures 3 and 4).
Finally, we demonstrated detectable T1 changes with iron for both liver and heart tissue. T1 changes require direct interaction of water protons with iron moieties; purely “sequestered” iron species such as iron beads have minimal T1 relaxation. The effects are small relative to T2 and T2* changes but may confound attempts to use signal-intensity ratios as metrics of cardiac and liver iron content.40 Because T1 is more difficult to measure in vivo and has greater variability at low iron concentrations, it is not a good single candidate for iron estimation. However, T1 techniques could potentially be helpful at very high liver iron loads.
Study Limitations
Although these experiments demonstrate the fundamental role of iron in mediating cardiac T2 and T2* changes, there are inherent limitations in the extrapolations to humans. Although iron dextran–loaded gerbils exhibit many of the functional and electrophysiological characteristics of human iron cardiomyopathy,21–24 including comparable “lethal” cardiac iron levels, they exhibit significantly more interstitial iron deposition than in human disease, a typical finding in rodent models.41,42 Changes in iron deposition at the cellular scale will influence the relative strength of T2 and T2* changes. T2* is significantly more robust to changes in intercellular and intracellular iron distribution than T2 because the proton-iron interactions responsible for T2* relaxation are longer in range than for T2 relaxation.38,39 However, the similarity of T2 and T2* curves in the liver and heart, despite large differences in iron distribution and histology between this tissues, suggests that the influence of iron distribution is subtle.
A second limitation is the difference in imaging scale between gerbils and humans. Although T2 measurements are independent of imaging voxel size, the strength of the 1/T2*-iron relationship can increase with increasing slice thickness. Because human T2* studies typically use 7-fold–thicker slices, one might postulate larger T2* changes in humans for the same amount of iron. However, we do not claim that gerbil cardiac T2* calibration curves can be extrapolated to humans, only that human cardiac T2* measurements also likely reflect cardiac iron.
A third limitation was hardware constraints imposed by using a clinical scanner for animal imaging. Clinical gradient sets, when forced to image at submillimeter resolution, do not allow the ultra-short echo times necessary to accurately measure very high iron concentrations and accounted for the smaller “dynamic range” of iron in these gerbil studies than we can image in humans.18 Nonetheless, we were able to accurately estimate liver iron up to 26 mg/g dry weight and heart iron up to 6.8 mg/g dry weight, which represents clinically relevant iron burdens. Lethal cardiac iron levels ranged from 1.0 to 9.6 mg/g in one study32 and from 0.4 to 7.4 mg/g in another.33 Liver iron levels >15 mg/g are considered to be “cardiotoxic.”4,5
Although a dedicated animal scanner would offer better signal-to-noise ratio and faster gradients, these systems operate at higher field strength than 1.5T. Higher field strength would have 3 undesirable effects. First, it would steepen the 1/T2 and 1/T2* versus iron relationship, thereby offsetting the gains achieved by faster gradients.43 Second, the susceptibility and flow artifacts would be proportionately larger and of longer range. We suspect that these artifacts would greatly confound measurements of the in vivo cardiac 1/T2*-iron relationship at high fields. Third, it would be less representative of clinical 1/T2* imaging, because the vast majority of imaging systems worldwide are performed at 1.5 T or lower.
Summary
In summary, cardiac 1/T2* and 1/T2 rise linearly with cardiac iron in the gerbil. Iron causes similar MRI changes in gerbil heart and liver. Extrapolation of human dry-weight liver calibration curves directly to human heart produces qualitatively and quantitatively sensible heart iron estimates. Regardless of absolute calibration, these data support cardiac MRI as a technique to evaluate relative cardiac iron in humans. Further clinical studies are necessary to better define the prognostic value of cardiac MRI measurements with respect to therapeutic management and outcome.
CLINICAL PERSPECTIVE.
Cardiomyopathy from transfusional iron overload remains the leading cause of death in thalassemia. Iron chelation therapy can prevent and even reverse cardiac dysfunction if it is promptly recognized, but symptomatic heart failure carries a grave prognosis. Because iron is paramagnetic, cardiac MRI (CMR) offers the potential for noninvasive diagnosis and quantitation of preclinical cardiac iron deposition. One CMR parameter, T2*, has been correlated with left ventricular ejection fraction in thalassemia patients. However, cardiac T2* is poorly correlated with liver iron and serum ferritin levels, the 2 markers previously used to assess cardiac risk in this patient population. As a result, some investigators have challenged the validity of cardiac T2* as a marker of cardiac iron. The present study tested the ability of cardiac T2*, T2, and T1 to predict cardiac and liver iron levels in a gerbil model of iron overload. Animals were studied on the same magnetic resonance scanner (1.5T) as for human cardiac T2* studies. Postmortem analysis was also performed with a NMR relaxometer. All 3 MRI parameters were correlated with heart and liver iron concentration (r=0.86 to 0.99, mean 0.96). These findings support the potential for clinical use of CMR analysis of T2* as a surrogate for cardiac iron levels. Although T2*-iron calibration curves do not yet exist for human heart, the present study suggests that existing T2*-iron curves for human liver may be a reasonable preliminary approximation until definitive calibrations can be obtained by biopsy or autopsy studies.
Acknowledgments
This work was supported by a research grant from Novartis Pharma, AG, Basel, Switzerland, and by the National Heart, Lung, and Blood Institute (1 RO1 HL75592-01A1). The NMR relaxometer was funded by the Gunther Foundation. Comparative human MRI data were supported by the General Clinical Research Center (NIH RR00043-43) and by the Department of Pediatrics at Children’s Hospital Los Angeles.
Footnotes
Disclosure
Dr Wood receives salary and other research support from the NIH and from Novartis Pharma and has served as a consultant for and received honoraria from Novartis. Dr Nick is an employee of Novartis. Dr Coates’ salary is supported by the NHLBI, and he receives other research support from, has served on the speakers’ bureau of and/or received honoraria from, and has an ownership interest in Novartis. M. Otto-Duessel, M. Aguilar, and Dr Moats receive salary support from Novartis.
References
- 1.Greenberg PL, Gordeuk V, Issaragrisil S, Siritanaratkul N, Fucharoen S, Ribeiro RC. Major hematologic diseases in the developing world: new aspects of diagnosis and management of thalassemia, malarial anemia, and acute leukemia. Hematology (Am Soc Hematol Educ Program) 2001:479–498. doi: 10.1182/asheducation-2001.1.479. [DOI] [PubMed] [Google Scholar]
- 2.Weatherall DJ. Thalassemia in the next millennium: keynote address. Ann N Y Acad Sci. 1998;850:1–9. doi: 10.1111/j.1749-6632.1998.tb10456.x. [DOI] [PubMed] [Google Scholar]
- 3.Engle MA, Ehlers KH, O’Loughlin JE, Giardina PJ, Hilgartner MW. Beta thalassemia and heart disease: three decades of gradual progress. Trans Am Clin Climatol Assoc. 1984;96:24–33. [PMC free article] [PubMed] [Google Scholar]
- 4.Brittenham GM, Griffith PM, Nienhuis AW, McLaren CE, Young NS, Tucker EE, Allen CJ, Farrell DE, Harris JW. Efficacy of deferoxamine in preventing complications of iron overload in patients with thalassemia major. N Engl J Med. 1994;331:567–573. doi: 10.1056/NEJM199409013310902. [DOI] [PubMed] [Google Scholar]
- 5.Olivieri NF, Brittenham GM. Iron-chelating therapy and the treatment of thalassemia. Blood. 1997;89:739–761. [PubMed] [Google Scholar]
- 6.Olivieri NF, Nathan DG, MacMillan JH, Wayne AS, Liu PP, McGee A, Martin M, Koren G, Cohen AR. Survival in medically treated patients with homozygous beta-thalassemia. N Engl J Med. 1994;331:574–578. doi: 10.1056/NEJM199409013310903. [DOI] [PubMed] [Google Scholar]
- 7.Lerner N, Blei F, Bierman F, Johnson L, Piomelli S. Chelation therapy and cardiac status in older patients with thalassemia major. Am J Pediatr Hematol Oncol. 1990;12:56–60. doi: 10.1097/00043426-199021000-00010. [DOI] [PubMed] [Google Scholar]
- 8.Aldouri MA, Wonke B, Hoffbrand AV, Flynn DM, Ward SE, Agnew JE, Hilson AJ. High incidence of cardiomyopathy in beta-thalassaemia patients receiving regular transfusion and iron chelation: reversal by intensified chelation. Acta Haematol. 1990;84:113–117. doi: 10.1159/000205046. [DOI] [PubMed] [Google Scholar]
- 9.Kremastinos DT, Tsetsos GA, Tsiapras DP, Karavolias GK, Ladis VA, Kattamis CA. Heart failure in beta thalassemia: a 5-year follow-up study. Am J Med. 2001;111:349–354. doi: 10.1016/s0002-9343(01)00879-8. [DOI] [PubMed] [Google Scholar]
- 10.Ehlers KH, Levin AR, Markenson AL, Marcus JR, Klein AA, Hilgartner MW, Engle MA. Longitudinal study of cardiac function in thalassemia major. Ann N Y Acad Sci. 1980;344:397–404. doi: 10.1111/j.1749-6632.1980.tb33678.x. [DOI] [PubMed] [Google Scholar]
- 11.Jessup M, Manno CS. Diagnosis and management of iron-induced heart disease in Cooley’s anemia. Ann N Y Acad Sci. 1998;850:242–250. doi: 10.1111/j.1749-6632.1998.tb10481.x. [DOI] [PubMed] [Google Scholar]
- 12.Anderson LJ, Holden S, Davis B, Prescott E, Charrier CC, Bunce NH, Firmin DN, Wonke B, Porter J, Walker JM, Pennell DJ. Cardiovascular T2-star (T2*) magnetic resonance for the early diagnosis of myocardial iron overload. Eur Heart J. 2001;22:2171–2179. doi: 10.1053/euhj.2001.2822. [DOI] [PubMed] [Google Scholar]
- 13.Anderson LJ, Wonke B, Prescott E, Holden S, Walker JM, Pennell DJ. Comparison of effects of oral deferiprone and subcutaneous desfer-rioxamine on myocardial iron concentrations and ventricular function in beta-thalassaemia. Lancet. 2002;360:516–520. doi: 10.1016/s0140-6736(02)09740-4. [DOI] [PubMed] [Google Scholar]
- 14.Wood JC, Tyszka JM, Ghugre N, Carson S, Nelson MD, Coates TD. Myocardial iron loading in transfusion-dependent thalassemia and sickle-cell disease. Blood. 2004;103:1934–1936. doi: 10.1182/blood-2003-06-1919. [DOI] [PubMed] [Google Scholar]
- 15.Wood JC, Ghugre N, Carson S, Tyszka JM, Nelson MD, Coates TD. Predictors of abnormal myocardial function and T2* in children and young adults with thalassemia major. Blood. 2003;102:952a. Abstract. [Google Scholar]
- 16.Fischer R, Engelhardt R. Deferiprone versus desferrioxamine in thalassaemia, and T2* validation and utility. Lancet. 2003;361:182–183. doi: 10.1016/S0140-6736(03)12222-2. author reply 183–184. Letter. [DOI] [PubMed] [Google Scholar]
- 17.St Pierre TG. Deferiprone versus desferrioxamine in thalassaemia, and T2* validation and utility. Lancet. 2003;361:182. doi: 10.1016/S0140-6736(03)12222-2. author reply 183–184. Letter. [DOI] [PubMed] [Google Scholar]
- 18.Wood JC, Tyszka JM, Ghugre N, Carson S, Nelson MD, Coates TD. MRI R2 and R2* accurately estimate hepatic iron concentration in transfusion-dependent thalassemia and sickle-cell disease. Blood. 2003;102:414a. doi: 10.1182/blood-2004-10-3982. [DOI] [PMC free article] [PubMed] [Google Scholar]
- 19.Olson LJ, Edwards WD, Holmes DR, Jr, Miller FA, Jr, Nordstrom LA, Baldus WP. Endomyocardial biopsy in hemochromatosis: clinicopathologic correlates in six cases. J Am Coll Cardiol. 1989;13:116–120. doi: 10.1016/0735-1097(89)90558-5. [DOI] [PubMed] [Google Scholar]
- 20.Fitchett DH, Coltart DJ, Littler WA, Leyland MJ, Trueman T, Gozzard DI, Peters TJ. Cardiac involvement in secondary haemochromatosis: a catheter biopsy study and analysis of myocardium. Cardiovasc Res. 1980;14:719–724. doi: 10.1093/cvr/14.12.719. [DOI] [PubMed] [Google Scholar]
- 21.Yang T, Dong WQ, Kuryshev YA, Obejero-Paz C, Levy MN, Brittenham GM, Kiatchoosakun S, Kirkpatrick D, Hoit BD, Brown AM. Bimodal cardiac dysfunction in an animal model of iron overload. J Lab Clin Med. 2002;140:263–271. doi: 10.1067/mlc.2002.127725. [DOI] [PubMed] [Google Scholar]
- 22.Obejero-Paz CA, Yang T, Dong WQ, Levy MN, Brittenham GM, Kuryshev YA, Brown AM. Deferoxamine promotes survival and prevents electrocardiographic abnormalities in the gerbil model of iron-overload cardiomyopathy. J Lab Clin Med. 2003;141:121–130. doi: 10.1067/mlc.2003.18. [DOI] [PubMed] [Google Scholar]
- 23.Laurita KR, Chuck ET, Yang T, Dong WQ, Kuryshev YA, Brittenham GM, Rosenbaum DS, Brown AM. Optical mapping reveals conduction slowing and impulse block in iron-overload cardiomyopathy. J Lab Clin Med. 2003;142:83–89. doi: 10.1016/S0022-2143(03)00060-X. [DOI] [PubMed] [Google Scholar]
- 24.Kuryshev YA, Brittenham GM, Fujioka H, Kannan P, Shieh CC, Cohen SA, Brown AM. Decreased sodium and increased transient outward potassium currents in iron-loaded cardiac myocytes: implications for the arrhythmogenesis of human siderotic heart disease. Circulation. 1999;100:675–683. doi: 10.1161/01.cir.100.6.675. [DOI] [PubMed] [Google Scholar]
- 25.Zuyderhoudt FM, Sindram JW, Marx JJ, Jorning GG, van Gool J. The amount of ferritin and hemosiderin in the livers of patients with iron-loading diseases. Hepatology. 1983;3:232–235. doi: 10.1002/hep.1840030216. [DOI] [PubMed] [Google Scholar]
- 26.Riffenburgh R. Statistics in Medicine. London, UK: Academic Press; 1999. [Google Scholar]
- 27.St Pierre TG, Tran KC, Webb J, Macey DJ, Heywood BR, Sparks NH, Wade VJ, Mann S, Pootrakul P. Organ-specific crystalline structures of ferritin cores in beta-thalassemia/hemoglobin E. Biol Met. 1991;4:162–165. doi: 10.1007/BF01141308. [DOI] [PubMed] [Google Scholar]
- 28.Liu P, Henkelman M, Joshi J, Hardy P, Butany J, Iwanochko M, Clauberg M, Dhar M, Mai D, Waien S, Olivieri N. Quantification of cardiac and tissue iron by nuclear magnetic resonance relaxometry in a novel murine thalassemia-cardiac iron overload model. Can J Cardiol. 1996;12:155–164. [PubMed] [Google Scholar]
- 29.Wang ZJ, Lian L, Chen Q, Zhao H, Asakura T, Cohen AR. 1/T2 and magnetic susceptibility measurements in a gerbil cardiac iron overload model. Radiology. 2005;234:749–755. doi: 10.1148/radiol.2343031084. [DOI] [PubMed] [Google Scholar]
- 30.Wacker CM, Bock M, Hartlep AW, Beck G, van Kaick G, Ertl G, Bauer WR, Schad LR. Changes in myocardial oxygenation and perfusion under pharmacological stress with dipyridamole: assessment using T*2 and T1 measurements. Magn Reson Med. 1999;41:686–695. doi: 10.1002/(sici)1522-2594(199904)41:4<686::aid-mrm6>3.0.co;2-9. [DOI] [PubMed] [Google Scholar]
- 31.Clark PR, Chua-Anusorn W, St Pierre TG. Proton transverse relaxation rate (R2) images of iron-loaded liver tissue: mapping local tissue iron concentrations with MRI [published erratum appears in Magn Reson Med. 2003;49:1201] Magn Reson Med. 2003;49:572–575. doi: 10.1002/mrm.10378. [DOI] [PubMed] [Google Scholar]
- 32.Buja LM, Roberts WC. Iron in the heart: etiology and clinical significance. Am J Med. 1971;51:209–221. doi: 10.1016/0002-9343(71)90240-3. [DOI] [PubMed] [Google Scholar]
- 33.Olson LJ, Edwards WD, McCall JT, Ilstrup DM, Gersh BJ. Cardiac iron deposition in idiopathic hemochromatosis: histologic and analytic assessment of 14 hearts from autopsy. J Am Coll Cardiol. 1987;10:1239–1243. doi: 10.1016/s0735-1097(87)80124-9. [DOI] [PubMed] [Google Scholar]
- 34.St Pierre TG, Clark PR, Chua-Anusorn W. Single spin-echo proton transverse relaxometry of iron-loaded liver. NMR Biomed. 2004;17:446–458. doi: 10.1002/nbm.905. [DOI] [PubMed] [Google Scholar]
- 35.Westwood M, Anderson LJ, Firmin DN, Gatehouse PD, Charrier CC, Wonke B, Pennell DJ. A single breath-hold multiecho T2* cardiovascular magnetic resonance technique for diagnosis of myocardial iron overload. J Magn Reson Imaging. 2003;18:33–39. doi: 10.1002/jmri.10332. [DOI] [PubMed] [Google Scholar]
- 36.Westwood MA, Anderson LJ, Firmin DN, Gatehouse PD, Lorenz CH, Wonke B, Pennell DJ. Interscanner reproducibility of cardiovascular magnetic resonance T2* measurements of tissue iron in thalassemia. J Magn Reson Imaging. 2003;18:616–620. doi: 10.1002/jmri.10396. [DOI] [PubMed] [Google Scholar]
- 37.St Pierre TG, Clark PR, Chuaanusorn W, Fleming AJ, Jeffrey GP, Olynyk JK, Pootrakul P, Robins E, Lindeman R. Noninvasive measurement and imaging of liver iron concentrations using proton magnetic resonance. Blood. 2005;105:855–861. doi: 10.1182/blood-2004-01-0177. [DOI] [PubMed] [Google Scholar]
- 38.Tanimoto A, Oshio K, Suematsu M, Pouliquen D, Stark DD. Relaxation effects of clustered particles. J Magn Reson Imaging. 2001;14:72–77. doi: 10.1002/jmri.1153. [DOI] [PubMed] [Google Scholar]
- 39.Weisskoff RM, Zuo CS, Boxerman JL, Rosen BR. Microscopic susceptibility variation and transverse relaxation: theory and experiment. Magn Reson Med. 1994;31:601–610. doi: 10.1002/mrm.1910310605. [DOI] [PubMed] [Google Scholar]
- 40.Jensen PD, Jensen FT, Christensen T, Eiskjaer H, Baandrup U, Nielsen JL. Evaluation of myocardial iron by magnetic resonance imaging during iron chelation therapy with desferrioxamine: indication of close relation between myocardial iron content and chelatable iron pool. Blood. 2003;101:4632–4639. doi: 10.1182/blood-2002-09-2754. [DOI] [PubMed] [Google Scholar]
- 41.Tipnis UR, He GY, Khan MF. Differential induction of polyamine oxidase activity in liver and heart of iron-overloaded rats. J Toxicol Environ Health. 1997;51:235–244. doi: 10.1080/00984109708984024. [DOI] [PubMed] [Google Scholar]
- 42.Schwartz KA, Fisher J, Adams ET. Morphologic investigations of the guinea pig model of iron overload. Toxicol Pathol. 1993;21:311–320. doi: 10.1177/019262339302100307. [DOI] [PubMed] [Google Scholar]
- 43.Bulte JW, Brooks RA, Moskowitz BM, Bryant LH, Jr, Frank JA. Relaxometry and magnetometry of the MR contrast agent MION-46L. Magn Reson Med. 1999;42:379–384. doi: 10.1002/(sici)1522-2594(199908)42:2<379::aid-mrm20>3.0.co;2-l. [DOI] [PubMed] [Google Scholar]