
Figure 7.
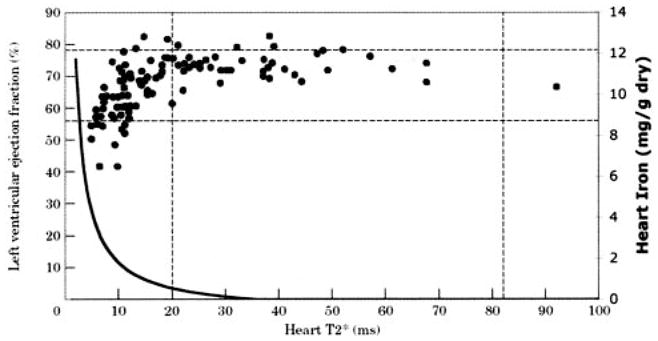
Predicted cardiac iron concentration is superimposed on previously published relationship between ejection fraction and cardiac T2* (reprinted from Anderson et al12 by permission of The European Society of Cardiology). T2* is displayed on horizontal axis, left ventricular ejection fraction on left vertical axis, and estimated cardiac iron on right vertical axis. Curve was drawn as described in Equation 3, with estimated T2*0 of 35.7 ms and slope k of 37.4 Hz · mg−1 · g dry weight−1. Estimated cardiac iron rises steeply for T2* <10 ms.