Abstract
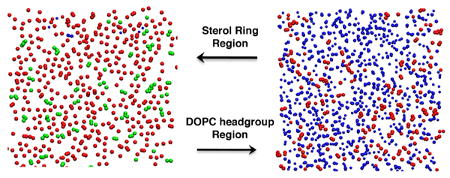
The condensing effect of cholesterol in dioleoylphosphatidylcholine (DOPC) lipid bilayers was systematically investigated via atomistic molecular dynamics (MD) simulation. Fourteen independent 200 ns simulations, spanning the entire range of cholesterol mole fraction (xc) in DOPC bilayers (i.e. from xc = 0 to 0.66), were performed at 323 K. The molecular areas occupied by DOPC and cholesterol at different distances from the bilayer center were analyzed using a slicing method based on the VDW radii of atoms. Curiously, while the average area per lipid and the cholesterol tilt angle, in respect to the bilayer normal, both show monotonic decreases as xc increases, the average bilayer height shows a significant decrease for xc > 0.35, following an initial increase. The calculated partial-specific areas of lipids clearly show the condensing effect of cholesterol. The VDW areal analysis showed that the condensing effect is limited only to the cholesterol sterol ring region, where the acyl chains of DOPC are severely compressed by cholesterol. As xc increases, the headgroups of DOPC gradually expand along the bilayer-aqueous interface to occupy more lateral area. Thus, it confirmed a key prediction of the Umbrella model. At high cholesterol mole fractions, the calculated area per DOPC and area per cholesterol using some existing methods showed an inconsistent result: Both increase, while the overall area per lipid decreases. The inconsistency stems from the problematic assumption that cholesterol and DOPC have cylindrical shape and the same height. Our results showed that the total area of a PC/cholesterol bilayer is primarily determined by the molecular packing in the cholesterol sterol ring region. An alternative analysis of area per molecule within this region is proposed, which takes into account the cholesterol tilt angle and the practical incompressibility of cholesterol sterol rings. The new calculation shows that the majority of the area lost due to the cholesterol condensing effect is taken from PC molecules.
Keywords: the Umbrella Model, cholesterol-lipid interaction, headgroup orientation, area per lipid, cholesterol maximum solubility, molecular dynamics simulation
Introduction
The lipid bilayer is the fundamental structural scaffold of the cell plasma membrane. Phospholipids and cholesterol are the most abundant lipid constituents within these membranes, and the molecular interactions between the two molecules can greatly affect the biochemical and biophysical properties of a lipid bilayer. In the past decade, molecular dynamics (MD) simulation has been widely utilized in the study of cholesterol-containing lipid bilayers at the atomistic scale.1-9 One of the most important effects of cholesterol on lipid membranes is the cholesterol condensing effect: The surface area of a cholesterol-containing lipid bilayer is less than the sum of areas of the individual bilayer components.10-12 The cholesterol condensing effect can be quantitatively described in terms of the average area per molecule, which reflects the molecular organization within a lipid bilayer. A seemingly straight forward question that interests many researchers is “what is the average area occupied by a phospholipid or by a cholesterol in a lipid bilayer?” For a pure PC bilayer simulation, the answer can be easily obtained by dividing the total area of the bilayer in the simulation box by the total number of PC molecules; however, there is no simple answer for a PC bilayer containing cholesterol. A number of methods have been developed for the purpose of calculating the area per PC and area per cholesterol from an MD simulation.13-16 These methods have been applied to various phospholipid bilayers and to different cholesterol mole fractions, as well as at different system temperatures. One of these approaches was proposed by Hofsäß et al.15, in which the volume of cholesterol was considered to be constant. Additionally, phospholipids and cholesterol were assumed to have the same height in a lipid bilayer. Edholm and Nagle improved the volumetric component of the analysis, but kept the same height assumption.13 Another method applied Voronoi analysis in two dimensions to find average areas per PC and per cholesterol as a function of xc;16 however, it has been suggested that this method may intrinsically overestimate the area occupied by smaller molecules and underestimate the area occupied by larger molecules.17 Finally, Falck et al. divided a lipid bilayer into horizontal slices and analyzed the molecular area within each slice. They showed that there is indeed a z-dependence of the molecular areas when examined at an atomic level.14
Edholm and Nagle recognized the existence of arbitrary features in the above methods, and introduced the formalism of partial-specific-area.13 Partial-specific area is defined as the increase of total bilayer area by adding one more lipid molecule at a particular bilayer composition. This method has been applied to DPPC/cholesterol, DOPC/cholesterol, and POPC/cholesterol bilayers.5,13 For example, in a DPPC bilayer containing 10 mol % of cholesterol, the calculated partial-specific area of cholesterol was about -0.19 nm2. The negative value results from the well-known cholesterol condensing effect. Therefore, a systematic analysis of bilayer area can shed light on the molecular origin of the cholesterol condensing effect.
In this study, the cholesterol condensing effect in DOPC bilayers was systematically investigated using atomistic MD simulation. Fourteen independent 200 ns simulations, spanning the entire possible range of cholesterol mole fraction in DOPC bilayers, were performed at 323 K. The molecular areas occupied by DOPC and cholesterol at different distances from the bilayer center were analyzed using a slicing method based on the VDW radii of atoms. The analysis revealed that as xc increases, the areas occupied by PC and cholesterol both decrease in the cholesterol sterol ring region; however, PC headgroups actually occupy more lateral area at the bilayer-aqueous interface. Thus, it confirmed an important prediction of the Umbrella model.18 The reduction of area per cholesterol in the cholesterol sterol ring region is primarily due to the decrease of cholesterol tilt angle in respect to the bilayer normal, while the reduction of area per PC in the same region is due to the compression of acyl chains by the cholesterol sterol rings. The area per molecule was calculated using the method of Hofsäß et al. as well as the method of Edholm and Nagle over the entire range of cholesterol mole fraction. Interestingly, in the high cholesterol region, which has been rarely studied by MD simulation, the calculated area per cholesterol as well as the area per PC both increases, while the average area per lipid decreases. This inconsistency stems from the built-in assumption by both methods, that PC and cholesterol were of cylindrical shape and of the same height. Our analysis shows that total area of a PC/cholesterol bilayer is primarily determined by the packing of cholesterol and PC in the cholesterol sterol ring region. We propose an alternative method for calculating area per PC and area per cholesterol in this region that gives a more informative description of the cholesterol condensing effect at the molecular level.
Simulation Methods
Fourteen independent 200 ns simulations were performed at 323 K, with a time step of 2.0 fs. In the simulations of DOPC bilayers containing 0, 1.95, 5.08, 10.16, 14.84, 20.31, 25, 30.08, 35.16, 39.84, 44.92 and 50 mol % of cholesterol, the total number of lipids (i.e., DOPC + cholesterol) was kept at 512. For the systems containing 57% and 65.63% of cholesterol, the total numbers of lipids were 200 and 128, respectively. All systems contained 28.625 water molecules for each lipid. The phospholipid force field was from Berger et al.19 and the force field for cholesterol was based on the GROMOS force field from Holtje et al.20 The simple point charge (SPC) model was used for water molecules. The force field parameter files for phospholipids were obtained from Dr. Peter Tieleman's website and the file for cholesterol was obtained from the GROMACS website. The MD simulations were performed using GROMACS 4.0.521 and the analysis was done using the GROMACS tools as well as our own programs. The LINCS algorithm was used to keep the lengths of all bonds constant. The cut-off distance for Lennard-Jones interactions and electrostatic interactions were both set at 1.0 nm. Long-range electrostatic interactions were handled with the particle mesh Ewald (PME) method.22 All systems were run for 200 ns in the NPT ensemble using Berendsen thermostat and barostat with a coupling time constant of 0.1 ps and 1.0 ps, respectively. The pressure normal and parallel to the bilayer were coupled separately at 1 bar.
The pure DOPC bilayer was constructed by first obtaining the PDB coordinates file of a single DOPC molecule from the Dundee PRODRG2 Server.23 A single DOPC was placed inside a solvent box and a simulation was performed to relax the lipid. Afterwards, bilayers of 128 and 200 DOPCs were constructed from this relaxed DOPC. Initial equilibration simulations of the two systems consisting of fully solvated 128 and 200 DOPC lipids were performed for 200 nanoseconds. Following this, the GROMACS21 utility “genconf” was employed to replicate the system of 128 DOPC and thus generate a new starting configuration consisting of 512 DOPC lipids. To insert cholesterol molecules into the bilayers, a number of DOPCs in each leaflet were randomly selected and replaced with cholesterol. During the replacement, the COM of cholesterol coincided with the COM of the replaced DOPC and the cholesterol was rotated by a random angle in respect to its principal axis. The VMD program was then used to remove any bad links or overlaps that could happen after cholesterol insertion. In constructing the systems with 57% and 65.63% cholesterol from pure DOPC bilayers, DOPCs were replaced by cholesterol molecules gradually: after replacing about 20 DOPC molecules in each leaflet, the systems were equilibrated for 50 ns before the next replacement. All initial structures went through energy minimization using both the steepest descent and the conjugate gradient algorithms; each ran for 10,000 steps to eliminate any bad contacts between atoms.
Area Per Molecule Calculation
Method 1
The first method was proposed by HofsaB et al.15 In this method, the volume of cholesterol was considered to be a constant, independent of cholesterol concentration. The volume per PC was calculated by subtracting the volumes of water and cholesterol from the total volume of the simulation box:
| (1) |
Where Nlipid is the total number of lipids in the simulation box, NW is the number of water molecules, and V(xc) is the volume of the simulation box. vW is the volume of a water molecule; this value (0.031546 nm3) was obtained from a separated simulation of pure water at 323 K under the same conditions. The average thickness of the lipid bilayer h(xc) was calculated using the equation:15
| (2) |
The area occupied by a PC and by a cholesterol molecule in the bilayer can be written in terms of the volume and thickness as:
| (3) |
An important assumption, which is built into Eq. 3, is that PC and cholesterol molecules are assumed to have the same height.
Method 2
Edholm and Nagle improved the volumetric part of the analysis of Method 1:13 vDOPC(xc) and vCHOL(xc) are obtained by fitting volume per lipid vs. xc using the linear equation
| (4) |
Assuming a constant volumetric ratio of cholesterol to PC f(xc) = vCHOL(xc)/vDOPC(xc), Edholm and Nagle calculated area per PC and area per cholesterol using:
| (5) |
where a(xc) is the area per lipid. Note that Eq. 5 also contains the built-in assumption that PC and cholesterol have the same height.
Partial-specific areas
Edholm and Nagle proposed the formulism of partial-specific molecular area for PC and cholesterol.13 The partial-specific areas ai for a bilayer consisting of i = 1, …, m types of molecules is defined as:
| (6) |
where A is the total area, Ni is the number of i type lipid per leaflet, X indicates a set of m lipid mole fractions (x1,… xm), and the partial derivative is taken with Nj constant for all j ≠ i. A convenient graphical way to obtain the partial-specific areas is first plotting a(xc)/(1-xc) vs xc/(1-xc) using
| (7) |
then aCHOL(x) can be estimated directly from the slope of the tangent and aDOPC(x) can be estimated from the intercept of the tangent at xc = 0.
Results and Discussion
The chemical structures of cholesterol and DOPC are shown in Fig. 1. The orientation of a cholesterol molecule is characterized by a vector connecting C21 and C5 atoms of the cholesterol.
Figure 1.
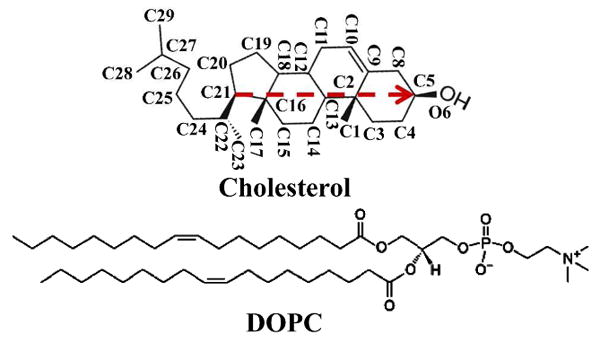
Chemical structures of cholesterol and DOPC. The vector connecting C21 and C5 atoms of cholesterol (red arrow) is used to represent the orientation of a cholesterol molecule, and the angle between this vector and the bilayer normal is defined as the cholesterol tilt angle.
Area per lipid
Area per lipid, apl, is an essential parameter for describing the state of molecular packing within a lipid bilayer. In an MD simulation, it is calculated by dividing the total area of the simulation box in x-y plane by the total number of lipid molecules in one leaflet of the bilayer. Table 1 lists the average area per lipid for fourteen simulations that covered the entire possible range of cholesterol mole fraction in DOPC bilayers. The maximum solubility of cholesterol in DOPC bilayers determined by light scattering, fluorescence anisotropy, and cholesterol oxidase activity assay was 0.66.24,25 Some lower values have also been reported, but these likely resulted from problematic sample preparation.26,27 In most simulations, the area per lipid reached a stable value quickly (data not shown); however, in certain simulations with high cholesterol content, a stable value was not reached until about 150 ns because replacing PCs with a large number of cholesterol significantly perturbed the system. Slow diffusion of molecules at high cholesterol content also slowed the re-establishment of equilibrium.15 Therefore, the average values of area per lipid (Table 1 and Fig. 3) were calculated using only the last 50 ns of the 200 ns simulations.
Table 1.
The area per lipid (apl(xc)), bilayer height (h(xc)), average tilt angle of cholesterol (θavg), area per DOPC (aDOPC) and per cholesterol (aCHOL) calculated using method 1 and 2, and in the “areal-determining plane” (ADP).
|
xc mol % |
apl(xc) (Å2) |
h(xc) (Å) |
θavg (degree) |
Method 1 | Method 2 | In ADP | |||
|---|---|---|---|---|---|---|---|---|---|
|
aDOPC (Å2) |
aCHOL (Å2) |
aDOPC (Å2) |
aCHOL (Å2) |
aDOPC (Å2) |
aCHOL (Å2) |
||||
| 0 | 67.1±0.5 | 39.4±0.3 | 67.1±0.6 | 67.1±0.6 | 67.1±0.5 | ||||
| 1.95 | 65.7±0.5 | 39.8±0.3 | 29.7±4.7 | 66.4±0.5 | 29.8±0.2 | 66.5±0.5 | 27.3±0.2 | 66.2±2.1 | 43.7±2.1 |
| 5.08 | 63.3±0.4 | 40.5±0.3 | 28.7±2.7 | 65.1±0.5 | 29.3±0.2 | 65.3±0.5 | 26.8±0.2 | 64.4±1.2 | 43.3±1.1 |
| 10.16 | 59.6±0.6 | 41.6±0.4 | 27.3±2.0 | 63.1±0.7 | 28.5±0.3 | 63.3±0.7 | 26.0±0.3 | 61.5±1.0 | 42.7±0.7 |
| 14.84 | 55.8±0.4 | 43.1±0.3 | 25.6±1.6 | 60.7±0.5 | 27.5±0.2 | 61.1±0.5 | 25.1±0.2 | 58.1±0.7 | 42.1±0.6 |
| 20.31 | 52.2±0.8 | 44.3±0.7 | 23.5±1.2 | 58.7±1.0 | 26.8±0.4 | 59.3±1.0 | 24.4±0.4 | 54.9±0.9 | 41.4±0.4 |
| 25 | 48.8±0.3 | 45.8±0.3 | 21.1±1.1 | 56.4±0.4 | 25.9±0.2 | 57.2±0.4 | 23.5±0.2 | 51.5±0.4 | 40.7±0.3 |
| 30.08 | 46.6±0.2 | 46.2±0.2 | 18.9±0.8 | 55.6±0.3 | 25.7±0.1 | 56.6±0.3 | 23.3±0.1 | 49.4±0.3 | 40.2±0.2 |
| 35.16 | 44.3±0.2 | 46.7±0.3 | 16.6±0.8 | 54.6±0.3 | 25.4±0.1 | 55.9±0.3 | 23.0±0.2 | 46.9±0.3 | 39.6±0.2 |
| 39.84 | 43.2±0.2 | 46.4±0.2 | 14.8±0.8 | 54.8±0.3 | 25.6±0.1 | 56.4±0.3 | 23.2±0.1 | 45.7±0.2 | 39.3±0.1 |
| 44.92 | 41.6±0.1 | 46.4±0.2 | 13.7±1.0 | 54.6±0.3 | 25.6±0.1 | 56.5±0.3 | 23.2±0.1 | 43.6±0.2 | 39.1±0.2 |
| 50 | 40.6±0.1 | 45.7±0.2 | 12.4±0.5 | 55.2±0.3 | 26.0±0.1 | 57.5±0.3 | 23.7±0.1 | 42.3±0.2 | 38.9±0.1 |
| 57 | 39.5±0.2 | 44.6±0.3 | 11.5±0.7 | 56.5±0.5 | 26.6±0.2 | 59.4±0.4 | 24.4±0.2 | 40.4±0.2 | 38.8±0.1 |
| 65.63 | 38.7±0.2 | 42.5±0.4 | 10.7±0.7 | 59.4±0.7 | 27.9±0.3 | 63.1±0.5 | 26.0±0.3 | 38.8±0.2 | 38.7±0.1 |
Figure 3.
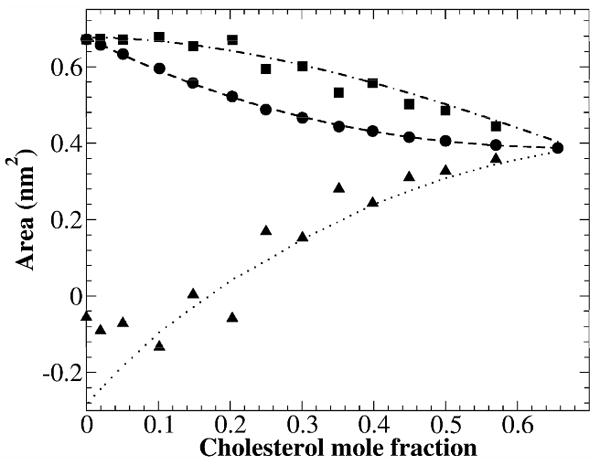
Area per lipid and partial-specific areas of DOPC and cholesterol vs. cholesterol mole fraction. Circles: Average area per lipid; Square: DOPC partial-specific area; Triangles: Cholesterol partial-specific area.
Volume per lipid and bilayer thickness
Figure 2 shows volume per lipid vpl(xc) and the bilayer thickness h(xc) as functions of cholesterol mole fraction. Volume per lipid was calculated by subtracting the volume of water from the volume of the simulation box and then dividing it by the total number of lipids. The relation between vpl(xc) and xc is almost linear, which is consistent with the measured volumes of DOPC/cholesterol bilayers.28 The bilayer thickness was calculated using Eq. 2. An important feature of Fig. 2 is that the bilayer thickness initially increases as xc increases, but reaches a maximum around xc = 0.35, and then shows a gradual decrease at higher xc values. From xc of 0.4 to 0.66, the total decrease of bilayer thickness is about 0.4 nm (or 0.2 nm per leaflet). As to be discussed later, the decrease of bilayer thickness at high cholesterol mole fraction is due to the movement of DOPC headgroups toward the bilayer-aqueous interface in order to cover more cholesterol.
Figure 2.
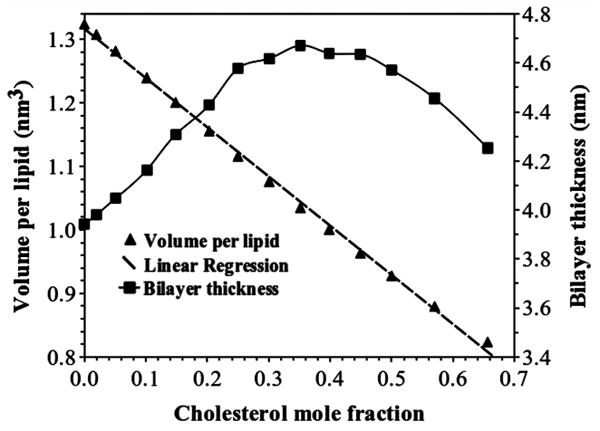
Volume per lipid vpl(xc) and bilayer thickness h(xc) versus cholesterol mole fraction in DOPC bilayers. The linear fit to the volume per lipid data is: vpl(xc) =1.316-0.775xc.
Partial-specific areas
Figure 3 shows the area per lipid and partial-specific area of the DOPC and cholesterol. Since the cross-sectional area of cholesterol is less than that of a DOPC, as expected, area per lipid shows a monotonic decrease as a function of cholesterol mole fraction. Intriguingly, partial-specific area of cholesterol, aCHOL(x), is negative for xc < 0.2. By definition, aCHOL(x) is the change of total bilayer area at the bilayer composition xc by adding one more cholesterol molecule to the bilayer, while keeping all other parameters constant. Therefore, at low cholesterol concentrations, adding cholesterol to DOPC bilayers actually causes a net reduction of total bilayer area. The negative partial-specific area of cholesterol was first reported in DPPC(di16:0PC)/cholesterol systems by Edholm and Nagle, who interpreted it as a manifestation of the condensation effect of cholesterol on the surrounding lipids.13 We believe this to be the correct interpretation. Experimentally, a negative partial-specific area of cholesterol has been observed in DPPC/cholesterol monolayers at the air-water interface.29 Although there are some important differences between a lipid monolayer and a lipid bilayer, interestingly, the changing manner of the partial-specific areas of both the cholesterol and phospholipid in lipid monolayers is quite similar to that calculated for DOPC lipid bilayers.
Cholesterol tilt angle
Figure 4 shows the distributions of cholesterol tilt angle at some selected cholesterol mole fractions. The tilt angle is defined as the angle between the vector connecting C21 and C5 atoms of cholesterol (see Fig. 1) and the bilayer normal. As shown in Fig. 4A, the distributions of cholesterol tilt angle are quite broad at low cholesterol concentrations. As xc increases, the distributions become sharper and the peaks also shift towards a smaller angle. Fig. 4B shows the average cholesterol tilt angle as a function of xc. The average cholesterol tilt angle monotonically decreases from 29.7° at xc of 0.0195 to 10.7° at xc of 0.6563. Thus, cholesterol becomes more orientationally ordered and more parallel to the bilayer normal at higher cholesterol mole fractions.
Figure 4.
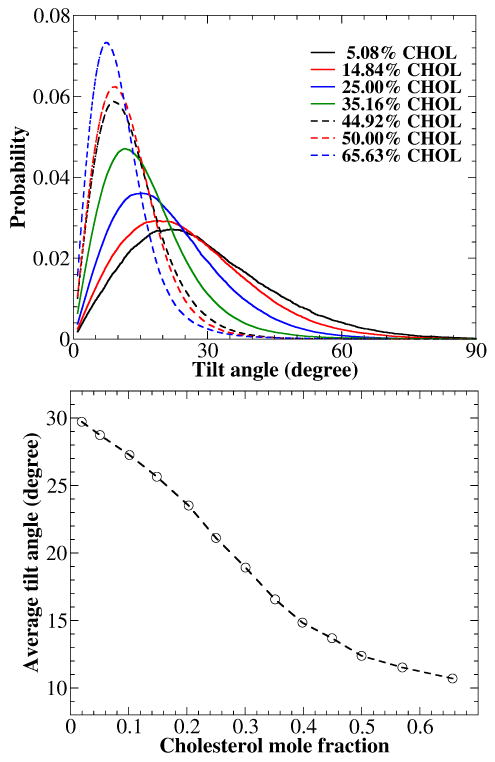
(A) Tilt angle distributions between the bilayer normal and the vector connecting C21 and C5 atoms of cholesterol in DOPC bilayers at some selected cholesterol concentrations. (B) Average cholesterol tilt angle versus cholesterol mole fraction.
Acyl chain order parameter
The order parameter of DOPC acyl chains was calculated using the last 50 ns of the simulation and was averaged from the two leaflets. Figure 5 shows the order parameter of the two chains at each carbon atom position. In general, as observed in some other MD simulation studies,5,14 the higher the cholesterol mole fraction, the higher the chain order parameter. Also, the cis double bond at C9 position produces a very sharp drop of chain order parameter. A new result in Fig. 5 is that the chain order parameter at xc= 0.6563 become slightly lower than that at xc = 0.50 at some positions. To verify this result, we ran the simulation at xc = 0.6563 for another 100 ns (i.e., 300 ns total). The result remained the same. xc of 0.6563 is practically at the maximum solubility of cholesterol in DOPC bilayer (0.66). Above this mole fraction, excess cholesterol precipitates from the bilayer to form cholesterol monohydrate crystals.26 According to the Umbrella Model, the ability of DOPC to cover nonpolar bodies of cholesterol has been stretched to the limit at the solubility limit, and each DOPC needs to cover two cholesterol molecules on average.18 The bilayer is forced to adapt a few lateral distributions of lipids that can still satisfy the coverage requirement. Thus, the acyl chains of DOPC become slightly more disordered at the maximum solubility of cholesterol.
Figure 5.
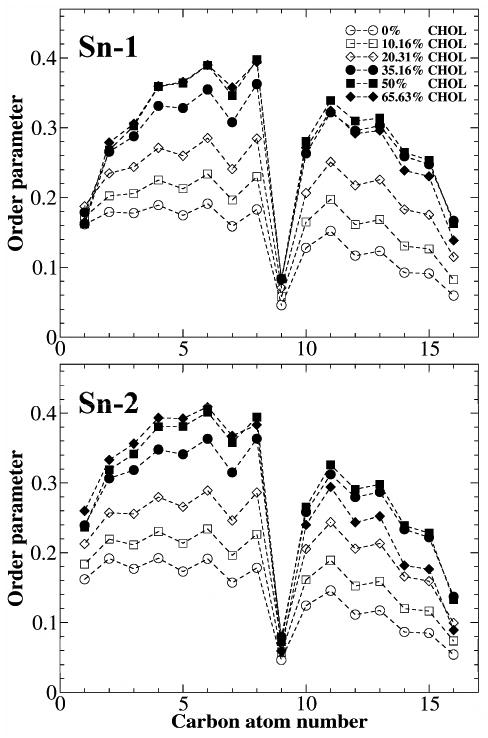
Acyl chain order parameter versus the carbon atom number in DOPC bilayers at some selected cholesterol concentrations.
Slicing Bilayers
In order to understand the cholesterol condensing effect at atomic scale, we used the slicing method of Falck et al.14 with a modification. Instead of making a grid and counting the numbers of grids occupied by PC, cholesterol, water and void, we count the VDW areas that belong to these molecules. We first “sliced” the bilayer in z direction at 0.1 nm intervals. z is the distance from the bilayer center in the direction of bilayer normal. Within each slice, we counted the numbers of atoms that belong to PC, cholesterol or water. The area associated with each atom was calculated using the Van der Waals radius.30 The total VDW area occupied by DOPC, cholesterol or water in each slice was obtained by summing together all corresponding VDW areas. The remaining areas that were not occupied by DOPC, cholesterol, or water, were counted as free areas. Overall, our results were similar to those obtained by Falck et al. for DPPC/cholesterol bilayers using their grid counting method. Figure 6 shows the calculated area profiles as functions of z for a DOPC bilayer containing 20.31 mol % of cholesterol. Figure 7 shows a few selected areal slice snapshots for a DOPC bilayer containing 20.31 mol % of cholesterol at the end of a 200 ns simulation. At the bilayer center (Fig. 7A), the free area is quite large and almost no water is present. Some cholesterol tails from one leaflet extend into the opposite leaflet. Fig. 7B shows the region where DOPC acyl chains and cholesterol sterol rings are tightly packed. The amount of free area is lowest in this region. Figure 7C is a cross-sectional slice of the bilayer at a distance z ∼ 1.8 nm from the bilayer center. Many cholesterol hydroxyl headgroups are present in this slice but they occupy a small fraction of total area. The amount of free area in this slice is smaller than the free area in the bilayer center. Fig. 7D shows a cross-sectional slice at z ∼ 2.3 nm. In this slice, there are substantial amounts of water and some DOPC headgroups, but no cholesterol.
Figure 6.
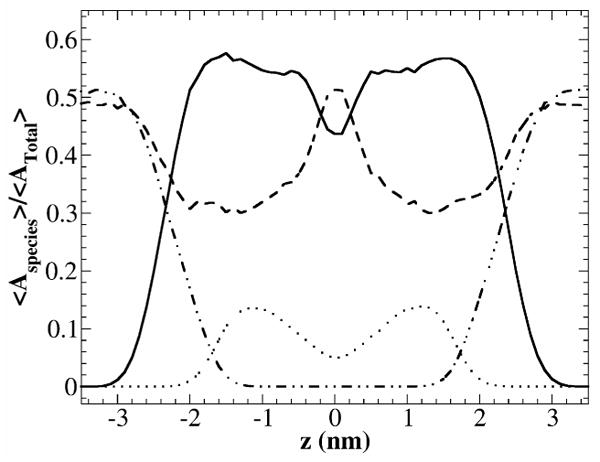
The VDW areal fractions as functions of z for a DOPC bilayer containing 20.31 mol % of cholesterol. z is the distance from the bilayer center in the direction of bilayer normal. The areal fractions are normalized by total bilayer area. DOPC VDW areal fraction <ADOPC(z)>/<Atotal> (solid line); cholesterol VDW areal fraction <ACHOL(z)>/<Atotal> (dotted line); water areal fraction <Awater(z)>/<Atotal> (dot-dot-dash line); and free area fraction <Afree(z)>/<Atotal> (dashed line).
Figure 7.
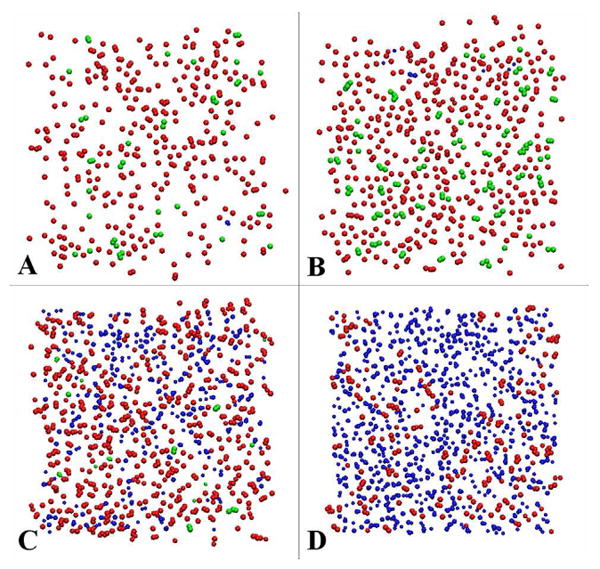
Snapshots of cross-sectional slices of a DOPC bilayer with 20.31 mol % of cholesterol at 200 ns. DOPC elements are colored in red; cholesterol in green, and water in blue. The remaining area is the free area. (A) z ≈ 0, i.e., at bilayer center; (B) z ≈ 1.2 nm, where many cholesterol sterol rings resided; (C) z ≈ 1.8 nm, where many cholesterol headgroups resided; (D) z ≈ 2.3 nm, where many DOPC headgroups resided.
Figure 8 show the VDW area occupied by DOPC, VDW area of cholesterol, and free space as functions of location z at various cholesterol concentrations. Together, Figures 6-8 provide some important details about the packing of cholesterol in DOPC bilayers and the cholesterol condensing effect. The structure of a cholesterol-containing PC bilayer can be roughly divided into 3 regions: the bilayer center region, cholesterol sterol rings region, and PC headgroup region. (i) In the bilayer center region, as shown in Fig. 8B, the density of cholesterol is low, since cholesterol has only a short acyl chain. The free space is largest at the bilayer center, as shown in Fig. 8C. Thus, the molecular packing is quite loose at the bilayer center, and molecular interactions in this region do not determine the total area of the bilayer. (ii) In the cholesterol sterol ring region, the density of cholesterol is at its peak due to its dense sterol rings. As cholesterol mole fraction increases, the density of cholesterol (normalized to per cholesterol) shows little change (Fig. 8B), indicating the sterol rings are rigid and not compressible. The largest change for cholesterol is its tilt angle with respect to the bilayer normal (Fig. 4). As cholesterol mole fraction increases, the average tilt angle decreases and the tilt angle distribution becomes narrower, which indicate that cholesterol is more ordered and becomes more parallel to the bilayer normal. In contrast, as shown in Fig. 8A, the density of DOPC (normalized to per PC) shows a significant decrease as cholesterol mole fraction increases. The rigid sterol rings of cholesterol compress the acyl chains of DOPC, causing the tight packing and the increase of order parameter of acyl chains (Fig. 5), which is a well-known effect of cholesterol.31 As expected, the free space is the lowest in this region (Fig. 8C). The cholesterol condensing effect is most significant in this region, where cholesterol's sterol rings cut into the space originally occupied by the acyl chains of PC and reduce the overall bilayer area. (iii) In the PC headgroup region, the density of cholesterol is very low. However, the behavior of the PC density profile is more complex: As a result of increasing cholesterol mole fraction, the density of PC increases in this region as the acyl chains of DOPC become more ordered and the thickness of the bilayer increases. When xc is above 0.2, the density profile of PC shows a small peak in this region. Furthermore, for xc > 0.39, the peak becomes large and sharp, and also shifts slightly towards the bilayer center. This shift is directly related to the decrease of bilayer height at high cholesterol shown in Fig. 2. It is unknown whether such shift also exists in a DPPC/cholesterol system, since the highest xc in the previous study was 0.50.14 Therefore, cholesterol does not produce a condensing effect in the PC headgroup region: In contrast, PC headgroups gradually expand to cover more lateral area along the bilayer-aqueous interface as xc increases.
Figure 8.
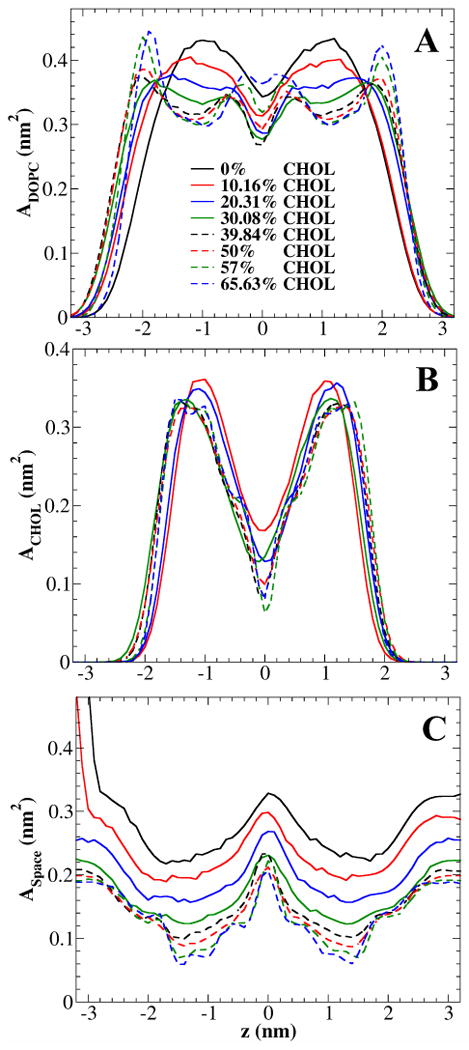
The VDW area per DOPC (A), per cholesterol (B), and free space per lipid (C) versus location z at some selected cholesterol concentrations.
The condensing of PC acyl chains and the lateral expansion of PC headgroup can be elegantly explained by the Umbrella model.18,32 The model suggests that the small headgroup/body ratio of cholesterol determines its mixing behavior in a lipid membrane. The cholesterol OH is a small polar head that cannot cover its larger nonpolar steroid ring body. In a bilayer, nonpolar cholesterol relies on polar phospholipid headgroup coverage to avoid the unfavorable free energy of cholesterol contact with water. Driven by the coverage requirement, cholesterol molecules need to squeeze into the acyl chain region and partially hide under the headgroups of neighboring PCs, which will restrict the motions of the acyl chains and increase the chain order parameter. While this requirement causes the condensing of PC acyl chains, the headgroups of PC need to reorient and expand at bilayer-aqueous interface in order to cover more cholesterol. Curiously, the expansion of PC headgroups shown in Fig. 8A was explicitly predicted in the Umbrella model.18 Recently, MD simulation studies showed that the Umbrella effect of cholesterol is present in both saturated and unsaturated PC bilayers.33 Furthermore, a coarse grain simulation demonstrated that no cholesterol condensing effect could be observed if cholesterol structure is modified slightly by the addition of an extra hydrophilic head group or a reduction in size of the hydrophobic body2. The study confirmed that the cholesterol condensing effect originates directly from the mismatch between cholesterol's small polar headgroup and its large nonpolar body, not from the VDW attraction between cholesterol and phospholipids.
Area per PC and area per cholesterol
Figure 9 and Table 1 shows the area per DOPC and area per cholesterol calculated using different methods of analysis. The value of aCHOL(xc) calculated by Methods 1 varies between 0.298 and 0.254 nm2, and aDOPC(xc) varies between 0.671 and 0.546 nm2. We noticed that volume per lipid vs. xc in our system is quite linear (Fig. 2), similar to DPPC/cholesterol system. Therefore, following the procedure used by Edholm and Nagle,13 we first fit the volume per lipid using a linear function that assumes vDOPC and vCHOL are independent of xc. The linear regression shown in Fig. 2 gives vDOPC = 1.316 nm3 and vCHOL = 0.541 nm3. The area per DOPC and area per cholesterol calculated by Method 2 were plotted in Fig. 9 as well. The values of aCHOL(xc) lie in the range 0.273 – 0.230 nm2, and aDOPC(xc) is within 0.671 - 0.559 nm2, similar to the result obtained using Method 1. The most important feature in Fig. 9 is that both area per DOPC and area per cholesterol initially decrease with xc, but start to increase when xc is greater than 0.40. The increase has not been observed in previous studies as the highest cholesterol mole fraction attempted was 0.50.5 The decreases of area per PC and area per cholesterol have been interpreted as the result of the cholesterol condensing effect. However, this interpretation becomes problematic at high cholesterol mole fractions, since both calculated area per cholesterol and area per PC increase for xc > 0.40, while the area per lipid continues to decrease (Fig. 3). The inconsistency was caused by the assumption built into Method 1 and 2: Both PC and cholesterol have cylindrical shapes and the same height. As shown in Figs. 6-8, this is a problematic assumption: Cholesterol is shorter than DOPC, and the cross-sectional area of molecule varies widely as a function of z. Thus, both methods intrinsically overestimate area per DOPC and underestimate area per cholesterol. Fundamentally, the lipid bilayer is a three-dimensional structure: Treating it as a two-dimensional structure will yield unpredictable results.
Figure 9.
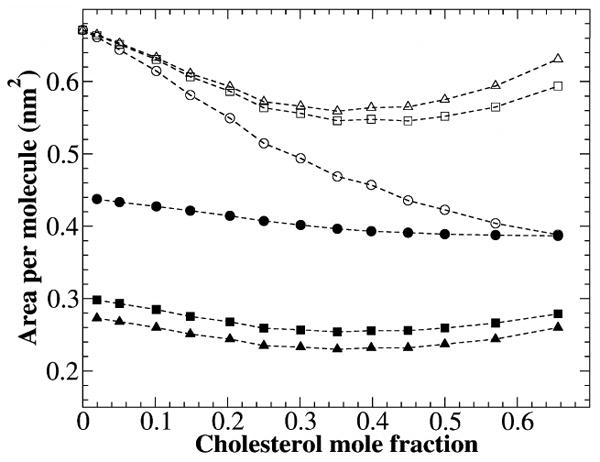
Area per DOPC and area per cholesterol calculated using different methods. Area per DOPC: by Method 1 (open squares) and by Method 2 (open triangles). Area per cholesterol: by Method 1 (filled squares) and by Method 2 (filled triangles). Area per cholesterol in the areal-determining planes (i.e., cholesterol sterol ring region): filled circles; Area per DOPC in the areal-determining planes: open circles.
Lipid areas in the areal-determining plane
Since the heights of the two molecules are different, Figs. 6-8 show that there is a strong z-dependence between the cross-sectional areas of PC and cholesterol. Therefore, the average area per lipid and area per cholesterol are poorly defined parameters. Partial-specific areas of lipids correctly assess the change of total bilayer area when a lipid is added to or removed from the bilayer. Based on the discussion above, it can be concluded that the molecular packing in the cholesterol sterol ring region determines the total area of a cholesterol-containing lipid bilayer. Here, we define the horizontal plane, in which the VDW cross-sectional area of cholesterol reaches the maximum (Fig. 8B), as the “areal-determining plane”. The packing density of cholesterol and PC together is highest within this plane and the PC-cholesterol interactions in this plane essentially determine the total area of the bilayer. Fig. 10 shows the VDW areas of DOPC and cholesterol as functions of cholesterol mole fraction within the areal-determining plane. The data were averaged over the last 50 ns of simulation. At each cholesterol mole fraction, the peak position of the VDW area of cholesterol (Fig. 8B) was used to locate the areal-determining plane. The VDW area of DOPC in the areal-determining planes decreases from 0.431 to 0.308 nm2, due to the compression by cholesterol sterol rings. For the same reason, the free area per lipid also decreases continuously. An important feature of Fig. 10 is that the VDW area of cholesterol in this region decreases from 0.366 to 0.322 nm2. Since cholesterol sterol ring structure is rigid and does not change shape in a PC bilayer, this decrease must be caused by the decrease of cholesterol tilt angle in respect to the bilayer normal as cholesterol mole fraction increases. In order to visualize the effect of cholesterol tilt angle, the VDW area of cholesterol in the areal-determining plane was fitted by the function Ao/cos(θ(xc)) in Fig. 10 (the red dashed line). θ(xc) is the average cholesterol tilt angle in Table 1 and Fig. 4B, and Ao is a fitting constant, which is the VDW area of cholesterol sterol rings at zero tile angle. The best fit was obtained with Ao = 0.3179±0.0026 nm2. This good fit between cholesterol VDW area and Ao/cos(θ(xc)) indicates that the decrease of VDW area of cholesterol with the increasing of xc indeed results from the decreasing of cholesterol tilt angle.
Figure 10.
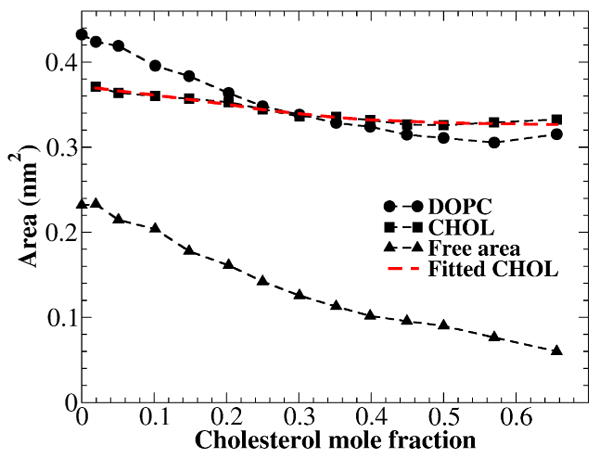
The VDW areas of DOPC and cholesterol, and free area per lipid as functions of cholesterol mole fraction in the areal-determining planes. The red dash line is the fitting function Ao/cos(θ(xc)), where θ(xc) is the average cholesterol tilt angle plotted in Fig. 4B, and Ao is the fitting constant (0.3179±0.0026 nm2).
On the basis of the above analysis, we reached the conclusion that the area lost due to the cholesterol condensing effect is primarily the VDW area and the free area originally belonged to PC. Therefore, we propose the following approach to quantitatively analyze the cholesterol condensing effect within the areal-determining planes: (i) The volume and shape of cholesterol fused rings are essentially independent of cholesterol mole fraction in a lipid bilayer. However, the average cholesterol tile angle has a large influence on the bilayer area. The area per cholesterol in the areal-determining plane is simply calculated using
| (8) |
where ao is the cross-sectional area of cholesterol within the areal-determining plane with zero tilt angle plus some free area associated with the cholesterol, and θ(xc) is the average tilt angle of the cholesterol as a function of xc. (ii) The rest of the area is assigned to PC: The area per DOPC in the areal-determining plane is calculated by
| (9) |
where A(xc) is the total lateral area of the simulation box, NCHOL and NDOPC are the numbers of cholesterol and PC in each leaflet, respectively.
The VDW areas of PC and cholesterol shown in Figure 10 are bare areas. As pointed out by Edholm and Nagle,13 the free area or free volume is naturally a part of lipid bilayers. For pure PC lipid bilayers, all free area or free volume should be assigned to PC. The difficulty is how to divide the free area between PC and cholesterol when a bilayer contains cholesterol. The physical meaning of the parameter ao is the area occupied by the cholesterol sterol rings in a hypothetical pure cholesterol bilayer with zero tilt angle, which includes some free area associated with a cholesterol. Since the maximum solubility of cholesterol in many PC bilayers is 0.66,24,25 the value of ao cannot be obtained from either experiment or simulation. However, the possible range of ao can be narrowed down through following considerations: (i) the cross-sectional area of cholesterol in cholesterol monohydrate crystals was determined to be 0.36 nm2 by Craven using X-ray diffraction.34 (ii) At the air-water interface, in pure cholesterol monolayers at a lateral pressure similar to that of a lipid bilayer (30 mN/m)35, the measured area per cholesterol is 0.37-0.39 nm2.36,37 This area includes the free area surrounding a cholesterol in the monolayers. (iii) The bare area of cholesterol sterol rings (without any free area) at zero tilt angle (i.e., Ao) was extrapolated to be 0.3179±0.0026 nm2 in this study. This value should be considered as the lower limit of ao. Although the relevance of the molecular area of cholesterol in a crystal or a monolayer to that in a bilayer is a concern, we estimate that the reasonable value for ao should be between 0.35 to 0.40 nm2. In this study, we choose ao = 0.38 nm2 for the calculation.
The calculated area per DOPC and area per cholesterol in the areal-determining plane are also plotted in Figure 9. Because our definition is obviously different from that of Method 1 and 2, the obtained values are very different as well. The area per cholesterol in the areal-determining plane decreases from ∼0.438 nm2 at low cholesterol to ∼0.387 nm2 near its maximum solubility limit (xc = 0.66). The decrease is caused by the decrease of cholesterol tilt angle in respect to the bilayer normal. On the other hand, area per DOPC in the areal-determining plane decreases from the pure DOPC bilayer value of ∼0.671nm2 to ∼0.388 nm2 near xc = 0.66. This large decrease of area per DOPC, about 40% of its original area, is caused by the compression of DOPC acyl chains by cholesterol's rigid sterol rings, and reflects the true magnitude of the cholesterol condensing effect.
Conclusion
Based on the analysis of cross-sectional areas of molecules using the slicing method, the condensing effect of cholesterol is found to be limited to the cholesterol sterol ring region where the acyl chains of DOPC are severely compressed by cholesterol. As xc increases, the headgroups of DOPC gradually expand along the bilayer-aqueous interface to cover more cholesterol. The results are in good agreement with the Umbrella model. Our analysis showed that the total area of a PC/cholesterol bilayer is primarily determined by the molecular packing in the cholesterol sterol ring region, more precisely, in the areal-determining plane. The calculated partial-specific areas of lipids clearly show the condensing effect of cholesterol. A cholesterol-containing PC bilayer is indeed a 3-dimensional structure; therefore, average area per PC and area per cholesterol are not well-defined quantities. An alternative approach for calculating area per molecule within the areal-determining plane is proposed. In this region, the cholesterol tilt angle largely determines the area occupied by a cholesterol molecule, and the compression of PC acyl chains by cholesterol sterol rings is directly responsible for the well-known cholesterol condensing effect. Although the new method still has some arbitrary features, the calculated areas are more meaningful in describing the molecular packing and cholesterol condensing effect in a lipid bilayer: Our calculation showed that the majority of the area lost due to the cholesterol condensing effect is taken from PC molecules.
Acknowledgments
This work was supported by the National Institute of Health grant 1 R01 GM077198-01A1 subaward 49238-8402 and National Science Foundation grant MCB-0344463. The authors thank Mr. Charlie Huang for assistance in editing. The authors also acknowledge the High Performance Computing Center (HPCC) at Texas Tech University for providing HPC resources for this work.
References
- 1.Berkowitz ML. Biochim Biophys Acta. 2009;1788:86. doi: 10.1016/j.bbamem.2008.09.009. [DOI] [PubMed] [Google Scholar]
- 2.de Meyer F, Smit B. Proc Natl Acad Sci U S A. 2009;106:3654. doi: 10.1073/pnas.0809959106. [DOI] [PMC free article] [PubMed] [Google Scholar]
- 3.Kucerka N, Perlmutter JD, Pan J, Tristram-Nagle S, Katsaras J, Sachs JN. Biophys J. 2008;95:2792. doi: 10.1529/biophysj.107.122465. [DOI] [PMC free article] [PubMed] [Google Scholar]
- 4.Niemela PS, Hyvonen MT, Vattulainen I. Biochim Biophys Acta. 2009;1788:122. doi: 10.1016/j.bbamem.2008.08.018. [DOI] [PubMed] [Google Scholar]
- 5.Pandit SA, Chiu SW, Jakobsson E, Grama A, Scott HL. Langmuir. 2008;24:6858. doi: 10.1021/la8004135. [DOI] [PMC free article] [PubMed] [Google Scholar]
- 6.Pitman MC, Suits F, Mackerell AD, Jr, Feller SE. Biochemistry. 2004;43:15318. doi: 10.1021/bi048231w. [DOI] [PubMed] [Google Scholar]
- 7.Rog T, Pasenkiewicz-Gierula M, Vattulainen I, Karttunen M. Biochim Biophys Acta. 2009;1788:97. doi: 10.1016/j.bbamem.2008.08.022. [DOI] [PubMed] [Google Scholar]
- 8.Sapay N, Bennett WFD, Tieleman DP. Soft Matter. 2009;5:3295. [Google Scholar]
- 9.Zhu Q, Cheng KH, Vaughn MW. J Phys Chem B. 2007;111:11021. doi: 10.1021/jp070487z. [DOI] [PubMed] [Google Scholar]
- 10.Leathes JB. Lancet. 1925;208:853. [Google Scholar]
- 11.Demel RA, van Deenen LLM, Pethica BA. Biochim Biophys Acta. 1967;135:11. doi: 10.1016/0005-2736(67)90054-5. [DOI] [PubMed] [Google Scholar]
- 12.Stockton BW, Smith ICP. Chem Phys Lipids. 1976;17 doi: 10.1016/0009-3084(76)90070-0. [DOI] [PubMed] [Google Scholar]
- 13.Edholm O, Nagle JF. Biophysical Journal. 2005;89:1827. doi: 10.1529/biophysj.105.064329. [DOI] [PMC free article] [PubMed] [Google Scholar]
- 14.Falck E, Patra M, Karttunen M, Hyvonen MT, Vattulainen I. Biophysical Journal. 2004;87:1076. doi: 10.1529/biophysj.104.041368. [DOI] [PMC free article] [PubMed] [Google Scholar]
- 15.Hofsäβ C, Lindahl E, Edholm O. Biophysical Journal. 2003;84:2192. doi: 10.1016/S0006-3495(03)75025-5. [DOI] [PMC free article] [PubMed] [Google Scholar]
- 16.Shinoda W, Okazaki S. Journal of Chemical Physics. 1998;109:1517. [Google Scholar]
- 17.Pandit SA, Vasudevan S, Chiu SW, Mashl RJ, Jakobsson E, Scott HL. Biophys J. 2004;87:1092. doi: 10.1529/biophysj.104.041939. [DOI] [PMC free article] [PubMed] [Google Scholar]
- 18.Huang J, Feigenson GW. Biophys J. 1999;76:2142. doi: 10.1016/S0006-3495(99)77369-8. [DOI] [PMC free article] [PubMed] [Google Scholar]
- 19.Berger O, Edholm O, Jahnig F. Biophys J. 1997;72:2002. doi: 10.1016/S0006-3495(97)78845-3. [DOI] [PMC free article] [PubMed] [Google Scholar]
- 20.Holtje M, Forster T, Brandt B, Engels T, von Rybinski W, Holtje HD. Biochim Biophys Acta. 2001;1511:156. doi: 10.1016/s0005-2736(01)00270-x. [DOI] [PubMed] [Google Scholar]
- 21.Van Der Spoel D, Lindahl E, Hess B, Groenhof G, Mark AE, Berendsen HJ. J Comput Chem. 2005;26:1701. doi: 10.1002/jcc.20291. [DOI] [PubMed] [Google Scholar]
- 22.Essmann U, Perera L, Berkowitz ML, Darden T, Lee H, Pedersen LG. Journal of Chemical Physics. 1995;103:8577. [Google Scholar]
- 23.Schuettelkopf AW, van Aalten DMF. Acta Crystallographica. 2004;D60:1355. doi: 10.1107/S0907444904011679. [DOI] [PubMed] [Google Scholar]
- 24.Parker A, Miles K, Cheng KH, Huang J. Biophys J. 2004;86:1532. doi: 10.1016/S0006-3495(04)74221-6. [DOI] [PMC free article] [PubMed] [Google Scholar]
- 25.Ali MR, Cheng KH, Huang J. Proc Natl Acad Sci U S A. 2007;104:5372. doi: 10.1073/pnas.0611450104. [DOI] [PMC free article] [PubMed] [Google Scholar]
- 26.Huang J, Buboltz JT, Feigenson GW. Biochim Biophys Acta. 1999;1417:89. doi: 10.1016/s0005-2736(98)00260-0. [DOI] [PubMed] [Google Scholar]
- 27.Buboltz JT, Feigenson GW. Biochim Biophys Acta. 1999;1417:232. doi: 10.1016/s0005-2736(99)00006-1. [DOI] [PubMed] [Google Scholar]
- 28.Greenwood AI, Tristram-Nagle S, Nagle JF. Chemistry and Physics of Lipids. 2006;143:1. doi: 10.1016/j.chemphyslip.2006.04.002. [DOI] [PMC free article] [PubMed] [Google Scholar]
- 29.Su YL, Li QZ, Chen L, Yu ZW. Colloids and Surfaces a-Physicochemical and Engineering Aspects. 2007;293:123. [Google Scholar]
- 30.Bondi A. J Phys Chem. 1964;68:441. [Google Scholar]
- 31.Vist MR, Davis JH. Biochemistry. 1990;29:451. doi: 10.1021/bi00454a021. [DOI] [PubMed] [Google Scholar]
- 32.Huang J. Methods Enzymol. 2009;455:329. doi: 10.1016/S0076-6879(08)04212-2. [DOI] [PMC free article] [PubMed] [Google Scholar]
- 33.Dai J, Alwarawrah M, Huang J. J Phys Chem B. 2010;114:840. doi: 10.1021/jp909061h. [DOI] [PMC free article] [PubMed] [Google Scholar]
- 34.Craven BM. Nature. 1976;260:727. doi: 10.1038/260727a0. [DOI] [PubMed] [Google Scholar]
- 35.Marsh D. Biochimica Et Biophysica Acta-Reviews on Biomembranes. 1996;1286:183. doi: 10.1016/s0304-4157(96)00009-3. [DOI] [PubMed] [Google Scholar]
- 36.Lundberg B. Chemistry and Physics of Lipids. 1982;31:23. doi: 10.1016/0009-3084(82)90062-7. [DOI] [PubMed] [Google Scholar]
- 37.Smaby JM, Momsen M, Kulkarni VS, Brown RE. Biochemistry. 1996;35:5696. doi: 10.1021/bi953057k. [DOI] [PMC free article] [PubMed] [Google Scholar]


