

Abstract
Prostate cancer is significantly more common in Western men than Asian men, but the basis for this difference remains unknown. Since genomic studies of Asian prostate cancer are very limited, we used a genome-wide approach to reveal the genomic alterations in Chinese prostate cancers. We found a significant reduction in the frequency of certain somatic genomic changes that are commonly found in Western prostate cancers, including the 21q22.2-22.3 deletion, which involves the TMPRSS2:ERG fusion gene, and 10q deletion, which causes PTEN inactivation. Array results were confirmed by PCR-based molecular copy number counting in selected samples. The different frequency of these genomic changes was further evaluated by fluorescence in situ hybridization and immunohistochemistry analyses of tissue microarray samples. These alterations may be key genetic changes underlying the regional/ethnic difference in clinical incidence and may be induced by specific environmental and/or genetic risk factors that Western men are exposed to. Our findings suggest that tumors arise in Western and Chinese populations by alternative pathogenetic mechanisms.
Keywords: prostate cancer, genomic changes, population, 21q22 deletion, PTEN deletion
Prostate cancer, the most common cancer in Western men, shows a wide variation in the clinical incidence and mortality rates of different geographical regions(1). Despite a recent increase, the prevalence of prostate cancer in Asian countries is 20 times less than in Western countries (1, 2). Numerous studies have been carried out to understand the factors contributing to this difference. However, each of the currently identified risk-factors is associated with only a modest increase in the incidence of prostate cancer and the real contribution of such factors is still debatable (2, 3). Carcinogenesis is associated with multiple somatic genomic alterations(4, 5). While the genomic alterations in prostate cancer cells from Western populations are well studied, data from Asian samples are limited. To determine the similarities and/or differences in genomic alterations in prostate cancer samples from high- and low-incidence populations, we analyzed the genomic alterations in Chinese prostate cancer (low-incidence) and found specific genomic differences in cancers from China and Western courtiers.
Material and methods
Samples
39 Chinese (Table S1, all from China) and 5 UK fresh-frozen prostate cancer samples were collected and stored in ethically approved tissue banks. Case-matched adjacent phenotypically normal tissue was available for 33/39 Chinese samples and all five UK cases. 28 benign prostate hyperplasia (BPH), 168 UK prostate cancer cases (<10% were of Asian and none were of Chinese origin) and 143 Chinese prostate cancer cases (all Chinese ethnicity and from China), were collected for tissue microarray (TMA) studies. For both Chinese and UK patients, the majority were not PSA screened. Ethical approvals were obtained from each local ethics committee.
SNP Array Analysis
The predominant tumor nodule and adjacent normal tissue were identified by histopathologists (YY and DL) on fresh-frozen sections and macrodissected (mini-scalpel) or microdissected (PALM Microlaser Technologies, Bernried, Germany). Only foci with greater than 80% purity of cancer cells were macrodissected. SNP array analysis using Human SNP Array 6.0 (Affymetrix, Buckinghamshire, UK) was performed according to the manufacturer’s instructions and scanned with a Genechip Scanner 3000 7G (Affymetrix) using Affymetrix Genechip Operating Software. Hybridization data were filtered using the same Operating Software to exclude weakly hybridized SNPs.
Signal intensity data from SNP arrays were analyzed using Partek Genomics Suite (Partek Incorporated, St Louis, MO) and our own GOLF (V2.2.10) software (6, 7). The signal intensity ratio between test and normal samples was plotted for DNA copy-number alterations. Ensembl Genome Browser Build 36.2 was applied to define the genomic regions. For paired samples, tumor data were compared to case-matched normal controls. Unpaired Chinese tumor samples were analyzed against eight normal samples that were representative of the majority germline copy number variations. Within Partek GS, the copy-number workflow was used with default parameters. With GOLF, chromosomal gain/loss events were considered if the signal intensity ratio of the mean of 20 contiguous probes was significantly outside 0±0.4 log2 ratio. Regions considered positive by only one software (<5%) were subtle changes and were excluded from the final results.
PCR-based Molecular Copy-number Counting (MCC)
MCC was carried out as previously described (8). Two primer sets ERG(+) and ERG(−) were designed to amplify the undeleted ERG gene region and the region deleted between TMPRSS2 and ERG, respectively (Table S2). For each sample, 88 reactions were performed in a 96-well plate with 8 non-DNA negative controls The presence or absence of PCR product (207 bp and 189 bp for ERG(+) and ERG(−) markers respectively) was visualised and scored, using the Diana V1.6 software (Raytest GmbH, Straubenhardt, Germany).
Fluorescent in situ Hybridization (FISH) Analysis of TMA samples
Representative BPH and cancer areas were identified on H&E stained sections by histopathologists (DB, GR and LB). TMAs were constructed by taking three cores of 1 mm diameter from each sample using a manual Tissue Arrayer (Beecher Instruments, Sun Prairie, WI).
FISH analysis for TMPRSS2 and ERG rearrangements on TMAs was performed as previously described (9) using two bacterial artificial chromosomes (BACs), RP11-95I21 (5′ ERG) and RP11-476D17 (3′ ERG), described by Tomlins et al (10). BAC DNA was amplified using GenomiPhi amplification V2 kit (GE Healthcare, Bucks, UK) and labeled with digoxigenin and biotin, respectively, using the BioPrime labeling kit (Invitrogen). For PTEN deletion, the commercial FISH probe, Vysis LSI PTEN (10q23)/ CEP10 DUAL Color Probe, from Abbott Molecular (Maidenhead, UK) containing SpectrumOrange-labeled PTEN BAC probe and a SpectrumGreen-labeled chromosome 10 centromere control probe was used following the manufacturer recommended protocol. FISH slides were scanned using a 40x lens on the Applied Imaging Ariol® System (Applied Imaging, San Jose, CA, USA) with seven 0.5 μm z-stacks. FISH results were analyzed double-blindly. A minimum of 100 cells with clear hybridization signals were counted per core.
Immunohistochemistry
The standard ABC (Avidin Biotin Complex) method (Vector ABC kit, Vector Laboratories Inc, Burlingame, CA) was employed for immunostaining with high-pressure cooking antigen retrieval. The mouse monoclonal NCL-PTEN primary antibody (1:150, Novocastra, Newcastle, UK) was used to detect PTEN protein in the TMAs. Both prevalence and intensity of PTEN staining were scored for each core. For each case, the percentage of each intensity score from replicate cores was averaged to give a final PTEN expression record.
Statistical Analysis
Differences in continuous data were compared using the Student’s t test. Differences in discreet data were compared using a Chi-square test.
Results and Discussion
The Genome-wide Alterations in Chinese Prostate Cancer and the Differences from Western Cases
Thirty-nine Chinese prostate cancer samples were analyzed using Affymetrix SNP Array 6.0 high-density microarrays and microarray data have been deposited in the Gene Expression Omnibus (Accession No. GSE18333). This study generated a high-resolution genomic alteration map for Chinese prostate cancer, which we hope will facilitate the genetic study of prostate cancer in this population. The genomic copy-number changes observed in the Chinese prostate cancer samples are summarised in Fig. 1A and Table S3. Common regions of chromosomal copy-number gains were 7 (11/39), 8q (16/39) and 3q (9/39) and losses were 5q15-21.3 (18/39), 6q14.1-22.1 (27/39), 8p (25/39), 13q12.3-31.1 (28/39) and 16q12.1-24.3 (20/39).
Figure 1.

Lack of 10q23 and 21q22.2-22.3 deletions in Chinese prostate cancer detected by SNP array analysis. (A) Summary of SNP Array 6.0 results of 39 Chinese prostate cancer cases. Red and blue bars on the right of each chromosome represent regions of copy-number gains and losses, respectively. (B) SNP intensity profile of Chromosome 10 and 21 in UK and Chinese samples. The purple bar indicates the location of PTEN (chr 10), ERG (chr 21, left bar) and TMPRSS2 (chr 21, right bar) respectively, which mark the regions deleted in UK but not Chinese samples. In each SNP intensity plot, the middle horizontal line represents a log2 ratio of 0 compared with normal controls. The bottom and upper lines represent log2 ratios of −1 and +1, respectively.
By comparison to data reported previously for Western prostate cancers (4, 11-13), we have identified genomic alterations common to both populations, including gains of 7 and 8q, and losses of 6q14.1-22.1, 8p, 13q12.3-31.1 and 16q12.1-24.3. However, the frequency of 6q14.1-22.1 (27/39) and 13q12.3-31.1 (28/39) deletions detected in this study is greater than that previously reported for Western cancers (4, 12, 13). Tumour suppressor genes RB, BRCA2 and KLF5 are located at 13q12.3-31.1 and candidate tumour suppressor genes at 6q14.1-22.1 have been suggested but not yet confirmed (4, 14). In Western populations, 6q15 and 6q21 deletions characterize certain subgroups of prostate cancer (4, 14). The roles of these genes at 6q14.1-22.1 and 13q12.3-31.1 in Chinese prostate cancer development should, therefore, be investigated.
Surprisingly, in the Chinese samples, we found low frequencies of two common genomic changes observed in Western samples: deletion of 21q22.2-22.3.3 between the ERG and TMPRSS2 genes and deletion of 10q23, including the PTEN gene locus. TMPRSS2:ERG is the most common gene fusion event in human cancers, occurring in ~50% of prostate cancers (4, 5, 10-16) and leads to over-expression of ERG from the TMPRSS2 promoter. Deletion of 21q22.2-22.3, between TMPRSS2 and ERG, accounts for more than half of the TMPRSS2:ERG fusion cases (12, 15, 16). However, this deletion was observed in only 1/39 Chinese samples. In prostate cancer, PTEN is commonly inactivated and chromosome deletion account for the majority of PTEN loss-of-function cases (17). Despite occurring in about 40% of prostate cancer samples (12, 17, 18), deletion at 10q PTEN region was observed in only 3/39 Chinese cases (Fig. 1A and Table S3). Using the same methods, we analyzed five UK cancer samples and detected 3/5 and 4/5, respectively, for deletions at 10q23 and 21q22.2-22.3 (Fig. S1 and Table S4). Although the number of samples is small, the high frequency of 10q23 and 21q22.2-22.3 deletions detected in our UK samples indicates that our method is sufficient to detect these genomic alterations. Representative images of chromosomes 10 and 21, are shown in Fig. 1B.
Confirmation of SNP Array Results Using MCC analysis
To confirm our SNP microarray results, the genomic copy-numbers at 21q22.2-22.3 between TMPRSS2 and ERG were determined by MCC in four UK samples with the 21q22.2-22.3 deletion and four Chinese samples without this deletion. Using two sets of MCC primers ERG(+) and ERG(−), we detected a similar number of ERG(+) and ERG(−) products in the Chinese samples with ERG(−):ERG(+) ratios range from 0.90 to 1.04. Consistent with the 21q22.2-22.3 deletion detected by the SNP microarrays, a reduced number of ERG(−) products were observed in the UK samples with ERG(−):ERG(+) range from 0.40 to 0.73 (Table 1 and Fig. S2).
Table 1.
Molecular copy-number counting confirms ERG deletion in four UK prostate cancer cases (P9-98) and lack of deletion in four Chinese prostate cancer cases (SH1-SH6).
| Sample | ERG(+) No. | ERG(−) No. | Ratio ERG(−):ERG(+) |
|---|---|---|---|
| P9 | 39 | 20 | 0.51 |
| P55 | 30 | 12 | 0.40 |
| P68 | 55 | 40 | 0.73 |
| P98 | 34 | 21 | 0.62 |
| SH1 | 31 | 28 | 0.90 |
| SH3 | 47 | 48 | 1.02 |
| SH5 | 79 | 82 | 1.04 |
| SH6 | 65 | 67 | 1.03 |
Frequency of ERG Rearrangements and PTEN Deletion/Inactivation Evaluated using TMAs
We evaluated the genomic differences between Western and Chinese prostate cancers using FISH analysis of TMAs containing a separate set of formalin-fixed, paraffin-embedded samples from the two populations. BPH samples were used as controls. While ERG status was consistent in replicate cores, in some cases, PTEN deletion was only detect in one or two cores from a case. We considered cases to be PTEN deletion cases if PTEN signal was lost in any cores. We found that ERG 5′ region was deleted in 29.7% (46/155) and the 5′ and 3′ BAC signals were split in 11.6% (18/155) of UK samples (Table S5 and S7), but only in 5.4% (5/93) and 2.1% (2/93) of Chinese samples, respectively (Table S6 and S7). Representative FISH images are shown in Fig. 2. While the frequency of ERG rearrangements in UK samples is similar to that previously published for Western samples (12, 15, 16), they were observed less frequently in the Chinese samples (P<0.001, Table S7). Consistent with our SNP array results, the PTEN genomic region was deleted in 42.3% (66/156) of UK samples (Table S5 and S7), but only in 14.3% (12/84) of Chinese samples (Table S6 and S7), which is statistically significant (P<0.001). Representative FISH images are shown in Fig. 2. As PTEN can also be inactivated by mutation and DNA methylation, we determined the frequency of PTEN inactivation using immunohistochemistry on the same TMA samples. Low-level (− or +) expression of PTEN was detected in 69.8% (111/159) of UK samples (Table S5 and S7), but only in 34% (31/91) of Chinese samples (Table S6 and S7). This difference is statistically significant (P<0.001, Table S7). Representative images are shown in Fig. 2. PTEN deletion accounts for more than half of cases where PTEN expression is reduced and in most cases, deletion resulted in PTEN underexpression (Table S5).
Figure 2.
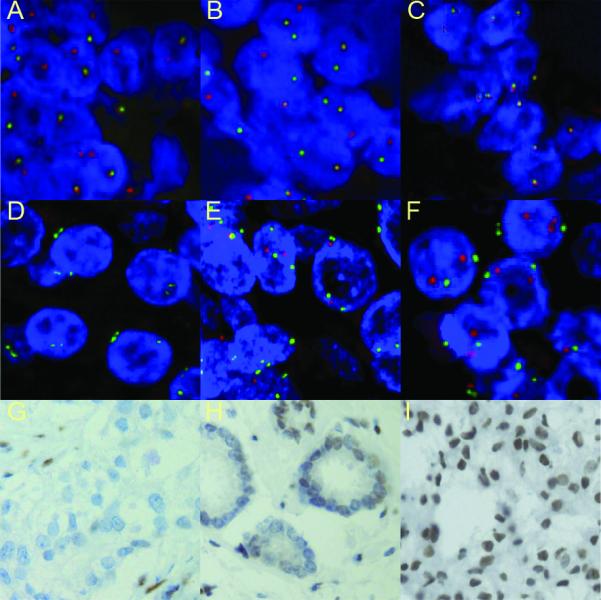
Representative ERG and PTEN FISH images. A-C: FISH analysis of ERG gene status using probes for ERG 3′ undeleted region (red signal) and ERG 5′ deleted region (green signal) shows a UK case with ERG deletion (A), a UK case with ERG split signals (B) and a Chinese case with no ERG deletion (C). D-F: The detection of PTEN copy-number using probes for the PTEN locus (red signal) and chromosome 10 centromere (green signal) shows homozygous (D) and heterozygous (E) PTEN loss in UK samples and no PTEN loss in a Chinese sample (F). G-I: Immunohistochemistry analysis shows loss of PTEN expression in cancer cells and positive stromal cells in a UK PTEN homozygous deletion case (G), lack of PTEN expression in a proportion of cancer cells from a UK partial PTEN deletion case (H) and strong PTEN expression (+++) in a Chinese sample without PTEN deletion (I).
High Gleason score is generally associated with an increased frequency of TMPRSS2:ERG fusion events and PTEN abnormalities (13, 16-18). Although the average Gleason score and age were significantly higher for the Chinese than UK cases (P<0.001 for both, Table S7), Gleason score and age were not significantly correlated with ERG rearrangements or PTEN deletion/inactivation in either sample group (P>0.05 for all correlations) and, therefore, cannot account for the difference in the frequency of these genetic alterations.
It has recently been reported that the TMPRSS2:ERG fusion cooperates with PTEN inactivation to drive prostate cancer development (18-20). We also observed the co-existence of TMPRSS2:ERG fusion with both PTEN deletion and inactivation in the UK samples (P<0.001 and =0.01 respectively) (Table S8). It is, therefore, interesting to find that ERG and PTEN abnormality are the predominant genomic differences between Western and Chinese samples; supporting the co-function of ERG over-expression and PTEN inactivation in prostate cancer development and implying that Western men may be exposed to a currently unknown causative factor(s) for these specific genetic alterations.
To summarize, we have used SNP array analysis to reveal, for the first time, high-resolution genomic alterations in Chinese prostate cancers. In doing so, we have identified key differences in the somatic genomic alterations in prostate cancers from two different risk populations. These genetic differences may underlie the regional/ethnic difference in clinical incidence and suggest different pathways of prostate carcinogenesis in these populations. Based on the nature of these genomic alterations, specific studies can be designed to accelerate the identification of causative factors and, thus, the mechanisms underlying these genomic alterations and the development of the disease.
Supplementary Material
Acknowledgments
We thank I Bisson, L Shan, Q An and JB Cazier for sample collection and technical support.
Grant support: Orchid Cancer Appeal, the UK Medical Research Council and the Cancer Research UK.
References
- 1.Gronberg H. Prostate cancer epidemiology. Lancet. 2003;361:859–64. doi: 10.1016/S0140-6736(03)12713-4. [DOI] [PubMed] [Google Scholar]
- 2.Sim HG, Cheng CW. Changing demography of prostate cancer in Asia. Eur J Cancer. 2005;41:834–45. doi: 10.1016/j.ejca.2004.12.033. [DOI] [PubMed] [Google Scholar]
- 3.Williams H, Powell IJ. Epidemiology, pathology, and genetics of prostate cancer among African Americans compared with other ethnicities. Methods Mol Biol. 2009;472:439–53. doi: 10.1007/978-1-60327-492-0_21. [DOI] [PubMed] [Google Scholar]
- 4.Lapointe J, Li C, Giacomini CP, et al. Genomic profiling reveals alternative genetic pathways of prostate tumorigenesis. Cancer Res. 2007;67:8504–10. doi: 10.1158/0008-5472.CAN-07-0673. [DOI] [PubMed] [Google Scholar]
- 5.Mitelman F, Johansson B, Mertens F. The impact of translocations and gene fusions on cancer causation. Nat Rev Cancer. 2007;7:233–45. doi: 10.1038/nrc2091. [DOI] [PubMed] [Google Scholar]
- 6.Paulsson K, Cazier JB, Macdougall F, et al. Microdeletions are a general feature of adult and adolescent acute lymphoblastic leukemia: Unexpected similarities with pediatric disease. Proc Natl Acad Sci U S A. 2008;105:6708–13. doi: 10.1073/pnas.0800408105. [DOI] [PMC free article] [PubMed] [Google Scholar]
- 7.Mao X, James SY, Yanez-Munoz RJ, et al. Rapid high-resolution karyotyping with precise identification of chromosome breakpoints. Genes Chromosomes Cancer. 2007;46:675–83. doi: 10.1002/gcc.20452. [DOI] [PubMed] [Google Scholar]
- 8.Daser A, Thangavelu M, Pannell R, et al. Interrogation of genomes by molecular copy-number counting (MCC) Nat Methods. 2006;3:447–53. doi: 10.1038/nmeth880. [DOI] [PubMed] [Google Scholar]
- 9.Summersgill B, Clark J, Shipley J. Fluorescence and chromogenic in situ hybridization to detect genetic aberrations in formalin-fixed paraffin embedded material, including tissue microarrays. Nat Protoc. 2008;3:220–34. doi: 10.1038/nprot.2007.534. [DOI] [PubMed] [Google Scholar]
- 10.Tomlins SA, Rhodes DR, Perner S, et al. Recurrent fusion of TMPRSS2 and ETS transcription factor genes in prostate cancer. Science. 2005;310:644–8. doi: 10.1126/science.1117679. [DOI] [PubMed] [Google Scholar]
- 11.Demichelis F, Setlur SR, Beroukhim R, et al. Distinct genomic aberrations associated with ERG rearranged prostate cancer. Genes Chromosomes Cancer. 2009;48:366–80. doi: 10.1002/gcc.20647. [DOI] [PMC free article] [PubMed] [Google Scholar]
- 12.Liu W, Chang B, Sauvageot J, et al. Comprehensive assessment of DNA copy number alterations in human prostate cancers using Affymetrix 100K SNP mapping array. Genes Chromosomes Cancer. 2006;45:1018–32. doi: 10.1002/gcc.20369. [DOI] [PubMed] [Google Scholar]
- 13.Reynolds MA. Molecular alterations in prostate cancer. Cancer Lett. 2008;271:13–24. doi: 10.1016/j.canlet.2008.04.047. [DOI] [PubMed] [Google Scholar]
- 14.Tomlins SA, Mehra R, Rhodes DR, et al. Integrative molecular concept modeling of prostate cancer progression. Nat Genet. 2007;39:41–51. doi: 10.1038/ng1935. [DOI] [PubMed] [Google Scholar]
- 15.Mehra R, Tomlins SA, Yu J, et al. Characterization of TMPRSS2-ETS gene aberrations in androgen-independent metastatic prostate cancer. Cancer Res. 2008;68:3584–90. doi: 10.1158/0008-5472.CAN-07-6154. [DOI] [PMC free article] [PubMed] [Google Scholar]
- 16.Perner S, Demichelis F, Beroukhim R, et al. TMPRSS2:ERG fusion-associated deletions provide insight into the heterogeneity of prostate cancer. Cancer Res. 2006;66:8337–41. doi: 10.1158/0008-5472.CAN-06-1482. [DOI] [PubMed] [Google Scholar]
- 17.Majumder PK, Sellers WR. Akt-regulated pathways in prostate cancer. Oncogene. 2005;24:7465–74. doi: 10.1038/sj.onc.1209096. [DOI] [PubMed] [Google Scholar]
- 18.Han B, Mehra R, Lonigro RJ, et al. Fluorescence in situ hybridization study shows association of PTEN deletion with ERG rearrangement during prostate cancer progression. Mod Pathol. 2009;22:1083–93. doi: 10.1038/modpathol.2009.69. [DOI] [PMC free article] [PubMed] [Google Scholar]
- 19.Carver BS, Tran J, Gopalan A, et al. Aberrant ERG expression cooperates with loss of PTEN to promote cancer progression in the prostate. Nat Genet. 2009;41:619–24. doi: 10.1038/ng.370. [DOI] [PMC free article] [PubMed] [Google Scholar]
- 20.King JC, Xu J, Wongvipat J, et al. Cooperativity of TMPRSS2-ERG with PI3-kinase pathway activation in prostate oncogenesis. Nat Genet. 2009;41:524–6. doi: 10.1038/ng.371. [DOI] [PMC free article] [PubMed] [Google Scholar]
Associated Data
This section collects any data citations, data availability statements, or supplementary materials included in this article.