Abstract
Human alcohol dehydrogenase 4 (ADH4) is one of the key enzymes involved in the metabolism of alcohol. ADH4 is highly expressed in the liver, and previous studies have revealed several cis-acting elements in the proximal promoter region. In this study we have identified a distal upstream enhancer, 4E, of ADH4. In HepG2 human hepatoma cells, 4E increased the activity of an ADH4 basal promoter by 50-fold. 4E was cell-specific, as no enhancer activity was detected in a human lung cell line, H1299. We have narrowed the enhancer activity to a 565 bp region and have identified multiple liver-enriched transcription factor binding sites in the region. By electrophoretic mobility shift assays, we confirmed binding of FOXA proteins to these sites. Site-directed mutagenesis studies demonstrated that sites 1 and 4 have the biggest effect on enhancer function, and mutations in multiple sites have multiplicative effects. We also studied the effects of three variations in the minimal enhancer region. Two variations had a significant effect on enhancer activity, decreasing the activity to 0.6-fold, while one had small but significant effect. The differences in the functional activity in different haplotypes suggest that this region could play an important role in the risk for alcoholism.
Keywords: Alcoholism, gene regulation, transcription factor, haplotype, polymorphisms
1. Introduction
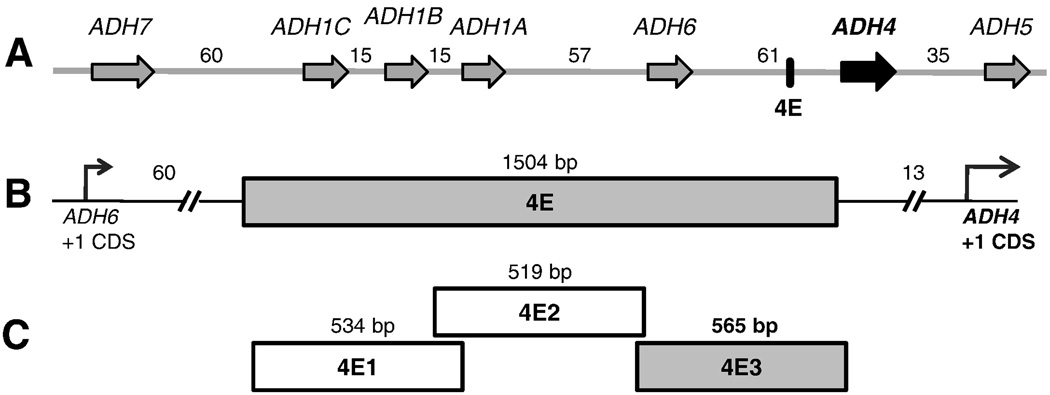
The human alcohol dehydrogenase (ADH) family of proteins catalyzes the reversible oxidation of a wide range of alcohols, including beverage alcohol. ADHs are dimers of 40 kDa subunits with a zinc ion in the active site; they use NAD as the coenzyme in catalysis (Hurley et al., 2003). In humans, there are seven isozymes with different electrophoretic and kinetic properties, but overlapping substrate specificities (Edenberg and Bosron, 1997). The isozymes are encoded by seven genes, ADH1A, ADH1B, ADH1C, ADH4, ADH5, ADH6 and ADH7, present as a cluster spanning approximately 365 kb on chromosome 4q23 (Figure 1A). All except ADH7 are expressed in liver (Edenberg, 2000). The class I isozymes ADH1A, ADH1B and ADH1C account for approximately 70% of alcohol metabolism in the liver, with ADH4 contributing most of the remaining 30% (Hurley et al., 2003).
Figure 1. Diagram of the ADH cluster, highlighting the test regions.
(A) Seven alcohol dehydrogenase genes are shown in their transcriptional orientation (they are oriented on chromosome 4q in the opposite direction). Arrows mark the genes and depict the direction of transcription. The genes range in size from 14.5 kb to 23 kb; intergenic distances are in kb. (B) The conserved region (4E) is enlarged; distances are in kb from +1 CDS of ADH6 and ADH4. (C) Sub-fragments of 4E that were tested for activity; sizes in bp. Segment with enhancer activity is shaded.
Alcoholism is a complex disease affecting millions, and the third leading cause of the preventable death in the United States (Mokdad et al., 2004). Chronic alcohol abuse is associated with numerous health risks like liver cirrhosis, cancer, and cardiovascular diseases (Cargiulo, 2007). Several studies have reported association of variations in the ADH region with the risk for alcoholism (Birley et al., 2009; Edenberg and Foroud, 2006; Edenberg et al., 2006; Reich et al., 1998; Williams et al., 1999). The activity of alcohol metabolizing enzymes could determine the rate of alcohol metabolism, which in turn affects the susceptibility to alcohol dependence. A single nucleotide polymorphism (SNP) in the coding sequence of ADH1B that changes Arg48 to His48 increases the activity of that enzyme by 90-fold (Hurley et al., 2003). ADH1B-His48 (ADH1B*2) is frequent in East Asian populations, in which it reduces the risk for alcohol dependence between 5 and 8-fold (Edenberg, 2007). Variations in cis-regulatory elements that affect the levels of ADH enzymes have also been associated with alcoholism. A SNP at position −136 (relative to the +1 translational start site) in the promoter of the ADH4 gene affects the promoter activity in hepatoma cells, with the A allele having 2-fold higher activity than the C allele (Edenberg et al., 1999). This SNP has been associated with alcohol dependence in a Brazilian population (Guindalini et al., 2005). In the Japanese population (with ALDH2*487Glu/Glu genotype) lower blood alcohol levels were observed in people with this variation (Kimura et al., 2009).
The ADH4 gene encodes π-alcohol dehydrogenase, which has a Km for ethanol of 34 mM (Li et al., 1977). In addition to ethanol, it can also carry out the oxidation and reduction of long-chain aliphatic alcohols and aromatic aldehydes (Edenberg and Bosron, 1997). The transcript is expressed at highest levels in liver, both fetal and adult, and at much lower levels in gastrointestinal tract, stomach and spleen (Edenberg, 2000). The proximal promoter of ADH4 has multiple transcription factor binding sites including members of the C/EBP family and AP-1 family (Li and Edenberg, 1998).The known cis-regulatory elements upstream of ADH4 do not completely account for its expression levels in the liver. Because polymorphisms in regulatory sequences may play a critical role in affecting the genetic risks for alcoholism, understanding the regulation of ADH expression is important. In this study, we have identified and characterized a distal regulatory element upstream of the ADH4 gene. We also studied the effects of polymorphisms on the function of this regulatory region.
2. Materials and Methods
2.1 Cloning of test fragments
Minimal promoters of ADH4 (4Basal; −41 to −299 bp relative to ADH4 +1 CDS) and ADH1B (1Basal; −10 to −151 bp relative to ADH1B +1 CDS) were amplified by PCR from human DNA using R-Taq polymerase (Midsci, St. Louis, MO). SV40 promoter was amplified from the pGL3 control vector (Promega, Madison, WI). All oligonucleotides are listed in Table 1a. All promoters were subcloned into KpnI and XhoI sites in the pXP2 luciferase reporter plasmid (Nordeen, 1988). Test fragment 4E (−14,506 to −13,003 bp relative to ADH4 + 1 CDS) was amplified by PCR from human DNA and cloned into BamHI and HindIII sites upstream of the respective promoters. Sub-fragments of 4E (Figure 1C) were cloned into BamHI and SalI sites of pXP2, upstream of 4Basal.
Table 1. List of oligonucleotides.
(1a) All oligonucleotides used in this study are listed. Forward (F) and reverse (R) primers used for amplification of minimal promoters and test regions are given. (1b) For primers used in mutagenesis, only the forward primer is listed, with the mutated site bold and underlined. Complementary oligonucleotides were used as reverse primers. (1c) For oligonucleotides used in EMSA, only the sense strand is shown.
| Oligo | Sequence | Description |
|---|---|---|
| a. Primers for reporter plasmid constructs | ||
| HE3475 | GTGGTACCGGGCTTTTCTCTATTATTTTA | 4 Basal _F |
| HE2492 | CCCTCGAGAAGCTTCAAACTCCTACCCA | 4 Basal _R |
| HE3639 | GTGGTACCAATCCAGTGGGTGTGGC | 1 Basal _F |
| HE3640 | CCAAGCTTGTCTTCTCTGCCCACCAG | 1 Basal _R |
| HE3641 | GTGGTACCCTGCGATCTGCATCTCAATTA | SV40 Basal _F |
| HE3642 | CCAAGCTTAGTACCGGAATGCCAAGC | SV40 Basal _R |
| HE3481 | CGGGATCCCAAGCCAGAATGAAAAGGTAGAC | 4E _F |
| HE3482 | CCAAGCTTAGCCAGAGCACAAATAATGGAG | 4E _R |
| HE3623 | CGGGATCCCCAAGCCAGAATGAAAAGGTA | 4E1 _F |
| HE3633 | GCGTCGACTTGCGATTTCTCTGGGATG | 4E1 _R |
| HE3627 | CGGGATCCTCAGGTCCATTCTGTGAACG | 4E2 _F |
| HE3635 | GCGTCGACTGTAGTCTCCCCTCTCTTGCTG | 4E2 _R |
| HE3629 | CGGGATCCCAGATAACAGCAAGAGAGGGG | 4E3 _F |
| HE3636 | GCGTCGACCAGCCAGAGCACAAATAATGG | 4E3 _R |
| b. Site directed mutagenesis primers | ||
| HE3825 | TTCAAGATCAGCAATTTGACACACCCGTTGAACTTTGTAATCAAACAGAC | Site 1 mutant |
| HE3843 | AATCAAACCTCTGCTTCCCTACACCCGTCTGAAAAGATCAAACGGG | Site 2 mutant |
| HE3876 | GCACAGCCCCTAATTTGTTAATATGTTACATAATACTTACCTCACAGGGTT | Site 3 mutant |
| HE3872 | GCATGTTGTCTACCCCCATAATATGTTACATAATACTTACCTCACAGGGTT | Site 4 mutant |
| HE3874 | GTAAGCATGTTGTCTTATTCACCCGTATGTTACATAATACTTACCTCAC | Site 5 mutant |
| HE3823 | AGTTTCTTCCCACTAAATAAAACACCCGTGAAGTTTTCTCTTAGCTAACA | Site 6 mutant |
| HE3881 | CACAGCCCCTAACCCCCATAATATGtTACATAATACTTACCTCACAGGGTT | Sites 3 and 4 mutant |
| HE3817 | CCCAAATTTCATCGAACATCCTAAAACTTTCAAGATC | rs7678936 T allele |
| HE3819 | GTTGTCTTATTTGTTAATATGGTACATAATACTTACCTCACAG | rs7678890 G allele |
| HE3821 | GTCTCTTTTCTGGAAAATCAGAGATCTGTCATTG | rs11401494 T allele |
| c. Oligos for EMSA | ||
| HE3781 | 5’6-FAM-TTTCAAGATCAGCAATTTGACAGCAAACATGAA CTTTGTA | EMSA Oligo 1 |
| HE3782 | 5’6-FAM-CTGCTTCCCTAACAAACACTGAAAAGATCAA | EMSA Oligo 2 |
| HE3941 | 5’6-FAM-TAAGCATGTTGTCTTATTTGTTAATATGTTACAT AATAC | EMSA Oligo 3 |
| HE3784 | 5’6-FAM-TTAGTTTCTTCCCACTAAATAAAAACAAACAGAA GTTTTC | EMSA Oligo 4 |
| HE3918 | GCCCATTGTTTGTTTTAAGCC | HNF-3 consensus |
| HE3829 | TCCCATACCCCCATTTAAGCC | HNF-3 consensus mutated |
2.2 Transient transfections and Reporter gene assays
HepG2 human hepatoma cells (HB-8065; ATCC, Manassas, VA) were cultured in MEM (ATCC) with 10% FBS (Invitrogen, Carlsbad, CA), 4 mM glutamine (Thermo Scientific Hyclone, Waltham, MA) and 1× Penicillin and Streptomycin (Thermo Scientific Hyclone) on cell bind surface plates (Corning Inc, Corning, NY) at 37 °C. For transfection assays, 3 × 10⁵ cells were seeded per well in 12-well plates. 24 h after seeding, cells were transfected in complete media with 500 ng of test DNA, along with 15 ng of pCMV β-galactosidase plasmid (Clontech, Mountain View, CA) and 485 ng of pUC19 DNA, using 2 µl of Fugene HD (Roche, Indianapolis, IN) per 1 µg of DNA. Cells were harvested 30 h after addition of DNA by scraping into ice-cold 1× PBS, pelleted by centrifugation and suspended in 100 µl of 1× Reporter lysis buffer (Promega, Madison, WI). Cell extract was prepared by repeated freeze-thawing; 5 µl of the extract was used for each assay. Luciferase assays were carried out using the Luciferase assay system (Promega, Madison, WI), with activity measured on a Spectromax LS (Molecular devices, Sunnyvale, CA). β-galactosidase assays were carried out using the Galacto-Light System (Tropix, Benford, MA).
H1299 human lung carcinoma cells (ATCC CRL-5803) were cultured in high glucose DMEM (Sigma- Aldrich, St. Louis, MO) with 10% FBS, 2 mM glutamine and 1× Penicillin and Streptomycin on plastic plates (BD biosciences, San Jose, CA) at 37 °C. Cells were seeded at 7 × 10⁵ per well in 6-well plates (BD biosciences, San Jose, CA). 24 h after seeding, cells were transfected in complete media with 2 µg of test DNA, along with 135 ng of β-galactosidase plasmid and 1.1 µg of pUC19 DNA using 3 µl of Fugene HD per 1 µg of DNA. Cells were harvested 30 h after addition of DNA, and processed and assayed as described above. 15 µl and 2.5 µl of the extract were used for Luciferase and β-galactosidase assays, respectively; activity was measured on a Monolight 2010 Luminometer (Analytical Luminescence Laboratory, Sparks, MD).
All test constructs were transfected at least in triplicate in each individual experiment, with experiments repeated at least three times. Promoter activity was defined as luciferase activity normalized to β-galactosidase activity, to correct for the transfection efficiency. A t-test assuming unequal variances was carried out in Microsoft Excel, considering each well as an independent data point.
2.3 Site directed mutagenesis
Mutants of the potential transcription factor binding sites were generated by overlap extension PCR (Sambrook et al., 1989). Oligonucleotides in which the potential transcription factor binding sites were mutated (Table 1b) were synthesized by Integrated DNA Technologies (Coralville, IA). In the first step of the PCR, two fragments were generated such that they overlap at the mutated sequence. Products were gel extracted and 75 ng of each product was used as template in the extension step. Products with overlapping ends were mixed with R-Taq polymerase and ten PCR cycles were run without primers. HE3629 and HE3636 were then added and PCR was continued for another 25 cycles to amplify the full-length fragment. Products of the extension step were column purified and cloned into BamHI and SalI sites in the pXP2 vector, upstream of the ADH4 promoter.
2.4 Generation of the haplotypes
Different haplotypes of the 4E3 region were generated by site-directed mutagenesis with the Quick change site-directed mutagenesis kit (Stratagene, La Jolla, CA). Primers were designed with the SNP at the center (Table 1b). The amplified products were digested with DpnI to remove the template plasmid, and then transformed into DH5α competent cells (Invitrogen). Transformants were sequenced to confirm the presence of the SNP at the desired site.
2.5 Electrophoretic Mobility shift assay (EMSA)
EMSAs were carried out with double-strand oligonucleotides designed to span the putative transcription factor binding sites (Table 1c). Oligonucleotides were synthesized (Integrated DNA Technologies) with a 5’ 6-FAM label on one of the strands and then annealed to complementary unlabeled oligonucleotides in 10 mM Tris (pH 8.0), 1 mM EDTA (pH 8.0) and 50 mM sodium chloride. Nuclear extracts were prepared from HepG2 cells using NE-PER Nuclear and Cytoplasmic Extraction Reagents (Thermoscientific Pierce, Waltham, MA), following the manufacturer’s protocol. Protein concentrations were measured by Bio-Rad protein assay (Bio-Rad, Hercules, CA). Protein binding reactions were carried out with 0.2 or 0.4 picomoles of the annealed oligonucleotides and 10 µg of the nuclear extracts in 10 mM Tris-HCl (pH 7.5), 60 mM potassium chloride, 2.5 mM magnesium chloride, 1 mM EDTA, 1 mM DTT, 750 ng of poly (dIdC) and 7% glycerol. Oligonucleotides were incubated with the nuclear extract for 30 min at 25 °C. In competitor assays, unlabeled competitor oligonucleotides in 50-fold molar excess to the labeled oligonucleotides were added to the reaction before addition of the probe. For supershift assays, 2 µg of the antibody was added to each reaction. FOXA1 (sc-9186x), FOXA2 (sc-9187x) and IgG (sc-2028) antibodies were obtained from Santa Cruz Biotechnology (Santa Cruz, CA). DNA-protein complexes were electrophoresed on 6% polyacrylamide Novex DNA Retardation Gels (Invitrogen) in 0.5 × TBE running buffer (45 mM Tris-borate and 1 mM EDTA, pH 8.3) and then scanned with fluorescent image analyzer FLA-5100 (Fujifilm, Valhalla, NY) at 473 nm with the LPB filter.
3. Results
3.1 Identification of an enhancer upstream of ADH4
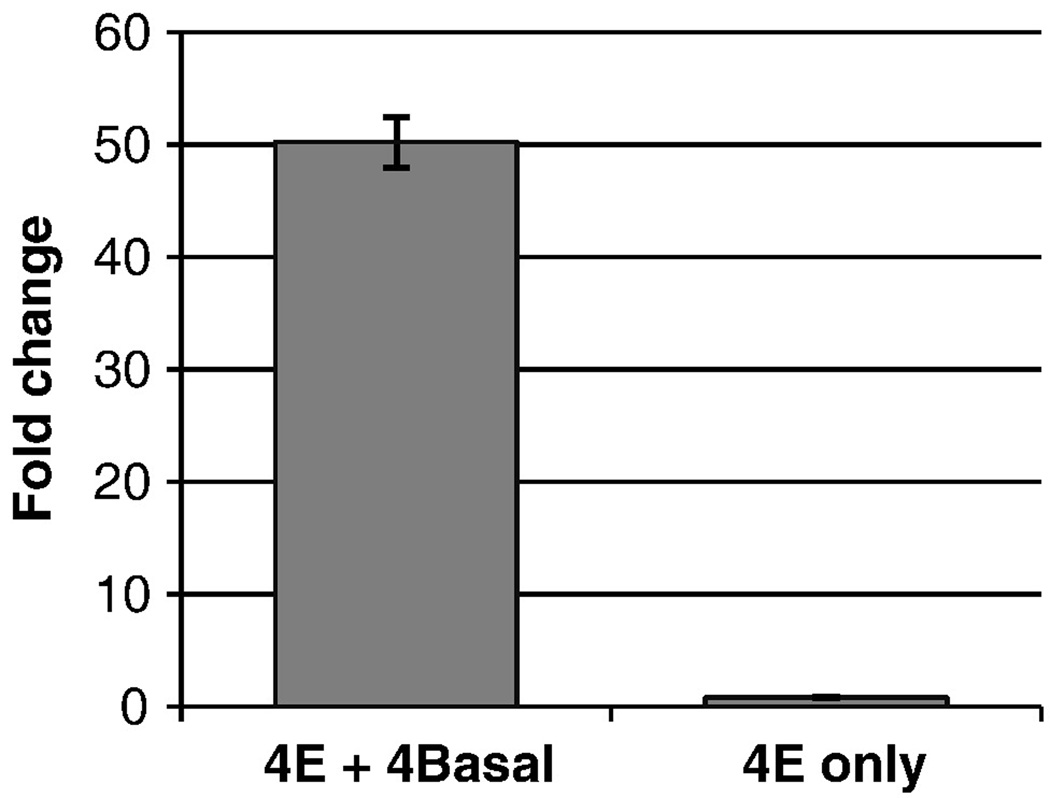
To identify distant regulatory elements that affect expression of the ADH4 gene, we took a comparative genomics approach. Using the UCSC Conservation track (Felsenstein and Churchill, 1996; Siepel et al., 2005; Yang, 1995), we identified conserved sequences in the intergenic regions between ADH4 and its flanking genes ADH5 and ADH6. We tested the effects of conserved regions on the activity of the ADH4 Basal promoter (4Basal) by transient transfection assays in HepG2 human hepatoma cells (data not shown). We identified a 1504 bp conserved region (4E), 13 kb upstream of the ADH4 translation start site (Figure 1B), that had significant effect on ADH4 promoter activity. Fragment 4E caused a 50-fold increase in activity (p = 6 × 10⁻¹⁵; Figure 2). In the absence of the promoter, the 4E fragment had weak activity, only 80% of the activity of the 4Basal promoter (p = 9 × 10⁻⁴; Figure 2)
Figure 2. 4E enhances the activity of the ADH4 promoter.
Test plasmids with only the promoter (4 Basal), 4E upstream of the promoter (4E+4 Basal) and 4E in the absence of any promoter (4E only) were transiently transfected into HepG2 cells (n = 16). Promoter activity was determined as luciferase activity normalized to the internal control β-galactosidase. Fold change was calculated as ratio of the promoter activity of each construct to the promoter activity of 4 Basal; bars indicate the standard errors of the mean.
To determine if the enhancer activity acts specifically on the ADH4 promoter, we tested it in combination with two heterologous promoters. 4E increased the activity of another ADH promoter, the ADH1B basal promoter (1Basal), by 180-fold (p = 2 × 10⁻¹²) in HepG2 cells. It increased the activity of SV40 promoter (SV40Basal) by 56-fold (p = 8 × 10⁻¹⁰).
Cell specificity of 4E was tested in H1299 cells, a lung carcinoma cell line. Of the seven ADHs, only ADH1B is known to be expressed in lungs (Smith et al., 1971), although data from our lab suggests that neither ADH1B nor ADH4 are expressed in these cells. However, the transfected minimal promoters of both ADH4 and ADH1B did show activity above the vector-only background. Therefore, we tested the enhancer activity of 4E upstream of ADH4, ADH1B and SV40 promoters. No enhancer activity was detected with any of the three promoters (Table 2). These results suggest that 4E shows cellular specificity.
Table 2. Liver–specific activity of 4E.
4E was subcloned upstream of ADH4, ADH1B, and SV-40 promoters and activity of each construct was normalized to the activity of the respective promoter to obtain the fold change (mean ± Std error). Hepatoma cells (HepG2) were compared to lung carcinoma cells (H1299).
| Promoter | Fold change in hepatoma cells (mean ± Std error) |
Fold change in lung cells (mean ± Std error) |
|---|---|---|
| ADH4 | 50 ± 2.2 * | 0.64 ± 0.1 * |
| ADH1B | 180 ± 5.3 * | 0.97 ± 0.2 |
| SV-40 | 56 ± 2.9 * | 0.80 ± 0.1 * |
means p-value ≤ 0.05
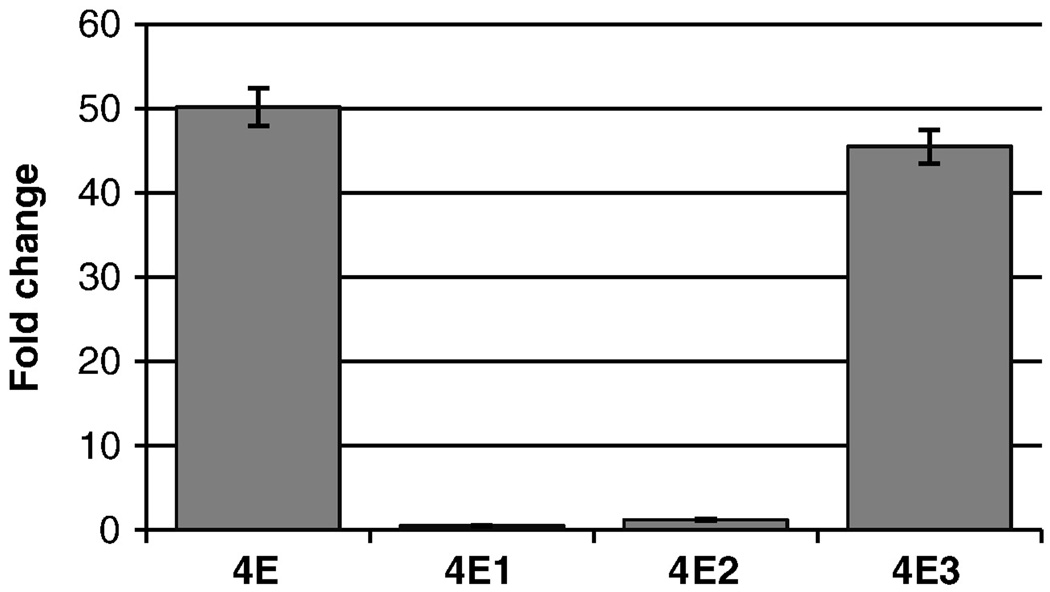
To localize functional elements within the 1504 bp region, this region was subdivided into three fragments, 4E1, 4E2 and 4E3 (Figure 1C). The enhancer effect of 4E was contained within the 4E3 fragment, which enhanced the activity of 4Basal by 46-fold (p=5 × 10⁻¹⁵) (Figure 3). 4E1 repressed the activity of 4Basal by 50% (p < 0.001), whereas 4E2 increased the activity by 1.2-fold (p = 0.05). As the activity of 4E3 was not different from the parent fragment 4E (p =0.13), we focused on the 4E3 fragment for further characterization.
Figure 3. The enhancer function of 4E is located in a 565 bp region.
To identify the minimal region required for the enhancer activity of 4E, subfragments of 4E (Figure 1) were subcloned upstream of ADH4 promoter and tested in transient transfections in HepG2 cells (n = 16). Fold change was calculated as ratio of the promoter activity of each construct to the promoter activity of 4 Basal; bars indicate the standard errors of the mean.
3.2 Identification of potential protein binding sites in the enhancer
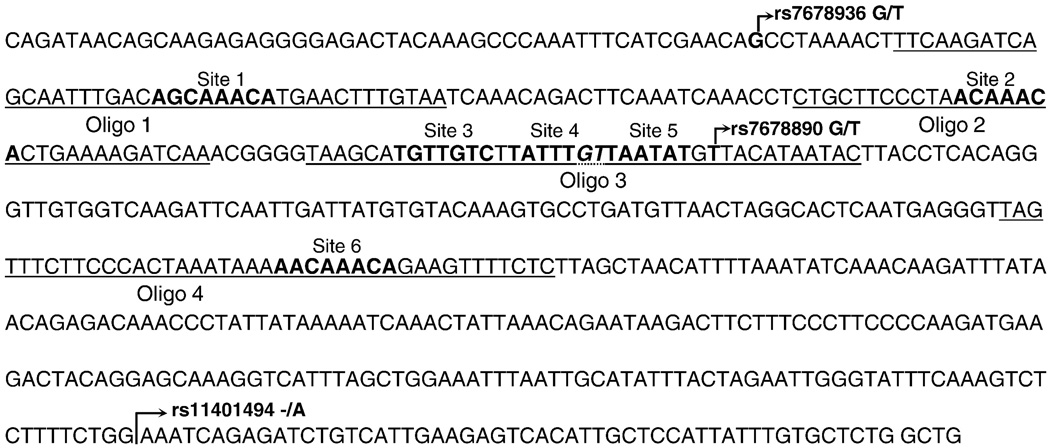
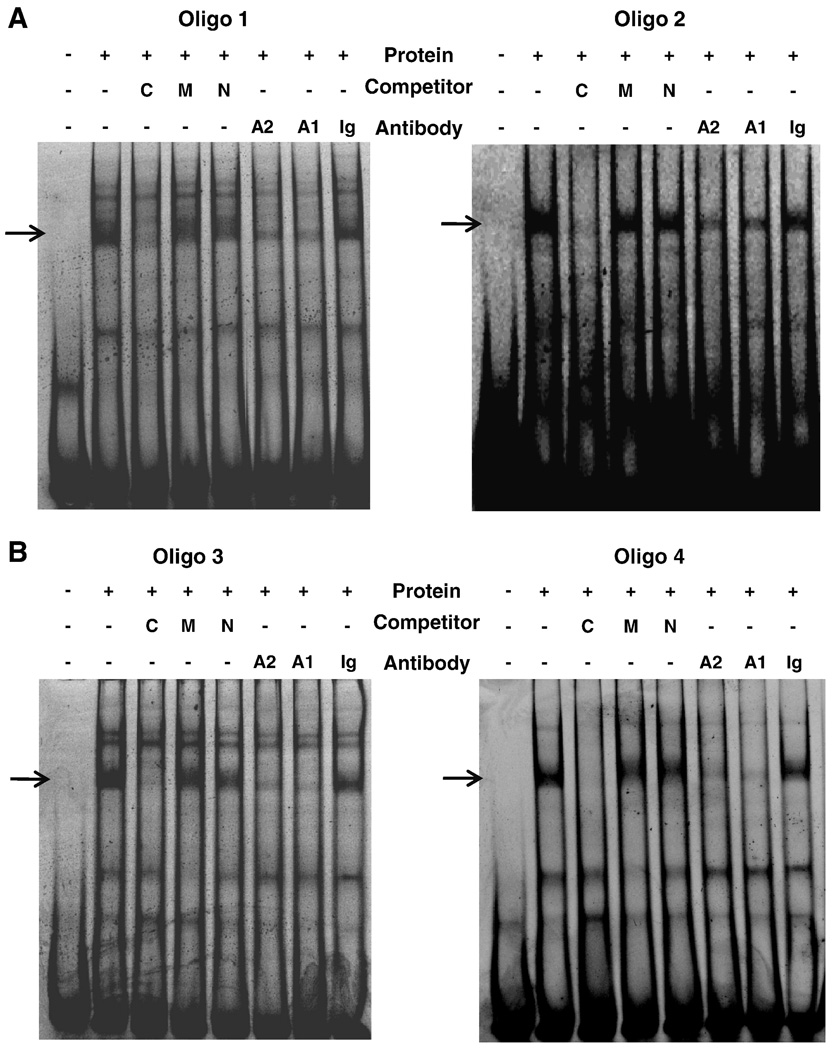
Five potential Forkhead box protein A (FOXA, previously known as hepatocyte nuclear factor 3 (Friedman and Kaestner, 2006) binding sites and one HNF-1A binding site (Figure 4) were identified using transcription factor prediction software Promo (Farre et al., 2003; Messeguer et al., 2002). Oligonucleotides were synthesized to cover these potential FOXA binding sites (Table 1c) and tested in EMSA with HepG2 nuclear extract. With all four oligonucleotides, at least two retarded DNA-protein complexes were observed (Figure 5). A non-specific competitor oligonucleotide had no effect on any of the complexes (Figure 5). Competition experiments with unlabeled FOXA consensus oligonucleotide (Smith and Humphries, 2009) disrupted the strong, high molecular weight complex. On the other hand, the complex was intact when a mutated FOXA consensus oligonucleotide was added, confirming that it is a FOXA-specific complex. The FOXA-specific complex was also perturbed in supershift assays with FOXA1 and FOXA2 antibodies, while it was unaffected with control IgG antibody (Figure 5).
Figure 4. The genomic sequence of the 4E3 region.
Six potential transcription factor binding sites, identified using Promo (Messeguer et al., 2002), are shown in bold along with the site name above the sequence. Two nucleotides shared by sites 4 and 5 are shown in italics. Oligonucleotides used in EMSA are underlined. Known variations within the sequence are represented with an arrow.
Figure 5. FOXA proteins bind to putative sites in 4E3.
Electrophoretic mobility shift assays were carried out with 5’FAM labeled oligonucleotides of interest and 10 µg of HepG2 nuclear extract. Competition experiments were carried out in the presence of 50-fold molar excess of either a FOXA consensus (C), FOXA consensus mutant (M), or a non-specific (N) oligonucleotide. In supershift assays, 2 µg of either FOXA2 antibody (A2), FOXA1 antibody (A1) or goat IgG (Ig) antibody were added. (A) Gel shifts with Oligos 1 and 2 that span sites 1 and 2, respectively, are shown. (B) Gel shifts in which Oligo 3 (sites 3, 4, and 5) and Oligo 4 (site 6) were used as probes are shown. FOXA specific bands are indicated by arrows, other bands were non-specific.
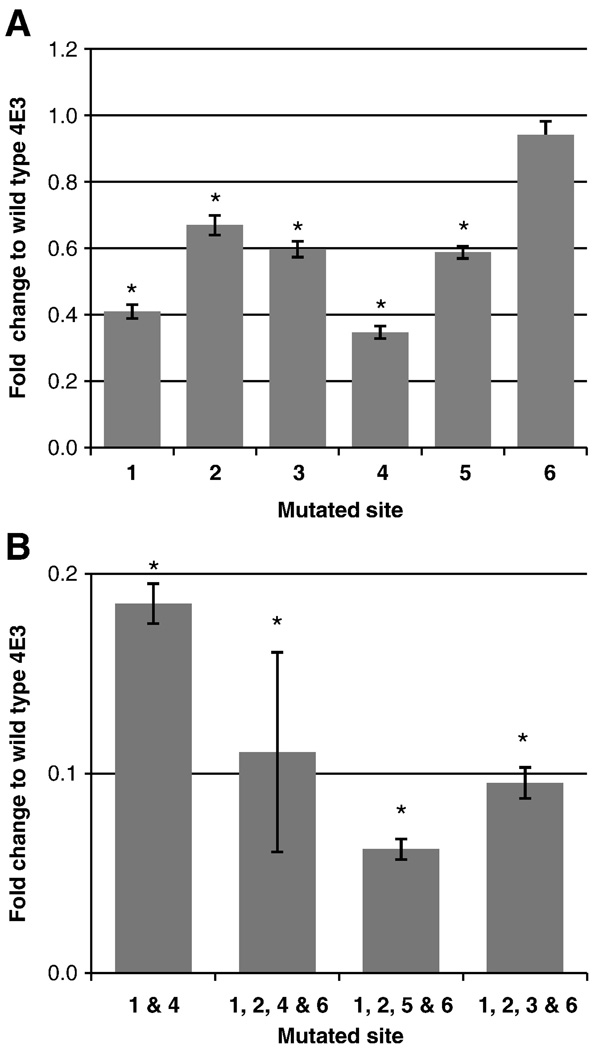
To test the functional role of the putative FOXA sites in the 4E3 region, we mutated each of these sites and tested them in transient transfections in HepG2 cells. Mutation of sites 1 and 4 decreased the activity by 60% and 65%, respectively (Figure 6), whereas mutations at sites 2, 3, and 5 reduced the activity at least by 40%. Disruption of site 6 did not have a significant effect. To test the function of these sites in a combinatorial fashion, we mutated multiple sites. A double mutant of sites 1 and 4 lost most of the activity, exhibiting only 0.2-fold of the wild type enhancer. The activity was further decreased to 0.1-fold when multiple sites were mutated in conjunction with site 1 (Figure 6).
Figure 6. Effects of site directed mutations on enhancer function.
Potential FOXA and HNF-1α sites were mutated in 4E3 and tested in transient transfections in HepG2 cells (n = 16). Fold change was calculated as ratio of the enhancer activity of each mutant construct to the wild type; bars indicate the standard errors of the mean. (A) Activity of single site mutants. (B) Activity of double or multiple site mutants. * indicates p-value ≤ 1.5 × 10⁻¹⁵
3.3 Effects of natural variations on enhancer activity
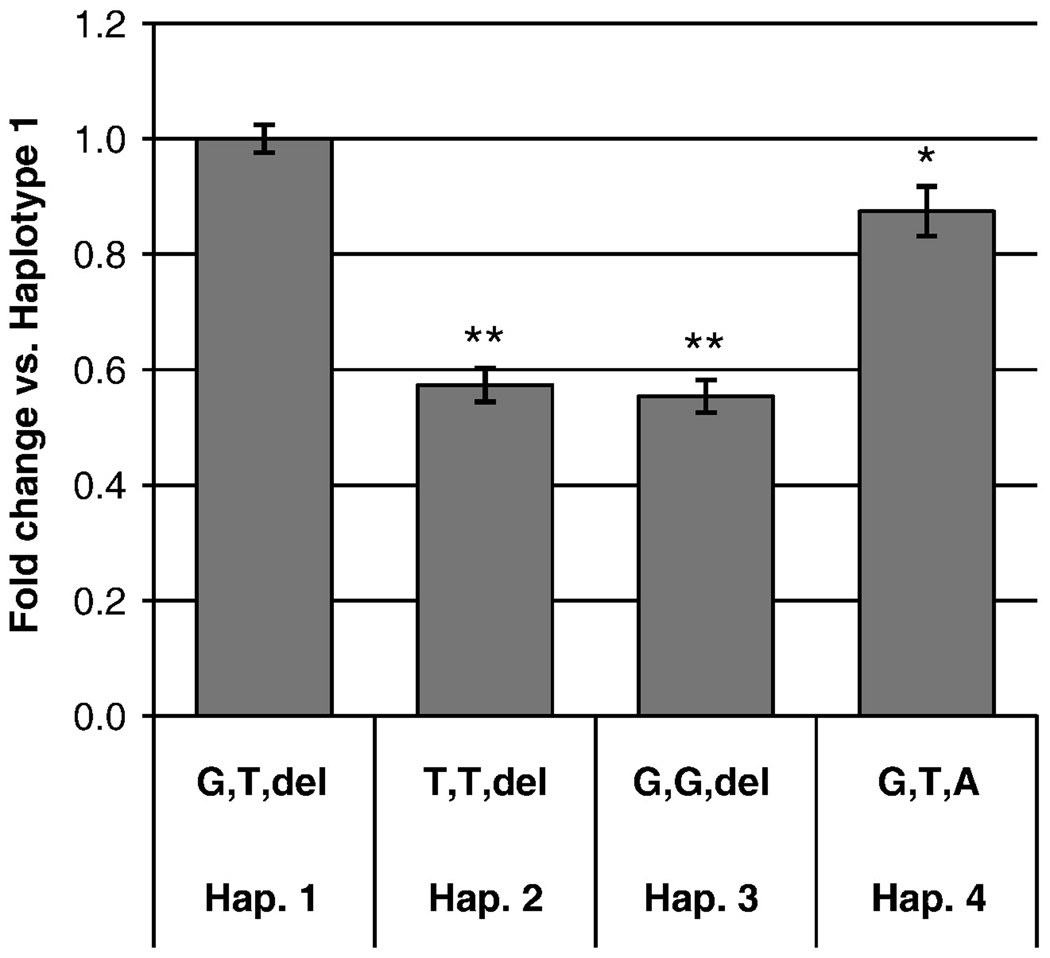
There are three known SNPs in the 4E3 enhancer region (NCBI dbSNP Build 130). The genotype and allele frequencies of two SNPs are shown in Table 3; frequencies for the third SNP are unavailable. In transient transfections, we tested four different haplotypes of 4E3 cloned upstream of the ADH4 promoter. We normalized the activity of all haplotypes to the most common haplotype in all populations: rs7678936 G, rs7678890 T, and rs11401494 del, which we denote as haplotype 1. The activity of haplotype 2 (T, T, del) was only 60% that of the haplotype 1. Haplotype 3 (G, G, del) displayed a similar decrease in activity. Insertion of A at position −13,058 (Haplotype 4: G, T, A) had a very small effect (0.9-fold change relative to the haplotype 1, p =0.02; Figure 7).
Table 3. Allele and genotype frequencies of SNPs in 4E3 region.
Allele and genotype frequencies in different populations for the two SNPs in the 4E3 enhancer region were obtained from HapMap (hapmap.ncbi.nlm.nih.gov). Data for third SNP is not available. Represented populations are Utah residents with ancestry from northern and western Europe (CEU), Han Chinese in Beijing, China (CHB), Japanese in Tokyo, Japan (JPT) and Yoruba in Ibadan, Nigeria (YRI).
| rs7678936 | rs7678890 | |||||||||
|---|---|---|---|---|---|---|---|---|---|---|
| Allele | Genotype | Allele | Genotype | |||||||
| HapMap Population |
T | G | T/T | T/G | G/G | T | G | T/T | T/G | G/G |
| CEU | .05 | 0.95 | 0.10 | 0.90 | 0.95 | 0.05 | 0.90 | 0.10 | ||
| CHB | 1 | 1 | 1 | 1 | ||||||
| JPT | 1 | 1 | 1 | 1 | ||||||
| YRI | 0.33 | 0.67 | 0.12 | 0.43 | 0.45 | 0.67 | 0.33 | 0.45 | 0.43 | 0.12 |
Figure 7. Effects of polymorphisms on enhancer function.
Four different haplotypes of the 4E3 region were tested in transient transfections in HepG2 cells (n=20). Alleles of rs7678936, rs7678890 and rs11401494, respectively are shown on the x-axis. The error bars indicate standard errors of the mean. The promoter activity of each haplotype was normalized to the promoter activity of Haplotype 1 (G,T,-). * p= 0.02; ** p ≤ 8 × 10⁻¹³
4. Discussion
The levels of alcohol metabolizing enzymes could determine the rate of alcohol metabolism, which in turn plays an important role in the susceptibility to alcohol dependence. To understand the transcriptional regulation of the human ADH genes, we sought to identify distal regulatory elements in the ADH cluster. In this study we discovered a strong enhancer, 4E3, between the ADH4 and ADH6 genes. 4E3, located 13 kb upstream of the ADH4 translational start site, increased the activity of its cognate ADH4 promoter 50-fold in a human hepatoma cell line (HepG2). It also enhanced the activity of another strong promoter, SV40 promoter, 56-fold. The weakest promoter tested, ADH1B, was enhanced 180-fold. Because it functions on these heterologous promoters, we believe that in the absence of intervening boundary elements this enhancer would also act on the ADH6 promoter 60 kb away. The 4E3 enhancer was not functional in a non-hepatic cell line, H1299 lung carcinoma cells, suggesting that it has cell-type specificity.
Six putative transcription factor sites were identified by sequence homology, and their roles were tested by EMSA and site directed mutagenesis. FOXA and HNF-1α proteins are liver-enriched factors that regulate many liver-specific genes (Schrem et al., 2002). FOXA family members FOXA1, FOXA2 and FOXA3 share a highly conserved forkhead DNA binding domain and play essential roles during development and in adult animals (Friedman and Kaestner, 2006). HNF-1α is a homeodomain containing protein that regulates expression of several genes in liver, pancreatic islets and kidneys (Armendariz and Krauss, 2009). Sites 1, 2, 3, 4, and 6 were confirmed to be FOXA binding sites by EMSA with competitor oligonucleotides and by supershift assays. Site 5, which overlaps with the site 4 by two nucleotides, was predicted to be a HNF-1α site. Oligo 3, which spans sites 3, 4, and 5, produced multiple high molecular weight bands, but the FOXA specific complex was the most prominent. While none of the bands were disrupted by HNF-1α competitor, a stronger FOXA specific complex was detected (data not shown). We speculate that HNF-1 binds weakly to site 5 and this binding interferes with the binding of FOXA to the overlapping site 4.
Site-directed mutagenesis studies showed the greatest effect on enhancer function when either site 1 or site 4 was mutated, with activity decreasing to 40% of the wild type. Mutating multiple sites affected activity more dramatically. When sites 1, 2, 4 and 6 were mutated, activity decreased to 10% of the wild type. All combinations of multiple mutants tested displayed approximately a multiplicative reduction in activity compared to the respective single mutants, suggesting that each site is acting independently.
Several mechanisms have been proposed for the action of activator proteins. Activator proteins can bind an enhancer and function as nucleation centers for preinitiation transcription complex or they can interact with the general transcriptional factors at the cognate promoter and stabilize the transcription complex. Alternatively, they can recruit chromatin modifying regulators, open chromatin and thus promote transcription. FOXA proteins belong to a unique class of transcription factors that function as pioneer factors, proteins that can bind highly compacted chromatin and alter the chromatin structure and enhance transcription (Zaret et al., 2008). During development FOXA proteins have shown to bind the enhancer of the albumin gene and open the chromatin (Chaya et al., 2001; Cirillo et al., 2002). FOXA1 has also been shown to act as pioneer factor in adult tissues (Carroll et al., 2005; Gao et al., 2003; Zhang et al., 2005). It is possible that FOXA and HNF-1α proteins are acting at the ADH4 enhancer through any one or a combination of these mechanisms.
Multiple variations in genes encoding alcohol dehydrogenases have been associated with the risk for alcoholism (Birley et al., 2009; Edenberg, 2007; Edenberg et al., 2006). Although the most widely-studied of these variations affect the sequence of the encoded enzymes, one (rs1800759) is known to affect regulation of gene expression (Edenberg et al., 1999). The expression level of ADH enzymes could affect the flux through the alcohol metabolic pathway, and thereby influence the effects of alcohol and the risk for alcoholism. We studied three SNPs in this region, rs7678936 (G/T), rs7678890 (T/G) and rs11401494 (del/T). They are not present in any of the transcription factor binding sites identified in this study. However, rs7678936 is adjacent to a putative FOXA site that was not tested and rs7678890 is adjacent to site 5 (HNF-1α). To explore the contribution of each SNP, we tested three haplotypes. Haplotype 2 (T, T, del) and haplotype 3 (G, G, del) had a similar fold change (0.6-fold) relative to Hap.1 (G, T, del), so we were unable to attribute the effect to a single SNP. rs11401494 had a small effect on the function of the enhancer.
In this study we have identified a strong distal enhancer of ADH4 that displays some cell specificity. Undoubtedly, transient transfection assays cannot duplicate the regulatory complexity present in vivo, including additional cis-regulatory regions and complexity of chromatin structure. However, in the genome-wide mapping of DNase I hypersensitive sites in HepG2 cells, a hypersensitive peak was detected across the region of five transcription factor binding sites that we characterized in this enhancer (UCSC Open chromatin track; (Boyle et al., 2008). This suggests that the site we identified is occupied by transcription factors and functional in vivo; whether this enhancer is sufficient to drive the expression of ADH4 remains to be tested. Our haplotype studies indicate that variations in this region will contribute to differences in ADH4 expression. It would be of interest to study if these variations will contribute to differential susceptibility to alcoholism.
Acknowledgments
We thank Ronald E. Jerome and Jun Wang for technical assistance. This work was supported by grant R37AA006460 from the National Institute of Alcohol Abuse and Alcoholism, NIH.
Abbreviations
- ADH
alcohol dehydrogenase
- EMSA
electrophoretic mobility shift assay
- PCR
polymerase chain reaction
- SNP
single nucleotide polymorphism
- 4Basal
ADH4 basal promoter
- 1Basal
ADH1B basal promoter
- SV40Basal
SV40 promoter
Footnotes
Publisher's Disclaimer: This is a PDF file of an unedited manuscript that has been accepted for publication. As a service to our customers we are providing this early version of the manuscript. The manuscript will undergo copyediting, typesetting, and review of the resulting proof before it is published in its final citable form. Please note that during the production process errors may be discovered which could affect the content, and all legal disclaimers that apply to the journal pertain.
References
- Armendariz AD, Krauss RM. Hepatic nuclear factor 1-alpha: inflammation, genetics, and atherosclerosis. Curr. Opin. Lipidol. 2009;20:106–111. doi: 10.1097/mol.0b013e3283295ee9. [DOI] [PubMed] [Google Scholar]
- Birley AJ, James MR, Dickson PA, Montgomery GW, Heath AC, Martin NG, Whitfield JB. ADH single nucleotide polymorphism associations with alcohol metabolism in vivo. Hum. Mol. Genet. 2009;18:1533–1542. doi: 10.1093/hmg/ddp060. [DOI] [PMC free article] [PubMed] [Google Scholar]
- Boyle AP, Davis S, Shulha HP, Meltzer P, Margulies EH, Weng Z, Furey TS, Crawford GE. High-resolution mapping and characterization of open chromatin across the genome. Cell. 2008;132:311–322. doi: 10.1016/j.cell.2007.12.014. [DOI] [PMC free article] [PubMed] [Google Scholar]
- Cargiulo T. Understanding the health impact of alcohol dependence. Am. J. Health. Syst. Pharm. 2007;64:S5–S11. doi: 10.2146/ajhp060647. [DOI] [PubMed] [Google Scholar]
- Carroll JS, Liu XS, Brodsky AS, Li W, Meyer CA, Szary AJ, Eeckhoute J, Shao W, Hestermann EV, Geistlinger TR, Fox EA, Silver PA, Brown M. Chromosome-wide mapping of estrogen receptor binding reveals long-range regulation requiring the forkhead protein FoxA1. Cell. 2005;122:33–43. doi: 10.1016/j.cell.2005.05.008. [DOI] [PubMed] [Google Scholar]
- Chaya D, Hayamizu T, Bustin M, Zaret KS. Transcription factor FoxA (HNF3) on a nucleosome at an enhancer complex in liver chromatin. J. Biol. Chem. 2001;276:44385–44389. doi: 10.1074/jbc.M108214200. [DOI] [PubMed] [Google Scholar]
- Cirillo LA, Lin FR, Cuesta I, Friedman D, Jarnik M, Zaret KS. Opening of compacted chromatin by early developmental transcription factors HNF3 (FoxA) and GATA-4. Mol. Cell. 2002;9:279–289. doi: 10.1016/s1097-2765(02)00459-8. [DOI] [PubMed] [Google Scholar]
- Edenberg HJ. Regulation of the mammalian alcohol dehydrogenase genes. Prog. Nucleic Acid Res. Mol. Biol. 2000;64:295–341. doi: 10.1016/s0079-6603(00)64008-4. [DOI] [PubMed] [Google Scholar]
- Edenberg HJ. The genetics of alcohol metabolism: role of alcohol dehydrogenase and aldehyde dehydrogenase variants. Alcohol Res Health. 2007;30:5–13. [PMC free article] [PubMed] [Google Scholar]
- Edenberg HJ, Bosron WF. Alcohol dehydrogenases. Comprehensive Toxicology. 1997:119–131. [Google Scholar]
- Edenberg HJ, Foroud T. The genetics of alcoholism: identifying specific genes through family studies. Addict Biol. 2006;11:386–396. doi: 10.1111/j.1369-1600.2006.00035.x. [DOI] [PubMed] [Google Scholar]
- Edenberg HJ, Jerome RE, Li M. Polymorphism of the human alcohol dehydrogenase 4 (ADH4) promoter affects gene expression. Pharmacogenetics. 1999;9:25–30. doi: 10.1097/00008571-199902000-00004. [DOI] [PubMed] [Google Scholar]
- Edenberg HJ, Xuei X, Chen HJ, Tian H, Wetherill LF, Dick DM, Almasy L, Bierut L, Bucholz KK, Goate A, Hesselbrock V, Kuperman S, Nurnberger J, Porjesz B, Rice J, Schuckit M, Tischfield J, Begleiter H, Foroud T. Association of alcohol dehydrogenase genes with alcohol dependence: a comprehensive analysis. Hum. Mol. Genet. 2006;15:1539–1549. doi: 10.1093/hmg/ddl073. [DOI] [PubMed] [Google Scholar]
- Farre D, Roset R, Huerta M, Adsuara JE, Rosello L, Alba MM, Messeguer X. Identification of patterns in biological sequences at the ALGGEN server: PROMO and MALGEN. Nucleic Acids Res. 2003;31:3651–3653. doi: 10.1093/nar/gkg605. [DOI] [PMC free article] [PubMed] [Google Scholar]
- Felsenstein J, Churchill GA. A Hidden Markov Model approach to variation among sites in rate of evolution. Mol. Biol. Evol. 1996;13:93–104. doi: 10.1093/oxfordjournals.molbev.a025575. [DOI] [PubMed] [Google Scholar]
- Friedman JR, Kaestner KH. The Foxa family of transcription factors in development and metabolism. Cell. Mol. Life Sci. 2006;63:2317–2328. doi: 10.1007/s00018-006-6095-6. [DOI] [PMC free article] [PubMed] [Google Scholar]
- Gao N, Zhang J, Rao MA, Case TC, Mirosevich J, Wang Y, Jin R, Gupta A, Rennie PS, Matusik RJ. The role of hepatocyte nuclear factor-3 alpha (Forkhead Box A1) and androgen receptor in transcriptional regulation of prostatic genes. Mol. Endocrinol. 2003;17:1484–1507. doi: 10.1210/me.2003-0020. [DOI] [PubMed] [Google Scholar]
- Guindalini C, Scivoletto S, Ferreira RG, Breen G, Zilberman M, Peluso MA, Zatz M. Association of genetic variants in alcohol dehydrogenase 4 with alcohol dependence in Brazilian patients. Am J Psychiatry. 2005;162:1005–1007. doi: 10.1176/appi.ajp.162.5.1005. [DOI] [PubMed] [Google Scholar]
- Hurley TD, Edenberg HJ, Li T-K. Julio Licinio M-LW, editor. Pharmacogenomics of Alcoholism. Pharmacogenomics. 2003:417–441. (Julio Licinio, M.-L.W.)Julio Licinio, M.-L.W.s) [Google Scholar]
- Kimura Y, Nishimura FT, Abe S, Fukunaga T, Tanii H, Saijoh K. Polymorphisms in the promoter region of the human class II alcohol dehydrogenase (ADH4) gene affect both transcriptional activity and ethanol metabolism in Japanese subjects. J. Toxicol. Sci. 2009;34:89–97. doi: 10.2131/jts.34.89. [DOI] [PubMed] [Google Scholar]
- Li M, Edenberg HJ. Function of cis-acting elements in human alcohol dehydrogenase 4 (ADH4) promoter and role of C/EBP proteins in gene expression. DNA Cell Biol. 1998;17:387–397. doi: 10.1089/dna.1998.17.387. [DOI] [PubMed] [Google Scholar]
- Li TK, Bosron WF, Dafeldecker WP, Lange LG, Vallee BL. Isolation of pi-alcohol dehydrogenase of human liver: is it a determinant of alcoholism? Proc. Natl. Acad. Sci. U. S. A. 1977;74:4378–4381. doi: 10.1073/pnas.74.10.4378. [DOI] [PMC free article] [PubMed] [Google Scholar]
- Messeguer X, Escudero R, Farre D, Nunez O, Martinez J, Alba MM. PROMO: detection of known transcription regulatory elements using species-tailored searches. Bioinformatics. 2002;18:333–334. doi: 10.1093/bioinformatics/18.2.333. [DOI] [PubMed] [Google Scholar]
- Mokdad AH, Marks JS, Stroup DF, Gerberding JL. Actual causes of death in the United States, 2000. JAMA. 2004;291:1238–1245. doi: 10.1001/jama.291.10.1238. [DOI] [PubMed] [Google Scholar]
- Nordeen SK. Luciferase reporter gene vectors for analysis of promoters and enhancers. Biotechniques. 1988;6:454–458. [PubMed] [Google Scholar]
- Reich T, Edenberg HJ, Goate A, Williams JT, Rice JP, Van Eerdewegh P, Foroud T, Hesselbrock V, Schuckit MA, Bucholz K, Porjesz B, Li TK, Conneally PM, Nurnberger JI, Jr, Tischfield JA, Crowe RR, Cloninger CR, Wu W, Shears S, Carr K, Crose C, Willig C, Begleiter H. Genome-wide search for genes affecting the risk for alcohol dependence. Am. J. Med. Genet. 1998;81:207–215. [PubMed] [Google Scholar]
- Sambrook T, Fritsch EF, Maniatis T. Molecular cloning: A laboratory manual, Second ed. New York, NY: Cold Spring Harbor Laboratory Press; 1989. [Google Scholar]
- Schrem H, Klempnauer J, Borlak J. Liver-enriched transcription factors in liver function and development. Part I: the hepatocyte nuclear factor network and liver-specific gene expression. Pharmacol. Rev. 2002;54:129–158. doi: 10.1124/pr.54.1.129. [DOI] [PubMed] [Google Scholar]
- Siepel A, Bejerano G, Pedersen JS, Hinrichs AS, Hou M, Rosenbloom K, Clawson H, Spieth J, Hillier LW, Richards S, Weinstock GM, Wilson RK, Gibbs RA, Kent WJ, Miller W, Haussler D. Evolutionarily conserved elements in vertebrate, insect, worm, and yeast genomes. Genome Res. 2005;15:1034–1050. doi: 10.1101/gr.3715005. [DOI] [PMC free article] [PubMed] [Google Scholar]
- Smith AJ, Humphries SE. Characterization of DNA-binding proteins using multiplexed competitor EMSA. J. Mol. Biol. 2009;385:714–717. doi: 10.1016/j.jmb.2008.11.035. [DOI] [PubMed] [Google Scholar]
- Smith M, Hopkinson DA, Harris H. Developmental changes and polymorphism in human alcohol dehydrogenase. Annals of human genetics. 1971;34:251–271. doi: 10.1111/j.1469-1809.1971.tb00238.x. [DOI] [PubMed] [Google Scholar]
- Williams JT, Begleiter H, Porjesz B, Edenberg HJ, Foroud T, Reich T, Goate A, Van Eerdewegh P, Almasy L, Blangero J. Joint multipoint linkage analysis of multivariate qualitative and quantitative traits. II. Alcoholism and event-related potentials. Am J Hum Genet. 1999;65:1148–1160. doi: 10.1086/302571. [DOI] [PMC free article] [PubMed] [Google Scholar]
- Yang Z. A space-time process model for the evolution of DNA sequences. Genetics. 1995;139:993–1005. doi: 10.1093/genetics/139.2.993. [DOI] [PMC free article] [PubMed] [Google Scholar]
- Zaret KS, Watts J, Xu J, Wandzioch E, Smale ST, Sekiya T. Pioneer factors, genetic competence, and inductive signaling: programming liver and pancreas progenitors from the endoderm. Cold Spring Harb. Symp. Quant. Biol. 2008;73:119–126. doi: 10.1101/sqb.2008.73.040. [DOI] [PMC free article] [PubMed] [Google Scholar]
- Zhang L, Rubins NE, Ahima RS, Greenbaum LE, Kaestner KH. Foxa2 integrates the transcriptional response of the hepatocyte to fasting. Cell Metab. 2005;2:141–148. doi: 10.1016/j.cmet.2005.07.002. [DOI] [PubMed] [Google Scholar]


