

Abstract
Background
The steps necessary to translate promising new biological therapies to the clinic are poorly documented. For gene therapy there are unique aspects that need to be addressed in biodistribution studies. Notably, spread of the vector beyond the intended target cells or tissue may result in persistent unwanted biological activity or unpredictable biological events, thus it is critical to evaluate risks associated with viral vector-mediated gene transfer prior to embarking on human clinical trials.
Methods
Here we present a rodent study comprising of a comprehensive assessment of vector biodistribution through the brain, blood and major organs of rats injected into the subthalamic nucleus with recombinant adeno-associated virus (AAV) expressing glutamic acid decarboxylase (GAD). In addition, behavioral and histological analyses were also performed.
Results
AAV genomes were not detected in blood or CSF, and did not disseminate to organs outside of the brain in the majority of animals. In the brain, an average 97.3% of AAV2-GAD genomes were restricted to the area of the ipsilateral STN. There were no discernable effects of AAV2-GAD on general health and behavioral assessment of the animals did not reveal any alteration in general behavior, exploration, locomotion or motor symmetry.
Conclusions
This study met FDA requirements, in addition to efficacy and toxicity studies in rodents and non-human primates, to support and supplement a Phase II clinical trial for gene transfer of AAV2-GAD to the human STN for the potential therapy of Parkinson’s disease.
Keywords: adeno-associated virus, gene therapy, glutamic acid decarboxylase, Parkinson’s, subthalamic nucleus, biodistribution
INTRODUCTION
The pathology of Parkinson’s disease is characterized by the degeneration of dopaminergic neurons in the substantia nigra pars compacta (SNc). One of the consequences of loss of dopaminergic neurons in the SNc is a decreased activity of the external segment of the globus pallidus (GPe) which normally controls the subthalamic nucleus (STN) through inhibitory GABAergic tone. In Parkinson’s, the disinhibition of the subthalamic nucleus results in overexcitation of the output nuclei of the basal ganglia. This dysregulation of the neural circuitry within the basal ganglia causes excessive inhibition of the thalamic projection to the motor cortex, leading to the classic Parkinson’s symptoms including tremor, muscular rigidity, bradykinesia and postural instability.
Gene therapy strategies for Parkinson’s disease have included gene transfer of neurotrophic factors, such as GDNF and neurturin, into the striatum as a restorative and regenerative approach [1,2,3], and dopaminergic enzymatic replacement including delivery of aromatic amino acid decarboxylase, the enzyme that converts L-dopa into dopamine [4,5].
An alternative therapeutic approach is to readjust the activity of the basal ganglia output nuclei by increasing the GABAergic tone in the STN therefore restoring its activity back towards normal levels. GABA is synthesized from glutamate by two isoforms of glutamic acid decarboxylase: GAD65 and GAD67. Experimental studies have shown a beneficial effect of gene transfer in an animal model of Parkinson’s disease, the 6-OHDA lesion model. Rats lesioned with 6-OHDA following AAV-mediated gene transfer of GAD65 into the rat STN show increased GABA release in the SNr and a behavioral improvement of approximately 65% compared to controls [6]. Similarly, MPTP-treated rhesus monkeys infused intrasubthalamically with of a 1:1 mix of AAV serotype 2 vectors expressing GAD65 and GAD67 (termed AAV2-GAD) exhibit a modest decrease in behavioral symptoms and increased glucose utilization in the right motor cortex relative to controls [7].
An open label Phase I clinical trial of unilateral subthalamic AAV2-GAD injection in patients with Parkinson’s disease was completed in August 2006 by Neurologix, Inc. No adverse events related to gene therapy nor immune responses to the AAV capsid or GAD transgenes were observed. Moreover, significant improvements in motor UPDRS scores persisted up to at least 12 months [8]. A Phase II clinical trial proposal by Neurologix, Inc. for AAV2-GAD treatment of Parkinson’s disease was approved by the FDA and the trial commenced in 2009 in the United States.
AAV-mediated gene therapy as such should be considered an irreversible modification to the genomic content of a cell due to its persistence in the form of stable episomes. Studies in animals have shown that AAV-mediated transgene expression in the CNS persists for at least 2 years in rat [9] and 3 years in rhesus monkey [10]. With no observed decrease in expression during these time frames, it is likely that transgene expression may indeed persist for the life of the animal or individual. Collection of data from preclinical studies to assess the spread of AAV genomes and associated transgene expression is of the utmost importance in assessing the risks of gene therapy. Here, we present data describing a comprehensive assessment of biodistribution of AAV2-GAD genomes through the major organs, CSF and blood of male and female rats. In accordance with changing from a unilateral Phase I to bilateral surgery for the Phase II trial, an additional rodent study was performed according to FDA guidelines to provide supporting safety data for bilateral administration.
MATERIALS & METHODS
AAV Vector Preparation
The plasmids AAV/CBA-GAD65-WPRE-BGH and AAV/CBA-GAD67-WPRE-BGH have been described previously [8]. AAV2-GAD was prepared using the same method of production as the clinical vector. Briefly, recombinant AAV vectors were packaged by calcium phosphate transfection into HEK293 cells. For packaging AAV2, the AAV2 helper plasmid pNLrep was combined with the adenovirus helper plasmid (pFΔ6) and either AAV/CBA-GAD65-WPRE-BGH (to package AAV2-GAD65) or AAV/CBA-GAD67-WPRE-BGH (to package AAV2-GAD67). Following transfection, cells were harvested, cell lysates were purified by iodixanol gradient, then the vector was concentrated and dialyzed against 2×PBS/1mM MgCl2. The genomic titers of the stocks were determined by qPCR using a Lightcycler480 System (Roche Applied Science, Indianapolis, IN) following a standard operating procedure (SOP). The titers of AAV2-GAD65 and AAV2-GAD67 were matched at 2.1×10¹¹ vg/ml and equal volumes of each stock were combined to formulate the AAV2-GAD mixed stock.
Experimental Design
Wistar rats (250-300g, Charles River, USA) were housed in groups of 2 at a constant temperature (23°C) and relative humidity (60%) with free access to food and water and a fixed 12hr light/dark cycle. Approvals for all animal experiments were gained from The Ohio State University Institutional Animal Care and Use Committee. The first cohort of rats (n=15 males and n=15 females) were injected unilaterally with AAV2-GAD. The rats were then divided into three groups (n=5 males and 5 females per group) for euthanasia at one of three time points: 1 day, 2 weeks, or 4 weeks after surgery. Two controls (1 male, 1 female) per time point were injected with saline. The tissues, CSF and blood for all rats were assessed for vector biodistribution. The second cohort of rats was injected bilaterally with AAV2-GAD (n=10 males) or saline (n=9 males) and assessed for various behaviors after surgery. All rats were euthanized at 10 weeks post-surgery. Half of the rats were transcardially perfused with 4% paraformaldehyde and their brains processed for histology and immunohistochemistry. The other half were dissected and fresh frozen and their tissues assessed for vector biodistribution by qPCR and qRT-PCR and processed for histology.
Stereotaxic Surgery
Animals were positioned on a stereotactic frame (David Kopf Instruments, Tujunga, CA) under isoflurane anesthesia. A mid-line incision was made through the scalp to expose the skull and a hole was drilled above the area of interest. A disposable stainless steel cannula (Unimed, Switzerland) was connected to a 10 μl Hamilton syringe with polyethylene tubing (Intramedic, Sparks, MD) and slowly lowered into the left subthalamic nucleus (coordinates: anterioposterior –3.8 mm from bregma, +2.4 mm from midline and –8.1 mm below dura). 1 μl of AAV vector was infused using a Micro4 Micro Syringe Pump Controller (World Precision Instruments Inc., Sarasota, FL) at 66 nl/min. At the end of the infusion, the syringe was kept in place for 5 minutes then slowly raised and removed from the brain. For bilateral infusions, an identical injection was also made into the contralateral STN except that the vector was infused on both sides using a PEEK catheter (Medtronic, Minneapolis, MN).
Behavioral Testing
Groups of AAV2-GAD (n=10) and saline (n=9) were used for the following behavioral tests, Cylinder Test. The experimenter was blinded during the testing and data analysis and all testing was videotaped for scoring. The animals were individually placed in a plexiglas cylinder (30 cm diameter, 50 cm height). The number of times the rat made contact with the wall of the cylinder was counted (as left, right or bilateral paw touch) over a 3 minute period. The data was expressed as percent use of the left forelimb, right forelimb and both forelimbs, as well as total number of touches. Open Field (Locomotor Activity). Each rat was placed gently into one quadrant of the field, toward the center of the arena, and allowed to explore the arena for 5 minutes. Rats were videotaped and functional observations related to locomotion were made by a blinded observer. These included assessing the presence of involuntary movements, posture, gait, arousal, stereotypies and abnormal behavior. For scoring of locomotor activity, the TopScan software (Topscan, Clever Systems, Vienna, VA) divided the arena into 6 equal lateral quadrants and a center. The total distance traveled and the total number of quadrants (zones) crossed were counted. Home Cage Activity. The rat was observed in its home cage and scored by a blinded observer for the following behaviors: body position, respiration, clonic involuntary movement, tonic involuntary movement, vocalization and palpebral closure. The rat was then gently removed from its cage and scored for the following observations while being held: reactivity to being picked up, ease of handling, palpebral closure, lacrimation, salivation, piloerection, plus a description of any other behaviors observed such as bite marks, missing nails, gauntness or death. Porsolt’s Forced-Swim Test. The rats were brought into the test room in their home cages and allowed to habituate for two hours. A swim chamber (50 cm height, 30 cm diameter) was filled with water to a depth of 25 cm, at 25°C. A pretest session was performed to expose the rat to inescapable stress. Each rat was placed individually into the swim chamber and left there for 15 minutes, before being taken out, dried off with a towel and placed in a separate cage containing a hot pad until the animals were dry. The water in the swim chamber was replaced between each rat. The following day, the procedure was repeated identically except each rat was placed in the water and videotaped for 3 minutes. The test animals were treated alongside a positive control group of 10 saline-treated rats, which were administered the pro-depressant κ-agonist U-69593 ([5αβ,7α,8β]-N-methyl-N-[7- [1-pyrrolidinyl]-1-oxaspiro[4.5]dec8-yl]-benzenasetamide) (3 mg/kg i.p.) 23, 5 and 1 hour prior to performing the test. These animals had been handled and exposed to the same environments as the test rats. The experimenter that performed the test and analyzed the videotapes was blinded to the animal groups. Quantification of behaviors (immobility, climbing and swimming) was performed by recording the predominant behavior in each 5 second period.
Tissue Processing
Animals were deeply anesthetized with isoflurane and placed in a stereotaxic frame in order to collect CSF. A polyethylene tubing (P20, Intramedic, Sparks, MD) was inserted into the cisterna magna and up to 100 μl of CSF was withdrawn into a syringe then transferred to a 1.7 ml microfuge tube and stored at ≤70°C. The rat was then decapitated by guillotine and blood was collected from the trunk and transferred to a lavender (EDTA containing) vacutainer and stored at ≤ −70°C °C. The organs were dissected such that the tissues least likely to contain AAV genomes were dissected first and those most likely (i.e. brain) were dissected last. Separate dissection tools and storage containers were used for each tissue to minimize cross contamination. The following organs/tissues were harvested in the approximate order stated, then placed in separate containers and stored at ≤ −70°C: testis or ovary, kidney, heart, lung, spleen, liver, spinal cord.
The brains of the unilaterally injected animals, were removed from the skull, cut in half sagittally, then ~2 mm diameter (8mm3) sections of brain were dissected from the following areas: At bregma −1.80 mm, striatum/globus pallidus; at bregma −3.80mm, hippocampus (contra), mediodorsal thalamus (contra), STN (contra), STN (ipsi), cortex; at bregma −5.80 mm, SNr (ipsi); at bregma +5.0 mm, olfactory bulb; at bregma −12.5 mm, cerebellum. The areas dissected are shown in a schematic (Figure 1). Fresh scalpel blades were used to dissect each brain area. Each sample of brain was placed into an individual 1.7 ml microfuge tube and stored at ≤70°C.
Figure 1.

The bilaterally injected animals, were divided into two groups. The first group, n=5 AAV2-GAD and n=4 saline-treated animals, were transcardially perfused with 50 ml saline and 200 ml 4% paraformaldehyde, then the brains were removed from the skull and cryoprotected in sucrose prior to processing for immunohistochemistry and H&E staining. The second group, n=5 AAV2-GAD and n=5 saline-treated animals were euthanized and the non-brain tissues dissected identically to the unilaterally injected animals as described above. The brains were dissected in half along the coronal axis. Half of the brain was taken for H&E staining and from the other half the region containing the STN was dissected for PCR and qRT-PCR. The samples were frozen on dry ice and stored at ≤–70°C. The major organs were carefully removed from the body and a macroscopic examination was performed. Each organ was considered to have unremarkable gross pathology if it met specific criteria such as normal coloring, shape texture and no evidence of lesions or tumors. The organs were then weighed frozen on dry ice and stored at ≤−70°C.
Cryosectioning
Fresh frozen brains were cryosectioned into 20 μm sections. For H&E staining, four regions of the brain were sampled. These regions were located at the following anterior/posterior coordinates (from bregma): +1.0, −1.0, −3.5 (includes subthalamic nucleus injection site); −6.0. Within each region, every 4th section was sampled over a 720 μm area, which totaled 10 sections per brain area and 40 sections in total from each brain. Perfused brains were cryosectioned into 40 μm sections. For H&E staining, four regions of the brain were sampled. These regions were located at the following anterior posterior coordinates (from bregma): +1.0, −1.0, −3.5 and −6.0. Within each region, every 4th section was sampled over a 480 μm area, which totaled 4 sections per brain area and 16 sections in total from each brain. For anti-GAD immunohistochemistry to verify GAD expression, four 40 μm sections sampled over the STN were stained. Every 4th section (one section every 160 μm over the 360 μm span of the STN) was stained with an anti-GAD65 antibody and one section every 160 μm section was stained with an anti-GAD67 antibody.
Anti-GAD Immunohistochemistry
Sections were rinsed in PBS-Triton and treated in 1% H2O2 in 50% methanol to remove endogenous peroxidase. Following three rinses in PBS-Triton, sections were incubated overnight at room temperature with primary antibody (anti-GAD67 1:2000, Chemicon, Temecula, CA; anti-GAD65, 1:2000, Chemicon) diluted in immunobuffer. Sections were washed with PBS-Triton and incubated with biotinylated secondary antibody (1:500, Sigma) for 3 hrs. Sections were then washed with PBS-Triton and treated with ExtrAvidin peroxidase (1:500 dilution; Sigma) for 2 hours before a final wash in PBS and staining with 0.5mg/ml 3′3-diaminobenzidine (DAB, Sigma). Sections were mounted onto poly-L-lysine coated slides, dehydrated in ascending ethanol then immersed in xylene prior to coverslipping with Cytoseal 60 mounting medium (Thermo Fisher Scientific, Waltham, MA). Sections from control animals were compared to those from AAV2-GAD treated animals to determine the level of GAD65 and GAD67 staining in the STN.
H&E Staining
Fresh frozen sections were post-fixed in 4% paraformaldehyde/0.1M phosphate buffer for 10 minutes. Perfused sections were mounted onto poly-L-lysine coated slides and left to dry overnight prior to staining. All sections were then processed together for H&E staining using standard methods. Sections were scored for neuronal damage by a blinded observer using a Zeiss microscope at 100× and 400× magnification. The following markers of cell death/damage were assessed: cytoplasmic vacuolation, pyknotic nuclei and glial infiltration. Any other abnormalities observed were also noted. The scoring system used was as follows: 0 = normal, 1 = very slight (focal damage), 2 = slight (<10% of tissue), moderate (10-40% of tissue), severe (40-100% of damage).
Quantitative PCR for AAV genome detection
An SOP was developed according to FDA guidelines (“Gene Therapy Clinical Trials – Observing Subjects for Delayed Adverse Events”). Rat total DNA was purified from tissues, blood and CSF using the DNeasy Tissue and Blood Kit (Qiagen, Valencia, CA) following instructions provided by the supplier. A plasmid standard curve was generated by dilution of the plasmid AAV/CBA-GAD65-WPRE-BGH in serial 10-fold dilutions in TE from 1×10⁶ copies/μl to 1×100 copies/μl. Five microliters of standard was used per PCR reaction, thus the standard curve ranged from 5×10⁶ to 5×100 copies. The R2 value was consistently ≥0.99. Primers corresponding to the WPRE sequence within the AAV2-GAD65 and AAV2-GAD67 vectors were designed using Primer Express: WPRE forward: 5 ′ ggc tgt tgg gca ctg aca at, WPRE reverse: 5 ′ ccg aag gga cgt agc aga ag. PCR reactions were setup with the PowerSYBR master mix (Applied Biosystems, Foster City, CA) with 5 μl DNA and 200 nM of each primer in a total volume of 50 μl. The primers were evaluated for amplification efficiency, the background signal from saline control rat tissue, and the consistency of replicate wells using the standard thermocycling conditions for the Roche Lightcycler 480 system over 40 cycles. The presence of only one product was confirmed by performing a melt cycle on the Lightcycler.
The assay was firstly developed and validated for control rat tissues, CSF and blood. The controls used were: no DNA control - nuclease free water; negative control - saline-control rat total DNA; spiked control - DNA from tissue, blood and CSF of a saline control rat spiked with 500 copies of AAV plasmid to assess whether PCR inhibitors were present in the sample. Samples were tested in triplicate with the third sample spiked, and the standard curve was performed in duplicate. The NTCs were negative in each run (CP [Crossing Point – threshold at which amplification rises above baseline] ≥40). 400 ng of genomic DNA from saline control rat tissues - testis, ovary, heart, liver, lung, spleen, kidney, spinal cord and multiple areas of the brain (olfactory bulb, cerebellum, hippocampus, cortex, medial dorsal thalamus, striatum/globus pallidus, subthalamic nucleus and substantia nigra) were tested per PCR reaction. As the yield from whole blood and CSF is low, 10 μl of whole blood DNA and CSF DNA were tested per PCR reaction.
There was sometimes low level non-specific signal in control tissues to ~20 copies, therefore the limit of quantitation (LOQ, the lowest number of copies that can be reliably measured) was set at 20 copies in the presence of 0.4 μg of total DNA. This corresponds to 50 copies per 1 μg of total DNA. No significant inhibition of PCR was detected in samples containing 400 ng of total DNA from saline control rat tissue. Samples of total DNA from tissues (16 tissues per animal), CSF and blood from 29 AAV2-GAD and 5 saline-control rats were evaluated for the presence of AAV genomes.
A sample was determined to be negative if the below the limit of quantification (LOQ) and positive if ≥ LOQ. 400 ng of genomic DNA from each tissue was tested. If the amplification from the spiked control was <LOQ, then this sample was considered non-informative (NI) and repeated once.
Quantitative RT-PCR for Transgene Expression
Analysis of transgene expression was performed according to a standard operating procedure. Total RNA was isolated using the RNeasy Lipid Kit (Qiagen, Valencia, CA). cDNA samples were synthesized from 1 μg of RNA, with the Second Strand Synthesis Kit (Invitrogen, Carlsbad, CA) in the presence (+RT) and absence (-RT) of reverse transcriptase. Quantitative PCR was performed using the following primers designed over an intron at the 3′ end of the CBA promoter in the CBA-GAD65-WPRE and CBA-GAD67-WPRE transgene cassettes: CBA for, gct ctg act gac cgc gtt act; CBA rev, aat tct cca aaa tga tga gac a. PCR of an internal control gene, β-actin, was also performed with the following primers: BA for, ctg ccc tgg ctc cta gca c; BArev, ccc tca gga gga gca atg a. Standard curves for both GAD and β-actin were generated by performing 10-fold dilutions of oligonucleotide templates for the GAD and β-actin primers from 2.5×10⁶ to 25 copies. GAD template sequence: gct ctg act gac cgc gtt act ccc aca gct cct ggg caa cgt gct ggt tat tgt gct gtc tca tca ttt tgg caa aga att, β-actin template sequence: ctg ccc tgg ctc cta gca cca tga aga tca aga tca ttg ctc ctc ctg agc g. The LOQ equates to the CP for the lowest standard point of 25 copies. The standard curves were linear over the range of 2.5×10⁷ to 25 copies with R2 values of >0.99 and the slopes of the CBA and β-actin curves were within 10% of each other.
Two microliters of cDNA and 200 nM of each primer and 12.5 μl of PowerSYBR master mix (Applied Biosystems, Foster City, CA) were used per PCR reaction in a total volume of 25 μl. The primers were evaluated for amplification efficiency and the consistency of replicate wells using the standard thermocycling conditions for the Roche Lightcycler 480 system over 45 cycles. The presence of only one product was confirmed by performing a melt cycle on the Lightcycler. In order to validate the assay, tissues from a saline control animal were subjected to qRT-PCR to determine the sensitivity and specificity of the assay. The number of copies of β-actin and GAD mRNA in each sample was determined from a standard curve. The number of copies of GAD mRNA was then divided by the number of copies of β-actin mRNA and multiplied by 100 to determine the relative amount of transgene to β-actin for each sample. AAV2-GAD cDNA (as measured by the CBA primers) was not detected in any tissues. Negative samples spiked with 1×10³ copies of GAD template oligo all yielded ≥7×10² copies, with most close to 1×10³, confirming insignificant inhibition of PCR amplification. β-actin cDNA was detected at appreciable levels in all samples (range from ~3×10⁵ to ~9×10⁶ copies from an equivalent of 50 ng input RNA). β-actin cDNA was minimally detected in controls without reverse transcriptase, with most samples negative and fewer than 130 copies detected in the remainder.
For analysis of test samples, the relative amount of GAD transgene mRNA to β-actin was determined. If the amplification from the spiked control was < LOQ, then this sample was considered non-informative. A sample result was also considered non-informative if the CP value of a - RT control sample yielded a CP value that was within 5 cycles of the corresponding +RT CP value.
RESULTS
Biodistribution of AAV2-GAD genomes
To assess the diffusion of AAV genomes, rats were injected unilaterally into the subthalamic nucleus with 2.1×10⁸ vector genomes (vg) of AAV2-GAD in a volume of 1 microliter. As the rat brain is ~1150 times smaller than the human brain (by weight) we estimate that the dose administered in this study is approximately 7 times higher than the equivalent human dose of 3.5×10¹⁰ vg used in the Phase I trial.
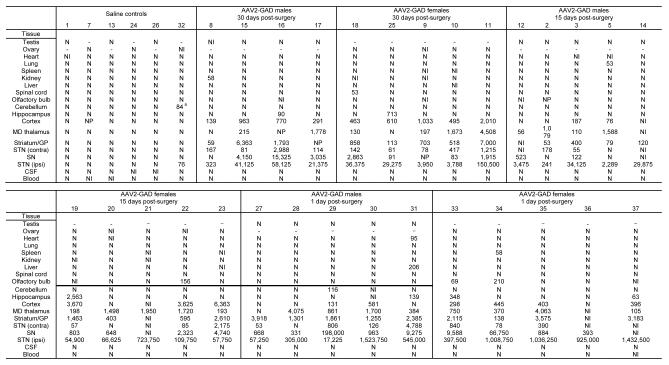
The spread of AAV genomes in the brain and around the body was assessed at 1 day, 2 weeks and 4 weeks post-surgery in 5 males and 5 females per time point. These time points were chosen to cover the time at which the number of AAV genomes are expected to be the highest (day 1), when AAV capsids containing DNA and/or non-stable genomes (ie non-integrated or non-episomal) may still be present, as well as to cover the time at which AAV2-GAD-mediated gene expression peaks (15-30 days). Two saline controls (1 male, 1 female) per time point were also tested. Total DNA was extracted from the major perfused tissues, CSF and blood, and analyzed using quantitative PCR to assess the level of AAV genomes. The brain was further dissected according to a tissue sampling scheme based on coordinated from the rat brain atlas (Paxinos and Watson, Figure 1). The qPCR assay was developed according to FDA guidance documents and validated using control tissues, blood and CSF to determine the sensitivity and specificity, which was ≥50 copies/μg of total DNA. The results are shown in Table 1 and a summary of the results is shown in Table 2.
Table 1.
Biodistribution of AAV genomes following unilateral injection of AAV2-GAD
|
The number at the top of each column refers to the individual animal number.
-, no sample; N, negative (<50 copies/μg total DNA); NI, non informative (unacceptable spike-in); NP, not provided; contra, contralateral to the injection site; CSF, cerebrospinal fluid; GP, globus pallidus; ipsi, ipsilateral to the injection site; MD, medial dorsal; SN, substantia nigra; STN, subthalamic nucleus.
Data are presented as copies/μg total DNA.
Table 2.
Summary of unilateral biodistribution results
| Tissue | Mean # of copies/μg DNA |
% of AAV genomes in the STN |
Proportion of samples testing positive for AAV genomes |
Proportion of samples testing positive for AAV genomes at each time point |
||
|---|---|---|---|---|---|---|
| 4 weeks | 2 weeks |
1 day | ||||
| Testis | N | 0.0000 | 0/14 | 0 | 0 | 0 |
| Ovary | N | 0.0000 | 0/11 | 0 | 0 | 0 |
| Heart | 4 | 0.0012 | 1/26 | 0 | 0 | 1 |
| Lung | 2 | 0.0006 | 1/29 | 1 | 0 | 0 |
| Spleen | 2 | 0.0008 | 1/25 | 0 | 0 | 1 |
| Kidney | 2 | 0.0008 | 1/24 | 1 | 0 | 0 |
| Liver | 7 | 0.0024 | 1/28 | 0 | 0 | 1 |
| Spinal cord | 2 | 0.0006 | 1/29 | 0 | 1 | 0 |
| Olfactory bulb | 19 | 0.0061 | 3/23 | 0 | 1 | 2 |
| Cerebellum | 4 | 0.0014 | 1/28 | 0 | 0 | 1 |
| Hippocampus | 140 | 0.0469 | 5/28 | 0 | 3 | 3 |
| Cortex | 831 | 0.2789 | 20/27 | 6 | 8 | 6 |
| MD thalamus | 1,123 | 0.3632 | 23/26 | 7 | 8 | 8 |
| Striatum/GP | 1,714 | 0.5544 | 25/25 | 8 | 8 | 9 |
| STN (contra) | 621 | 0.2007 | 21/24 | 6 | 8 | 7 |
| SN | 5,228 | 1.6906 | 22/25 | 4 | 9 | 9 |
| STN (ipsi) | 309,236 | 100 | 28/28 | 8 | 10 | 10 |
| CSF | N | 0.0000 | 0/29 | 0 | 0 | 0 |
| Blood | N | 0.0000 | 0/27 | 0 | 0 | 0 |
N, negative; contra, contralateral to the injection site; CSF, cerebrospinal fluid; GP, globus pallidus; ipsi, ipsilateral to the injection site; MD, medial dorsal; SN, substantia nigra; STN, subthalamic nucleus. Data are presented as copies/μg of total DNA.
Most non-brain tissues were negative for AAV genomes (152 out of 158 samples). There were sporadic, very low positive signals in the six positive non-brain tissues at marginally higher than 50 copies of AAV genome/μg of total DNA (copies/μg). In the animals evaluated at the 4-week time point these were animal #5 (53 copies/μg in the lung) and animal #8 (58 copies/μg in the kidney). AAV genomes were detected in the ipsilateral STN of all AAV2-GAD treated animals, verifying that they did receive the vector in the target area of the brain. There were also significant levels of AAV genomes through parts of the basal ganglia, with most rats showing low level positive signal in the SN, (22/25 samples, average 5,228 copies/μg), contralateral STN (21/24 samples, average 621 copies/μg), striatum/globus pallidus (1,714 copies/μg). Although AAV genomes were detected in these brain areas, the relative levels were very low compared to the injection site. In the SN, which had the highest level outside of the injection site, this was still only 1.7% of the average number of genomes measured in the adjacent ipsilateral STN. AAV genomes were also found in the cortex (831 copies/μg), which in the rat is adjacent to the injection site, and the medial dorsal thalamus (1,123 copies/μg).
The cerebellum, hippocampus and olfactory bulbs of all rats in the 4-week group were negative for AAV genomes. At the 1-day and 2-week time points, low level AAV genomes were detected in the hippocampus (3/9 rats and 3/10 rats, respectively; average 140 copies/μg) and olfactory bulb (2/9 and 1/8 rats, respectively; average 19 copies/μg). AAV genomes were also detected in the cerebellum of two rats at 1 day post-surgery.
The Phase II clinical protocol includes a small number of modifications to clinical product manufacturing and administration. These include a change in the purification methodology from heparin affinity chromatography to iodixanol density gradient, a change in the final formulation of the clinical product from 1 × PBS/1 mM MgCl2 to 2 × PBS/1 mM MgCl2, as well as moving from unilateral to bilateral infusion into the STN. To that end, the biodistribution of AAV2-GAD was also assessed in a subset of rats that were injected bilaterally with AAV2-GAD that was produced by the clinical manufacturer using the new purification and formulation methodology. A total of 4.4×10⁸ vg of AAV2-GAD, equivalent to 7-fold higher than the proposed Phase II human dose, were infused bilaterally into the STN of 10 rats. AAV genomes were detected in the STN of all five AAV2-GAD treated animals but were not detected in any of the major organs or blood (Table 3).
Table 3.
Biodistribution of AAV genomes following bilateral injection of AAV2-GAD
| Saline controls | AAV2-GAD | |||||||||
|---|---|---|---|---|---|---|---|---|---|---|
| 3 | 4 | 10 | 19 | 20 | 11 | 12 | 13 | 14 | 17 | |
| Tissue |
||||||||||
| Testis | N | N | N | N | 53.5a | N | N | N | N | N |
| Heart | N | N | N | N | N | N | N | N | NI | N |
| Lung | N | N | N | N | N | N | N | N | N | NI |
| Spleen | N | N | N | N | N | NP | N | NI | NI | N |
| Kidney | N | N | N | N | N | N | N | N | N | N |
| Liver | N | N | N | N | N | N | N | N | N | N |
| Spinal cord |
N | N | N | N | N | N | N | N | NI | N |
| STN (ipsi) |
N | N | N | N | N | 353,750 | 310,000 | 568,750 | 4,100 | 11,362 |
| Blood | N | N | N | N | N | N | N | N | N | N |
The number at the top of each column refers to individual animal number.
N, negative (<50 copies/μg total DNA); NI, non informative (unacceptable spike-in); NP, not provided; ipsi, ipsilateral to the injection site; STN, subthalamic nucleus.
Data are presented as copies/μg of total DNA.
Animals were euthanized 10 weeks following infusion of AAV2-GAD.
Biodistribution of GAD transgene
The relative levels of AAV-mediated GAD transgene expression were measured by qRT-PCR in a subset of brain tissue samples that tested positive for AAV genomes (Table 4). For each brain area, two samples were tested, the one that had the highest level of AAV genomes and the one that had the lowest (note only one sample of cerebellum and hippocampus and olfactory bulb were positive for AAV genomes). GAD transcript was detected at the highest levels in the injected STN, confirming accuracy of the injection and expression of the transgene, but the transcript was absent in the contralateral STN. Appreciable levels of GAD transcript were also detected in the SN, which receives efferent input from the STN and therefore transcript is present in the axon terminals synapsing on SN neurons. A marginal amount of GAD transcript was also detected in one sample cortical tissue and one sample of striatum/GP.
Table 4.
Assessment of transgene expression in tissues positive for AAV2-GAD genomes
| Animal Number/Tissue | AAV genomes | GAD transgene expression |
|---|---|---|
| Unilaterally Injected Animals |
||
| 31 Heart | 95 | ND |
| 5 Lung | 53 | ND |
| 8 Kidney | 58 | ND |
| 34 Spleen | 58 | ND |
| 31 Liver | 206 | ND |
| 18 Spinal cord | 53 | ND |
| 34 Olfactory bulb | 210 | ND |
| 29 Cerebellum | 116 | ND |
| 37 Hippocampus | 63 | ND |
| 5 Cortex | 76 | ND |
| 23 Cortex | 6,363 | 0.0070 |
| 12 MD thalamus | 56 | ND |
| 11 MD thalamus | 4,508 | ND |
| 8 Striatum/GP | 59 | ND |
| 11 Striatum/GP | 7,000 | 0.0003 |
| 19 STN (contra) | 57 | ND |
| 31 STN (contra) | 4,788 | ND |
| 10 SN | 83 | 0.0437 |
| 34 SN | 66,750 | 0.0521 |
| 2 STN (ipsi) | 241 | ND |
| 30 STN (ipsi) |
1,523,750 | 1.2831 |
| Bilaterally Injected Animals |
||
| 11 STN | 353,750 | 16.38 |
| 12 STN | 310,000 | 4.00 |
| 13 STN | 568,750 | 38.80 |
| 14 STN | 4,100 | 39.62 |
| 17 STN | 11,362 | 29.01 |
contra, side of STN contralateral to injection; ipsi, injected STN; AAV2-GAD genome data are presented as number of genomes per μg of total DNA.
GAD transgene expression data are presented as relative GAD transgene expression as a percentage of β-actin expression.
The six non-brain tissues that tested positive for AAV genomes were also tested. In all six samples, the internal control β-actin transcript was detected in the range of 8×10⁵ to 9×10⁶ copies per sample, however primers specific to the GAD transgene did not amplify a product in any of these tissues (Table 4).
General health assessment of bilaterally injected rats
In order to provide additional safety data to support the change from a unilateral to bilateral surgical approach, a comprehensive health assessment was performed twice weekly on rats injected bilaterally with AAV2-GAD. This examination involved assessing the health of the nose, eye, mouth, chin, face, ears, chest, tail and coat, recording whether they appeared normal as well as recording any abnormalities such as wounds, lumps, scabs, bald patches, hunched posture, or noisy breathing. There were no serious adverse events and no changes that could be attributed to injection of AAV2-GAD. All animals gained weight at a steady pace and there was no difference in final weights between saline and AAV2-GAD animals (Figure 2A).
Figure 2.

To assess the health and behavior of the rats in their normal environment, functional observations were made in the home cage and in the open field, according to an SOP. These included assessment of body position, respiration, clonic or tonic involuntary movements, vocalization, palpebral closure, reactivity when held, piloerection, salivation and lacrimation. All animals displayed normal health and behavior when assessed at 3 weeks and 7 weeks post-surgery (data not shown). Locomotor activity was also assessed by measuring the distance traveled and number of zones crossed in the open field over 5 minutes. All animals were active and there were no significant differences between saline control and AAV2-GAD animals (Figure 2B).
Assessment of forelimb function and symmetry
Associated with the intrasubthalamic administration of AAV2-GAD is the possibility of inadvertent disruption of motor symmetry. This can be assessed by measuring forelimb use for weight bearing during vertical exploration in a cylinder [11]. After unilateral injury to the rat motor system, such as lesioning of the nigrostriatal pathway, a chronic change in forelimb preference occurs with avoidance of the impaired forelimb (contralateral to the lesion) and an associated increased use of the non-impaired forelimb [11,6]. No asymmetries or deficits were observed in either group at any of the four time points. Individual animals in the AAV2-GAD and saline treated groups displayed normal forelimb placement, reaching vertically to contact the cylinder wall with both their right and left paws, as well as both paws together (Figure 2D). Both groups displayed decreased exploratory behavior after week 1 (Figure 2E), which we have observed in previous studies (MJD unpublished data) and attribute to habituation, i.e. decreased exploration as the cylinder environment loses its novelty.
Assessment of behavior associated with depression
Individuals with Parkinson’s disease have a higher risk of developing depression [12]. In addition, following deep brain stimulation of the STN, a small percentage of patients have shown an increase in depressive symptoms, sometimes in spite of an improvement in motor function [13]. The majority of patients do not show a worsening of depression, therefore it is unclear if this is related to DBS, however it is of importance to further study the changes in depressive symptoms in patients undergoing DBS. As the changes to the basal ganglia circuitry are similar in AAV2-GAD treated patients, these issues are also relevant to this gene therapy-based treatment. To that end, AAV2-GAD rats were tested in the Porsolt swim test, which is the most commonly used method to test for behavior associated with depression [14]. Increased immobility and decreased swimming and climbing in the Porsolt test have been recognized as behaviors relevant to depression [15]. In order to pharmacologically validate the test, a positive control group treated with a prodepressant, the κ-opioid receptor agonist U-69593, was included to show that the test system is capable of measuring a pro-depressant effect [16]. When tested at 10 weeks post surgery, the positive control group showed increased behavior associated with depression (immobility) compared to the AAV2-GAD and saline-treated controls (p< 0.01 Fishers post hoc test). There were no differences in immobility, swimming or climbing between the saline and AAV2-GAD treated animals (Figure 2C).
Macroscopic and microscopic postmortem analyses
Following euthanasia, major organs of the non-perfused animals were examined macroscopically and weighed. All organs examined appeared normal with no evidence of lesions or tumors. The organs from AAV2-GAD animals were of similar size to saline treated animals and there were no significant differences in relative organ weight between the two groups (Figure 3A).
Figure 3.

Coronal brain sections taken from multiple positions across the dorsal-ventral axis were stained with hematoxylin and eosin and scored for neuronal damage on a scale of 1 to 4 by a blinded observer for the presence of cytoplasmic vacuolation, pyknotic nuclei and glial infiltration. Normal tissue was observed in all brains from AAV2-GAD and saline control animals, except for the presence of gliosis in most of the brains, which was very slight (20-100 μm in diameter, score of 1), and restricted to the needle track (Figure 3B-D). The more severe examples of needle track gliosis in the STN region are shown (Figure 3B-D).
GAD immunostaining was performed on the perfused rat brains to confirm the overexpression of GAD65 and GAD67 in the STN of AAV2-GAD treated rats. A visual comparison of endogenous levels of GAD65 and GAD67 protein in the STN of control rats with that of AAV2-GAD rats showed an increase in cell body staining through the STN in most of the AAV2-GAD animals (Figure 4).
Figure 4.

DISCUSSION
Of particular relevance to the emerging field of gene therapy is the analysis of vector biodistribution through the body, which is critical in assessing the relative risk to benefit ratio of new preclinical therapies. In order to make a determination as to whether the spread of the vector may pose a risk to the patient, the level of genomes should be quantified in major organs as well as other tissues or fluids pertinent to the particular disease, gene therapy vector and transgene and route of administration.
To date there are very few published studies of biodistribution following intraparenchymal injection of AAV [17,18], with only one designed according to FDA guidelines with spiked-in controls [17]. The study design needs to specifically address and provide reliable data on acute and delayed toxicity, as well as potential germline transmission. A time course that spans the peak effect is desirable, with at least one dose that is above the intended clinical dose. It is preferable that a quantitative PCR assay is used for assessment of vector biodistribution and is validated using naïve or saline control tissue prior to assaying the test samples. To that end, we assessed the biodistribution of AAV2-GAD genomes in major perfused organs, spinal cord, blood and CSF of rats injected unilaterally and bilaterally into the STN with approximately 7× the equivalent human dose of AAV2-GAD. AAV genomes were not detected in blood or CSF, and did not disseminate to organs outside of the brain in the majority of animals. Six of the 158 non-brain tissues tested positive for AAV at very low levels (<206 copies/μg). Given that there were no AAV genomes detected in the blood or liver of any animals, and there were two positives in saline-control animal #32, these are likely to be false positive signals, caused by cross-contamination from positive samples during tissue harvesting, or contamination during DNA extraction or PCR.
In the brain, an average 97.3% of AAV genomes were restricted to the area of the ipsilateral STN and 99.7% restricted to regions of the brain with connectivity to the STN (thalamus, globus pallidus, substantia nigra). The STN projects to the substantia nigra and globus pallidus, therefore it is not unexpected for AAV genomes to be present in those regions via anterograde transport [19,20]. In addition, the STN receives inputs from the thalamus therefore the low level AAV in the thalamus (0.36% of signal in STN) is likely due to retrograde transport of AAV [19,20].
GAD transgene expression was detected by qRT-PCR in the ipsilateral STN of unilaterally and bilaterally injected rats, but was not detected outside of the brain nor in the samples containing cerebellum, hippocampus, medial dorsal thalamus or contralateral STN. Both samples of nigral tissue as well as one of the two striatal samples were positive for GAD transgene. This was not unexpected considering that both these brain areas maintain direct connectivity to the STN and furthermore they express GAD65 and GAD67 protein endogenously [21,22,23].
Overexpression of GAD65 and GAD67 protein in the STN of AAV2-GAD treated rats was also confirmed by immunohistochemistry. High numbers of AAV genomes were detected in the STN but no adverse histology was noted aside from normal gliosis in the needle track.
Behavioral assessment of the animals did not reveal any alteration in general behavior, exploration, or locomotion. Whereas the transgene expression in a parkinsonian brain restores GABAergic tone and alleviates motor symptoms [6], no adverse effects on motor function were observed in the non-parkinsonian brain. In rats injected with AAV2-GAD65 in the subthalamic nucleus, stimulation of the STN induces an increased GABA release in the SNr compared to naive animals. In this study, basal levels of GABA measured are identical in saline or AAV2-GAD injected rats [6]. These findings support our results showing no motor effects of AAV injection in a non-parkinsonian brain, and suggest that the level of GAD overexpression would modify the subthalamo-nigral pathway activity only in a pathophysiological state.
We also tested the animals in the Porsolt’s forced-swim test to measure the possible occurrence of depressive-like behavior after AAV2-GAD injection. Psychological changes, and in particular depression occur in up to 25 percent of parkinsonian patients after DBS [24,25]. Similarly, high frequency stimulation of the STN significantly increases immobility time in the Porsolt’s test [26]. Interestingly, the pro-depressant effect of STN stimulation is observed in both naive and parkinsonian rats. This effect is due to distant inhibition of 5-hydroxytryptamine neurons in the midbrain with STN stimulation. Adverse effects of high frequency stimulation are believed to be the consequence of retrograde and anterograde propagation of the stimulation as well as activation of passing fibers. Our gene therapy approach presents a potential advantage over stimulation as it targets precisely the intrinsic STN neurons and spares the surrounding neuronal populations and axonal fibers.
In summary, intrasubthalamic injection of AAV2-GAD at a dose 7-fold higher than the proposed human dose appears safe, with no discernable effects on general health or behavior. No observable changes in motor symmetry as measured by forelimb use during vertical exploration were seen in the unilaterally injected animals, nor were any behaviors associated with depression observed.
It is possible that AAV2-GAD could produce more subtle changes not detectable in preclinical rodent studies, however there were no adverse events related to AAV2-GAD in the Phase I trial, which included full neuropsychological testing. This study provides strong supporting data to complement the ongoing clinical program for AAV2-GAD gene therapy for patients with Parkinson’s disease.
ACKNOWLEDGEMENTS
We thank Michelle Furchner (Neurologix, Inc.) for technical assistance. This work was supported by Neurologix, Inc. HLF and RJB were employees of Neurologix, Inc. when this work was performed. CVS and JLW are employees of Neurologix, Inc. MJD is a consultant for Neurologix, Inc.
REFERENCES
- 1.Kordower JH, Herzog CD, Dass B, et al. Delivery of neurturin by AAV2 (CERE-120)-mediated gene transfer provides structural and functional neuroprotection and neurorestoration in MPTP-treated monkeys. Ann Neurol. 2006;60:706–15. doi: 10.1002/ana.21032. [DOI] [PubMed] [Google Scholar]
- 2.Gasmi M, Herzog CD, Brandon EP, et al. Striatal Delivery of Neurturin by CERE-120, an AAV2 Vector for the Treatment of Dopaminergic Neuron Degeneration in Parkinson’s Disease. Mol Ther. 2007;15:62–8. doi: 10.1038/sj.mt.6300010. [DOI] [PubMed] [Google Scholar]
- 3.Herzog CD, Dass B, Holden JE, et al. Striatal delivery of CERE-120, an AAV2 vector encoding human neurturin, enhances activity of the dopaminergic nigrostriatal system in aged monkeys. Mov Disord. 2007;22:1124–32. doi: 10.1002/mds.21503. [DOI] [PubMed] [Google Scholar]
- 4.Bankiewicz KS, Forsayeth J, Eberling JL, et al. Long-term clinical improvement in MPTP-lesioned primates after gene therapy with AAV-hAADC. Mol Ther. 2006;14:564–70. doi: 10.1016/j.ymthe.2006.05.005. [DOI] [PubMed] [Google Scholar]
- 5.Forsayeth JR, Eberling JL, Sanftner LM, et al. A dose-ranging study of AAV-hAADC therapy in Parkinsonian monkeys. Mol Ther. 2006;14:571–7. doi: 10.1016/j.ymthe.2006.04.008. [DOI] [PMC free article] [PubMed] [Google Scholar]
- 6.Luo J, Kaplitt MG, Fitzsimons HL, et al. Subthalamic GAD gene therapy in a Parkinson’s disease rat model. Science. 2002;298:425–9. doi: 10.1126/science.1074549. [DOI] [PubMed] [Google Scholar]
- 7.Emborg ME, Carbon M, Holden JE, et al. Subthalamic glutamic acid decarboxylase gene therapy: changes in motor function and cortical metabolism. J Cereb Blood Flow Metab. 2007;27:501–9. doi: 10.1038/sj.jcbfm.9600364. [DOI] [PubMed] [Google Scholar]
- 8.Kaplitt MG, Feigin A, Tang C, et al. Safety and tolerability of gene therapy with an adeno-associated virus (AAV) borne GAD gene for Parkinson′s disease. Lancet. 2007;369:2097–2105. doi: 10.1016/S0140-6736(07)60982-9. [DOI] [PubMed] [Google Scholar]
- 9.Klein RL, Hamby ME, Gong Y, et al. Dose and promoter effects of adeno-associated viral vector for green fluorescent protein expression in the rat brain. Exp Neurol. 2002;176:66–74. doi: 10.1006/exnr.2002.7942. [DOI] [PubMed] [Google Scholar]
- 10.Daadi M, Pivirotto P, Bringas P, et al. Distribution of AAV2-hAADC transduced cells after three years in Parkinsonian monkeys. Neuroreport. 2006;17:201–204. doi: 10.1097/01.wnr.0000198952.38563.05. [DOI] [PubMed] [Google Scholar]
- 11.Schallert T, Fleming SM, Leasure JL, Tillerson JL, Bland ST. CNS plasticity and assessment of forelimb sensorimotor outcome in unilateral rat models of stroke, cortical ablation, parkinsonism and spinal cord injury. Neuropharmacology. 2000;39:777–87. doi: 10.1016/s0028-3908(00)00005-8. [DOI] [PubMed] [Google Scholar]
- 12.Edwards E, Kitt C, Oliver E, Finkelstein J, Wagster M, McDonald WM. Depression and Parkinson’s disease: a new look at an old problem. Depress Anxiety. 2002;16:39–48. doi: 10.1002/da.10057. [DOI] [PubMed] [Google Scholar]
- 13.Voon V, Kubu C, Krack P, Houeto JL, Tröster AI. Deep brain stimulation: neuropsychological and neuropsychiatric issues. Mov Disord. 2006;21(Suppl 14):S305–27. doi: 10.1002/mds.20963. [DOI] [PubMed] [Google Scholar]
- 14.Porsolt RD, Lepichon M, Jalfre M. Depression: a new animal model sensitive to antidepressant treatments. Nature. 1997;266:730–73. doi: 10.1038/266730a0. [DOI] [PubMed] [Google Scholar]
- 15.Cryan JF, Valentino RJ, Lucki I. Assessing substrates underlying the behavioral effects of antidepressants using the modified rat forced swimming test. Neurosci. Biobehav. Rev. 2005;29:547–69. doi: 10.1016/j.neubiorev.2005.03.008. [DOI] [PubMed] [Google Scholar]
- 16.Mague SD, Pliakas AM, Todtenkopf MS, et al. Antidepressant-like effects of the k-opioid receptor antagonists in the forced swim test in rats. J. Pharmacol. Exp. Ther. 2003;305:323–30. doi: 10.1124/jpet.102.046433. [DOI] [PubMed] [Google Scholar]
- 17.Cunningham J, Pivirotto P, Bringas J, et al. Biodistribution of adeno associated virus type-2 in nonhuman primates after convection-enhanced delivery to brain. Mol Ther. 2008;16:1267–75. doi: 10.1038/mt.2008.111. [DOI] [PMC free article] [PubMed] [Google Scholar]
- 18.Ciron C, Cressant A, Roux F, et al. Human alpha-iduronidase gene transfer mediated by adeno-associated virus types 1, 2, and 5 in the brain of nonhuman primates: vector diffusion and biodistribution. Hum Gene Ther. 2009;20:350–60. doi: 10.1089/hum.2008.155. [DOI] [PubMed] [Google Scholar]
- 19.Kaspar BK, Erickson D, Schaffer D, Hinh L, Gage FH, Peterson DA. Targeted retrograde gene delivery for neuronal protection. Mol Ther. 2002;5:50–6. doi: 10.1006/mthe.2001.0520. [DOI] [PubMed] [Google Scholar]
- 20.Paterna JC, Feldon J, Büeler H. Transduction profiles of recombinant adeno-associated virus vectors derived from serotypes 2 and 5 in the nigrostriatal system of rats. J Virol. 2004;78:6808–17. doi: 10.1128/JVI.78.13.6808-6817.2004. [DOI] [PMC free article] [PubMed] [Google Scholar]
- 21.Feldblum S, Erlander MG, Tobin AJ. Different distributions of GAD65 and GAD67 mRNAs suggest that the two glutamate decarboxylases play distinctive functional roles. J Neurosci Res. 1993;34:689–706. doi: 10.1002/jnr.490340612. [DOI] [PubMed] [Google Scholar]
- 22.Esclapez M, Tillakaratne NJ, Tobin AJ, Houser CR. Comparative localization of mRNAs encoding two forms of glutamic acid decarboxylase with nonradioactive in situ hybridization methods. J Comp Neurol. 1993;331:339–62. doi: 10.1002/cne.903310305. [DOI] [PubMed] [Google Scholar]
- 23.Esclapez M, Tillakaratne NJ, Kaufman DL, Tobin AJ, Houser CR. Comparative localization of two forms of glutamic acid decarboxylase and their mRNAs in rat brain supports the concept of functional differences between the forms. J Neurosci. 1994;14:1834–55. doi: 10.1523/JNEUROSCI.14-03-01834.1994. [DOI] [PMC free article] [PubMed] [Google Scholar]
- 24.Berney A, Vingerhoets F, Perrin A, et al. Effect on mood of subthalamic DBS for Parkinson’s disease. A consecutive series of 24 patients. Neurology. 2002;59:1427–1429. doi: 10.1212/01.wnl.0000032756.14298.18. [DOI] [PubMed] [Google Scholar]
- 25.Houeto JL, Mesnage V, Mallet L, et al. Behavioural disorders. Parkinson’s disease and subthalamic stimulation. J Neurol Neurosurg Psychiatry. 2002;72:701–707. doi: 10.1136/jnnp.72.6.701. [DOI] [PMC free article] [PubMed] [Google Scholar]
- 26.Temel Y, Boothman LJ, Blokland A, et al. Inhibition of 5-HT neuron activity and induction of depressive-like behavior by high-frequency stimulation of the subthalamic nucleus. PNAS. 2007;104:17087–17092. doi: 10.1073/pnas.0704144104. [DOI] [PMC free article] [PubMed] [Google Scholar]