Abstract
The klotho gene is expressed in a limited number of tissues, most notably in distal convoluted tubules in the kidney and choroid plexus in the brain. A previous study suggested that Klotho increases resistance to oxidative stress. However, changes of Klotho expression in high glucose-induced oxidative stress remain unclear. In the present study, we used streptozotocin-induced diabetic rats (STZ rats) to examine the effects of insulin, phloridzin or antioxidant, tiron on diabetic nephropathy. Both insulin and phloridzin reversed the lower Klotho expression levels in kidneys of STZ rats by the correction of hyperglycemia. Also, renal functions were improved by these treatments. In addition to the improvement of renal functions, the decrease of Klotho expression in kidney of STZ rats was also reversed by tiron without changing blood glucose levels. The reduction of oxidative stress induced by high glucose can be considered for this action of tiron. This view was further confirmed in vitro using high glucose-exposed Madin-Darby canine kidney (MDCK) epithelial cells. Thus, we suggest that decrease of oxidative stress is not only responsible for the improvement of renal function but also for the recovery of Klotho expression in kidney of STZ rats.
1. Introduction
The Klotho gene, named from a Greek goddess who spins the thread of life, was identified in 1997 as a gene mutated in the Klotho mouse, which exhibited multiple disorders resembling human premature-aging syndrome [1]. It is expressed in a limited numbers of tissues, most notably in distal convoluted tubules of kidney and choroid plexus of brain [1].
A previous study showed that overexpression of Klotho in a mouse model of glomerulonephritis restored mitochondrial function and suppressed mitochondrial DNA damage in kidney [2]. It also suppressed the accelerated cellular senescence and apoptosis induced by glomerulonephritis, resulting in preservation of renal function and improvement of survival [2]. These results suggest that Klotho seems related to increased resistance to oxidative stress [2].
Hyperglycemia is a main factor in the induction of diabetic nephropathy [3]. Research shows that early blood glucose control can reduce the incidence of diabetic nephropathy [4]. Hyperglycemic damage to mesangial cells is implicated in the development of diabetic nephropathy [5, 6]. One possibility is that high glucose levels induce excessive production of reactive oxygen species (ROS) in mesangial cells, causing damage to these cells [7]. Improvements in diabetes-induced renal dysfunction and/or diabetic nephropathy using antioxidants lend evidence to the role of ROS in kidney damage [5]. But the effect of ROS on changes of Klotho expression in diabetic nephropathy is unknown.
In present study we investigated changes in Klotho expression in diabetic nephropathy using type 1-like diabetic rats showing diabetic nephropathy [8]. We examined the effect of insulin and floridzin on hyperglycemia in diabetic rats and we tested the effect of a famous antioxidant, referred to as tiron on renal, function, and expression of Klotho in these kidneys. The role of oxidative stress in change of Klotho expression was further characterized in cultured Madin-Darby Canine Kidney (MDCK) epithelial cells [9].
2. Materials and Methods
2.1. Animal Model
Male Wistar rats, aged 6 weeks, were obtained from the Animal Center of National Cheng Kung University Medical College. Diabetic rats were induced by intravenously (i.v.) injecting streptozotocin (65 mg/kg) (Sigma-Aldrich Inc., USA) into fasting rats as described previously [8]. Animals were considered to be diabetic if they had elevated plasma glucose concentrations of 350 mg/dL. Then, these type 1-like diabetic rats, rerffered to as STZ rats, were considered to show diabetic nephropathy if their blood urea nitrogen (BUN) and creatinine values were elevated. All experiments were carried out at 9 weeks after diabetes induction. All animal procedures were performed according to the Guide for the Care and Use of Laboratory Animals of the National Institutes of Health.
For correction of hyperglycemia, STZ rats were injected intraperitoneally (i.p.) with long-lasting human insulin (Monotard HM., Denmark; 1 IU/kg) or phloridzin (1 mg/kg; Fluka Chemie AG, Switzerland), three times a day for 7 days as described previously [8, 10]. The age-matched rats were divided into four groups (n = 6): vehicle-treated normal rats, vehicle-treated STZ rats, insulin-treated STZ rats, and phloridzin-treated STZ rats. In another experiment, rats prepared as the above were randomly divided into three groups (n = 6): vehicle-treated normal rats; vehicle-treated STZ rats, and tiron-treated (i.p. at 300 mg/kg; 3 times/day) STZ rats.
The levels of plasma glucose, BUN, and creatinine, were measured in blood samples collected from the femoral vein of anesthetized rats (pentobarbital, 30 mg/kg, i.p.) one hour before treatment. Body temperature was also monitored during the experiment. At the end of treatment, animals were sacrificed and kidneys were dissected, washed with saline, weighed for analysis, and frozen in liquid nitrogen to store at −80°C for future analysis.
Blood samples from rats were centrifuged at 12,000 g for 3 minutes. Samples were then analyzed using glucose, BUN, and creatinine kit reagents (AppliedBio assay kits; Hercules, CA, USA). The levels of plasma glucose, BUN, and serum creatinine were then estimated by an autoanalyzer (Quik-Lab, USA) run in duplicate.
2.2. Western Blot Analysis
Protein expression levels of Klotho in rat kidneys or MDCK cells were determined by western blot analysis. RIPA buffer (25 mM Tris∙HCl pH 7.6, 150 mM NaCl, 1% NP-40, 1% sodium deoxycholate, 0.1% SDS) was used to extract total protein. Protein extracts were separated by SDS-PAGE, electrotransfered, and immobilized on a nitrocellulose membrane. The membrane was blocked with 5% nonfat milk in phosphate-buffered saline containing 0.1% Tween 20 (PBS-T) and incubated for 2 hours. The membrane was then washed in PBS-T and hybridized with primary antibodies, which were diluted to a suitable concentration in PBS-T for 16 hours. Specific antibodies purchased from Abgent (San Diego, CA, USA) for Klotho (1 : 1000) were used. Incubation with secondary antibodies and detection of the antigen-antibody complex were performed using an ECL kit (Amersham Biosciences, UK). Immunoblot densities were quantified using a laser densitometer.
2.3. Histological Analysis
The kidney was removed from each rat, fixed in PBS containing 10% formaldehyde, and embedded in paraffin. Each sample was then cut into 5-μm sections, the sections were mounted on glass slides and depleted of paraffin with xylene. Then sections are subjected to standard hematoxylin/eosin staining. The sections were observed with a light microscope.
2.4. Measurement of Reactive Oxygen Species (ROS) Generation
Superoxide production was determined using the lucigenin method [11]. Renal homogenates were obtained from normal rats or STZ rats following centrifugation. The resultant pellet was then resuspended in 900 μL of Krebs buffer, containing 130 mM NaCl, 5 mM KCl, 1 mM MgCl2, 1.5 mM CaCl2, 1 mM K2HPO4, and 20 mM HEPES, pH 7.4, with 1 mg/mL bovine serum albumin. To measure ROS production, the suspension were transferred into a measuring chamber and assessed in a Chemiluminescence Analyzer (Tohoku Electronic Industrial Co., Ltd., Japan). Measurement was induced by an injection of 100 μL lucigenin (final concentration, 4 × 10⁻⁴ mmol/L). Photon emission was counted every 10 seconds for up to 10 minutes.
2.5. Cell Cultures
The MDCK epithelial cells (BCRC no. 60004) were obtained from the Culture Collection and Research Center of the Food Industry Institute (Hsin-Chiu City, Taiwan), maintained in Minimum Essential Medium (Gibco-BRL, USA), and supplemented with 10% fetal bovine serum and antibiotics. After cells reached approximately 60% confluence, they were incubated in serum-free medium with varying final concentrations of D-glucose (5.5, 10, 20, 30 or 40 mM) for 24 hours. MDCK cells exposed to 5.5 mM D-glucose was used as the comparison condition. To rule out an effect of osmolarity, we added 24.5 mM mannitol into control cultures. We also treated MDCK cells with tiron (10 mmol/L, 4,5-dihydroxyl-1,3-benzene disulfonic acid; Sigma-Aldrich Inc., Saint Louis, MO, USA). After 24 hours of incubation, the cells were washed with PBS and harvested. Hydrogen peroxide (H2O2) was diluted and added into the culture medium at final concentrations of 50, 100, and 150 μmol/L. After 1 hour of H2O2 exposure, the culture medium was replaced with serum-free medium for another 23-hour culture period.
2.6. Intracellular ROS Detection
For intracellular ROS detection, 5000 MDCK cells were seeded into 12-well cell culture plates. After 24 hr of growth, cultures were placed in either control or high glucose (HG) medium, treated as described above for 24 hr and then harvested. The MDCK cells were fixed with 4% paraformaldehyde for 30 min. After fixation, cells were washed three times with PBS, and 5 μmol/L of dihydroethidium (DHE; Invitrogen) was added as a fluorescent indicator of ROS. Images were collected with an Olympus IX70 fluorescence microscope fitted with an Olympus America camera and MagnaFire 2.1 software.
2.7. Statistical Analysis
Statistical analysis was carried out using ANOVA analysis and Newman-Keuls Post-hoc analysis. Statistical significance was achieved if the P < .05. Results were expressed as mean ± SE.
3. Results
3.1. Effect of Insulin or Phloridzin on Rats with Diabetic Nephropathy
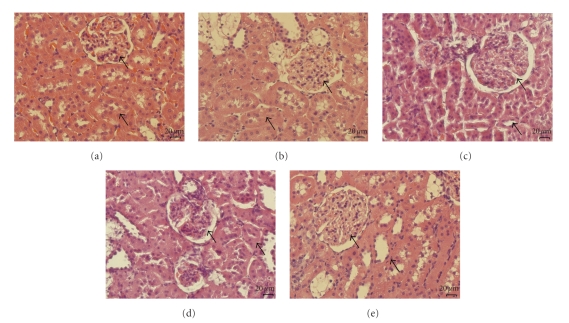
After 9 weeks of diabetes induction, the serum levels of glucose, BUN, and creatinine in STZ rats were markedly higher than in age-matched normal rats (Table 1); marked difference in BUN and creatinine levels between the two groups were observed (P < .05). HE (hematoxylin and eosin stain) staining also showed structural defects of glomerosclerosis and tubular thickness in STZ rats (Figure 1(b), black arrows). After treatment with insulin or phloridzin for 7 days, the serum glucose was significantly reduced in STZ rats (Table 1). BUN and creatinine levels in insulin- or phloridzin-treated STZ rats were also decreased (Table 1). These treatments ameliorated glomerosclerosis and improved tubular thickness, as observed by HE staining (Figures 1(c)–1(d), black arrows).
Table 1.
Changes in blood glucose, BUN, and creatinine levels in streptozotocin-induced diabetic rats (STZ-DN) receiving repeated i.p. injection with insulin (1 IU/kg) or phloridzin (1 mg/kg) three times per day for 7 days.
| Normal rats-vehicle | STZ-DN-vehicle | STZ-DN-Insulin | STZ-DN-Phloridzin | |||||
|---|---|---|---|---|---|---|---|---|
| Before | After | Before | After | Before | After | Before | After | |
| Glucose (mg/dL) | 118.3 ± 12.1 | 121.8 ± 10.7 | 468.4 ± 11a | 473.1 ± 6.2a | 455.8 ± 10.3 | 244.3 ± 8.4b | 488.3 ± 14.4 | 213.4 ± 12.7b |
| BUN (mg/dL) | 18.9 ± 0.4 | 19.1 ± 0.8 | 34.3 ± 0.4a | 38.2 ± 1.1a,b | 34.6 ± 1.8 | 23.8 ± 0.9b | 32.6 ± 1.3 | 24.5 ± 1.4b |
| Creatinine (μg/dL) | 612.3 ± 11.2 | 605.4 ± 9.8 | 717.8 ± 11.6a | 744.2 ± 3.9a | 787.2 ± 14.7 | 674.2 ± 8.6b | 817.6 ± 26.5 | 634.9 ± 11.7b |
Values (mean ± SE) were obtained from each group of six rats. The vehicle used to dissolve the testing drugs was given at the same volume. aP < .05—for values obtained from STZ-DN group compared to the values obtained from vehicle-treated normal rats. bP < .05—for values after treatment compared to the values of before vehicle, insulin or phloridzin treatment, respectively.
Figure 1.
Kidney sections of STZ rat treatmented with isulin, phlorizin, and tiron. Histology of kidneys were characterized by staining with hematoxylin-eosin staining (Magnification: 400x). (a) normal wistar, (b) STZ rats, (c) insulin treated STZ rats, (d) phlorizin-treated STZ rats, and (e) tiron-treated STZ rats.
3.2. Effect of Antioxidant on Rats with Diabetic Nephropathy
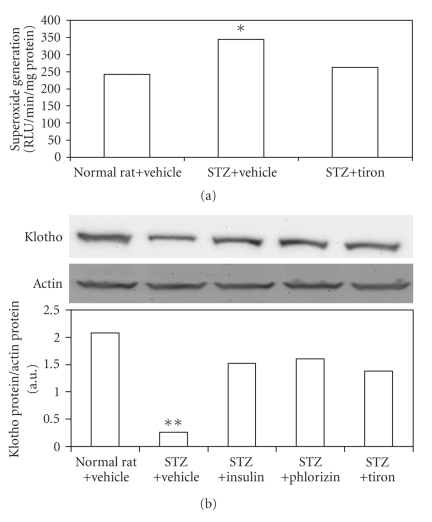
After a 7-day treatment with the antioxidant tiron, the blood glucose level was not changed in STZ rats, similar to that in STZ rats receiving vehicle (Table 2). The lucigenin assay showed that superoxide levels in diabetic kidneys were markedly higher than normal kidneys (control) and these levels were significantly reduced by tiron (Figure 2(a)). The blood levels of BUN and creatinine in tiron-treated STZ rats were also improved (Table 2). Additionally, expression levels of Klotho were decreased in STZ rats, and these levels could be restored in kidneys of diabetic rats treated with tiron (Figure 2(b)). From HE staining, rehabilitation of structural change was also observed in kidney receiving tiron treatment (Figure 1(e), black arrows).
Table 2.
Changes in serum glucose, BUN, and creatinine levels in normal rats or streptozotocin-induced diabetic rats (STZ-DN) receiving repeated i.p. injection with vehicle or tiron (300 mg/kg) three times a day for 7 days.
| Normal rats-vehicle | STZ-DN-vehicle | STZ-DN-tiron | ||||
|---|---|---|---|---|---|---|
| Before | After | Before | After | Before | After | |
| Glucose (mg/dL) | 116.3 ± 5.2 | 122.9 ± 5.3 | 478.2 ± 13.8a | 483.7 ± 14.5a | 481.8 ± 13.7a | 473.2 ± 12.3a |
| BUN (mg/dL) | 18.2 ± 0.8 | 16.3 ± 0.8 | 29.8 ± 0.7a | 31.9 ± 1.2a | 31.4 ± 0.4a | 22.3 ± 0.5 |
| Creatinine (μg/dL) | 612.7 ± 9.8 | 621.4 ± 4.6 | 723.6 ± 21.8a | 753.7 ± 11.4ab | 744.6 ± 12.3a | 614.8 ± 26.8b |
Values (mean ± SE) were obtained from each group of six animals. The vehicle used to dissolve the testing drugs was given at the same volume. aP < .05 compared to the values of control, bP < .05 compared to the values of before vehicle or tiron treatment.
Figure 2.
Alteration of superoxide generation (ROS) in the kidneys of STZ-diabetic rats treatmented with tiron. Klotho protein in the kidneys of STZ-diabetic rats treatmented with isulin, phlorizin and tiron. (a) Lucigenin assay of the STZ-diabetic rats. Western blot analysis of (b) Klotho expression in the kidneys of STZ-diabetic rats. Upper picture shows protein levels or the corresponding β-actin levels shown as loading controls in kidneys isolated from STZ-diabetic rats. The different treatments are described in materials and methods. Quantification of protein level using Klotho/β-actin, expressed as means with SE (n = 4 per group) in each column are presented in the lower panel. *P < .05, **P < .001 compared to the value of vehicle-treated normal rats.
3.3. Recovery of Renal Klotho due to Decreased Levels of ROS
Changes in klotho expression in kidneys from STZ rats were characterized using Western Blot analysis. Klotho expression in kidney of STZ rats was markedly reduced as compared to control group (Figure 2(b)). Insulin or phloridzin treatment reversed Klotho expression in kidney of STZ rats (Figure 2(b)). Similar results were also observed in tiron-treated kidney (Figure 2(b)).
3.4. Decrease of Klotho Expression Levels by Glucose in Tubular Cells
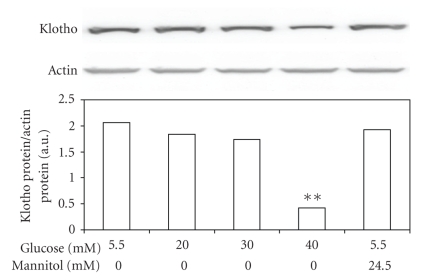
Effect of hyperglycemia on Klotho expression levels was further characterized in cultured MDCK cells exposed to various concentrations of glucose in vitro. The Klotho expression in MDCK cells was reduced by high glucose in a concentration-dependent manner after 24-hr incubation (Figure 3). But the Klotho expression levels were not changed in mannitol-treated MDCK cells, indicating that the mediation of hyperosmolarity does not reduced klotho levels. Actually, decrease of Klotho expression by high glucose in MDCK cells is similar to that observed in diabetic kidneys (Figure 2(b)). From the detection of DHE staining, we also demonstrated that high glucose caused an increase in superoxide levels in MDCK cells and that tiron reduced ROS in glucose-treated MDCK cells (Figure 4).
Figure 3.
Changes in expression of Klotho in tubular cells (MDCK cells) after exposure to high concentrations of glucose. Cultured MDCK cells exposed to glucose at final concentrations of 10 mM, 20 mM, 30 mM and 40 mM were used to compare with the control, which was incubated with 5.5 mM glucose. Cells were also exposed to 24.5 mM mannitol to produce the same osmolarity (317 mOsmol/L) as that produced when using the highest concentration of glucose (30 mM). After 24 hours of incubation, cells were prepared for Western blot analysis. Quantification of protein levels using Klotho over β-actin indicated as means with SE (n = 4 per group) in each column are presented in the lower panel. *P < .05, **P < .001 compared to control.
Figure 4.
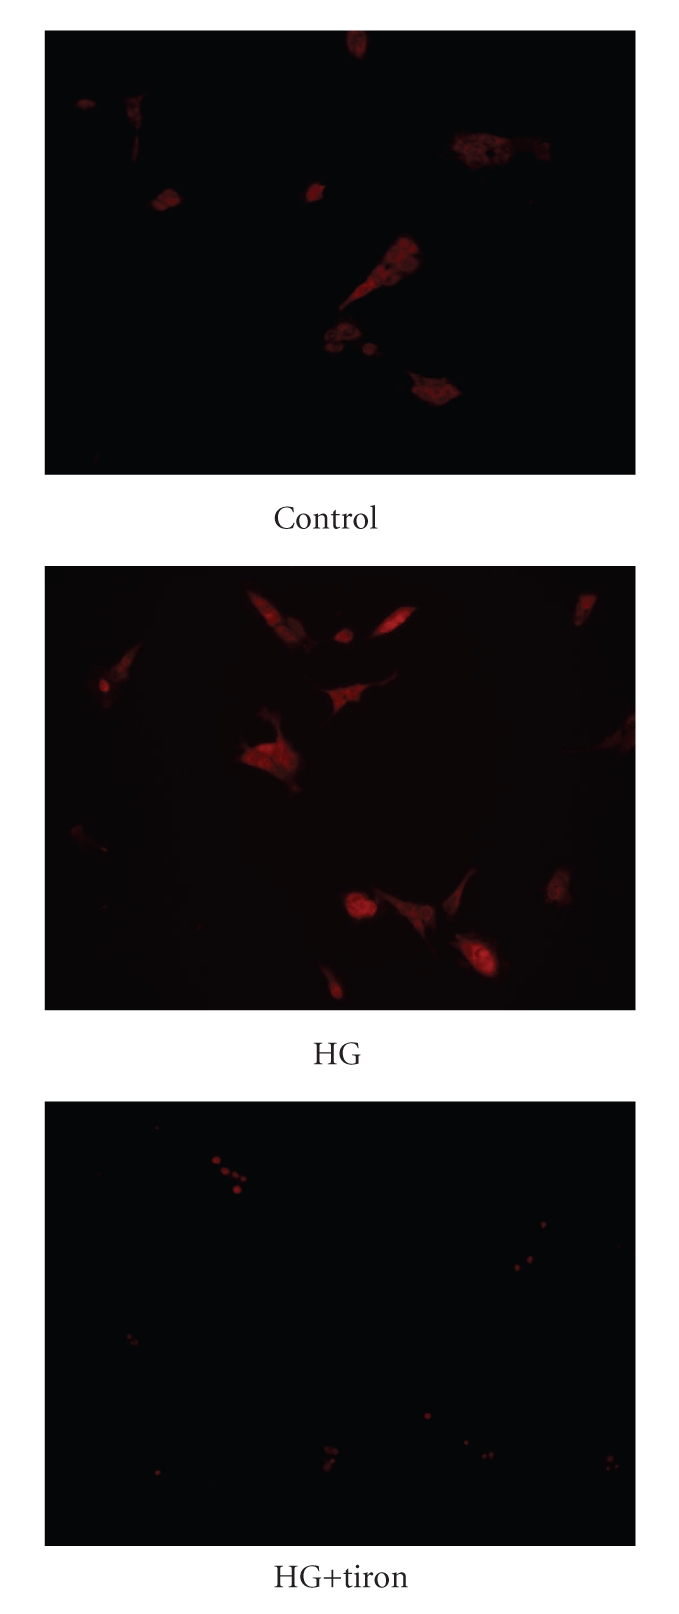
DHE stains were used to visualize the intracellular ROS in MDCK cells.
3.5. Decrease of Klotho Expression Level in MDCK Cells by ROS from High Glucose
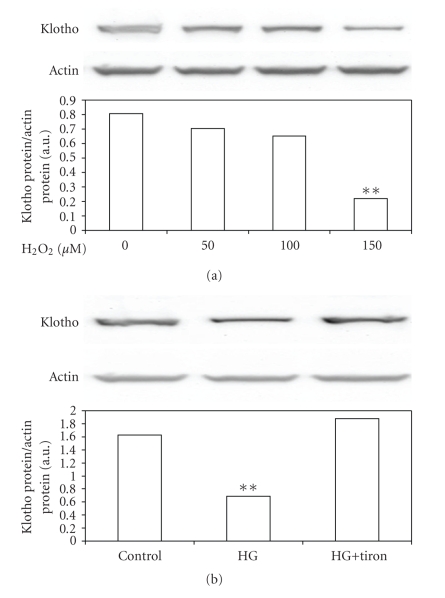
ROS are excessively produced in the pathogenesis of acute and chronic renal diseases [12]. To understand the effect of ROS on Klotho expression, we treated MDCK cells with hydrogen peroxide (H2O2) directly and then we examined the changes of Klotho expression using Western Blot analysis. As shown in Figure 5(a), H2O2 decreased Klotho expression in MDCK cells. High glucose-induced ROS is believed to be one of the main factors in the pathogenesis of diabetic nephropathy [7]. Thus, we treated MDCK cells in high glucose (40 mmol/L; HG) medium with and without 10 mmol of tiron, a superoxide anion scavenger [8]. The DHE fluorescence staining was applied to confirm the increase of ROS in HG-treated MDCK cells (Figure 2(b)) and mamnitol was used to exclude the role of hyperosmolarity. As shown in Figure 5(b), the lowering of Klotho protein in MDCK cells by high glucose concentrations was markedly reversed by tiron treatment.
Figure 5.
Changes in Klotho expression levels in cultured MDCK cells. (a) Western blot analysis of Klotho expression in normal glucose (5 mmol/L) medium in MDCK cells treated with H2O2. Upper picture shows the protein level of Klotho or actin in MDCK cells. **P < .001 compared to MDCK cells without H2O2 treatment. Western blot analysis was used to detect Klotho (b) expression in MDCK cells cultured with normal glucose (5 mmol/L; control) or high glucose (40 mmol/L glucose; HG) medium with or without tiron (10 mmol/L) treatment. Upper picture shows the protein level of Klotho or actin in MDCK cells. Quantification of protein levels indicated as means with SE (n = 4 per group) in each column are presented in the lower panel. **P < .001 compared to control.
4. Discussion
In the present study, we found that hyperglycemia caused poor renal function and lower expression of Klotho protein in diabetic kidney, and these defects could be reversed by correction of blood glucose levels using insulin or phloridzin treatment in diabetic rats. We used STZ to induce type-1 like diabetes in rats according to previous report [8]. After 9 weeks, diabetic rats developed diabetic nephropathy showing typical features of this disorder, such as higher creatinine and BUN levels in blood [13]. Although, Proteinuria was not measured in the present study.
Insulin and phloridzin have the ability to lower blood glucose levels in diabetic animals through different mechanisms; insulin decreases blood glucose via receptor-coupled signaling [14] and phloridzin acts as an inhibitor of renal tubular reabsorption of glucose [10]. A 7-day correction of hyperglycemia with insulin or phloridzin-improved renal function in STZ-induced diabetic rats. These results support the view that blood glucose control can reduce the incidence of diabetic nephropathy [12].
It has been demonsted that Klotho-overexpressed mice showed increased SOD2 expression in muscles and low levels of phosphorylated Forkhead box O proteins (FOXOs), in addition to the reduced oxidative stress as evidenced by lower levels of urinary 8-OHdG, a marker of oxidative damages to DNA [15]. Also, they survived normally lethal quantities of injected paraquat, a herbicide that generates reactive oxygen species (ROS), indicating that Klotho overexpression induces resistance to oxidative stress. Klotho could activate FOXOs, induce SOD2 expression, and confer resistance to oxidative damages and apoptosis induced by paraquat or hydrogen peroxide [16]. Oxidative stress is involved in the pathogenesis of various diseases, including ischemia and inflammation. Renal Klotho expression was significantly suppressed in the kidney subjected to experimental injury by H2O2 [17]. Also, higher expression of Klotho prevented ischemic renal damages and the development of acute renal failure [2, 18]. These observations suggest that Klotho seems related to the induction of resistance to oxidative stress. This view was consistent with our results both in kidney of STZ rats and cultured renal tubular cells. In the present study, STZ rats treated with tiron at doses sufficient to scavenge free radicals continuously for 7 days showed a recovery of renal function without the correction of blood glucose. The decrease of Klotho expression in kidney of STZ rats was also reversed by tiron treatment with a marked reversion of structural defeats. The important role of oxidative stress in damage of diabetic kidney can be considered. Moreover, the reduced expression of Klotho in cultured renal tubular cells caused by high glucose was also reversed by the antioxidant tiron. Thus, antioxidants could provide effective protection against the oxidative stress through Klotho expression in diabetic nephropathy.
Klotho plays a major role in the protection of kidney due to antioxidation [2, 18] relating with PPAR-gamma [9]. It has been established that high glucose caused an excessive production of ROS [7]. Improvements in diabetes-induced renal dysfunction and diabetic nephropathy by antioxidants is evidence for an important role of ROS in kidney damage [5]. Klotho expression was reduced under hyperglycemic condition in kidney and renal tubular cells. It can be considered that decrease of Klotho expression is related to the process of diabetic nephropathy. This view has not been mentioned before. Otherwise, Klotho has been introduced as a cofactor of fibroblast growth factor 23 (FGF23)-induced phosphate excretion in kidney [17]. According to our results, phosphate excretion was actually decreased in STZ rats with a marked lower of Klotho expression (data not shown). However, the role of FGF-23 in this change shall be studied in the future.
5. Conclusion
In the present study, Klotho expression is decreased in the kidney of STZ rats showed diabetic nephropathy. This decreased Klotho expression can be reversed by antioxidant without the correction of blood glucose. Thus, we suggest that antioxidants and/or agents can increase Klotho expression may have the merit in the prevention of renal damage from oxidative stress produced in diabetic disorders.
References
- 1.Kuro-o M, Matsumura Y, Aizawa H, et al. Mutation of the mouse klotho gene leads to a syndrome resembling ageing. Nature. 1997;390(6655):45–51. doi: 10.1038/36285. [DOI] [PubMed] [Google Scholar]
- 2.Haruna Y, Kashihara N, Satoh M, et al. Amelioration of progressive renal injury by genetic manipulation of Klotho gene. Proceedings of the National Academy of Sciences of the United States of America. 2007;104(7):2331–2336. doi: 10.1073/pnas.0611079104. [DOI] [PMC free article] [PubMed] [Google Scholar]
- 3.Schena FP, Gesualdo L. Pathogenetic mechanisms of diabetic nephropathy. Journal of the American Society of Nephrology. 2005;16(supplement 1):S30–S33. doi: 10.1681/asn.2004110970. [DOI] [PubMed] [Google Scholar]
- 4.Ohkubo Y, Kishikawa H, Araki E, et al. Intensive insulin therapy prevents the progression of diabetic microvascular complications in Japanese patients with non-insulin-dependent diabetes mellitus: a randomized prospective 6-year study. Diabetes Research and Clinical Practice. 1995;28(2):103–117. doi: 10.1016/0168-8227(95)01064-k. [DOI] [PubMed] [Google Scholar]
- 5.Shah SV, Baliga R, Rajapurkar M, Fonseca VA. Oxidants in chronic kidney disease. Journal of the American Society of Nephrology. 2007;18(1):16–28. doi: 10.1681/ASN.2006050500. [DOI] [PubMed] [Google Scholar]
- 6.Ohshiro Y, Takasu N. Molecular mechanism of diabetic nephropathy. Nippon Rinsho. 2006;64(5):997–1003. [PubMed] [Google Scholar]
- 7.Ha H, Lee HB. Reactive oxygen species amplify glucose signalling in renal cells cultured under high glucose and in diabetic kidney. Nephrology. 2005;10(supplement 2):S7–S10. doi: 10.1111/j.1440-1797.2005.00448.x. [DOI] [PubMed] [Google Scholar]
- 8.Cheng J-T, Huang C-C, Liu I-M, Tzeng T-F, Chih JC. Novel mechanism for plasma glucose-lowering action of metformin in streptozotocin-induced diabetic rats. Diabetes. 2006;55(3):819–825. doi: 10.2337/diabetes.55.03.06.db05-0934. [DOI] [PubMed] [Google Scholar]
- 9.Zhang H, Li Y, Fan Y, et al. Klotho is a target gene of PPAR-γ. Kidney International. 2008;74(6):732–739. doi: 10.1038/ki.2008.244. [DOI] [PubMed] [Google Scholar]
- 10.Huang C-J, Liu I-M, Cheng J-T. Increase of peroxisome proliferator-activated receptor δ gene expression in the lungs of streptozotocin-induced diabetic rats. Pulmonary Pharmacology and Therapeutics. 2007;20(1):69–74. doi: 10.1016/j.pupt.2005.11.012. [DOI] [PubMed] [Google Scholar]
- 11.Hsieh T-J, Zhang S-L, Filep JG, Tang S-S, Ingelfinger JR, Chan JSD. High glucose stimulates angiotensinogen gene expression via reactive oxygen species generation in rat kidney proximal tubular cells. Endocrinology. 2002;143(8):2975–2985. doi: 10.1210/endo.143.8.8931. [DOI] [PubMed] [Google Scholar]
- 12.Iglesias-De La Cruz MC, Ruiz-Torres P, Alcamí J, et al. Hydrogen peroxide increases extracellular matrix mRNA through TGF-β in human mesangial cells. Kidney International. 2001;59(1):87–95. doi: 10.1046/j.1523-1755.2001.00469.x. [DOI] [PubMed] [Google Scholar]
- 13.Mauer SM, Steffes MW, Brown DM. The kidney in diabetes. American Journal of Medicine. 1981;70(3):603–612. doi: 10.1016/0002-9343(81)90582-9. [DOI] [PubMed] [Google Scholar]
- 14.Hawkins M, Hu M, Yu J, et al. Discordant effects of glucosamine on insulin-stimulated glucose metabolism and phosphatidylinositol 3-kinase activity. The Journal of Biological Chemistry. 1999;274(44):31312–31319. doi: 10.1074/jbc.274.44.31312. [DOI] [PubMed] [Google Scholar]
- 15.Yamamoto M, Clark JD, Pastor JV, et al. Regulation of oxidative stress by the anti-aging hormone klotho. The Journal of Biological Chemistry. 2005;280(45):38029–38034. doi: 10.1074/jbc.M509039200. [DOI] [PMC free article] [PubMed] [Google Scholar]
- 16.Ikushima M, Rakugi H, Ishikawa K, et al. Anti-apoptotic and anti-senescence effects of Klotho on vascular endothelial cells. Biochemical and Biophysical Research Communications. 2006;339(3):827–832. doi: 10.1016/j.bbrc.2005.11.094. [DOI] [PubMed] [Google Scholar]
- 17.Mitobe M, Yoshida T, Sugiura H, Shirota S, Tsuchiya K, Nihei H. Oxidative stress decreases klotho expression in a mouse kidney cell line. Nephron—Experimental Nephrology. 2005;101(2):e67–e74. doi: 10.1159/000086500. [DOI] [PubMed] [Google Scholar]
- 18.Sugiura H, Yoshida T, Tsuchiya K, et al. Klotho reduces apoptosis in experimental ischaemic acute renal failure. Nephrology Dialysis Transplantation. 2005;20(12):2636–2645. doi: 10.1093/ndt/gfi165. [DOI] [PubMed] [Google Scholar]


