

Abstract
Multidrug resistance (MDR) is a major obstacle towards a successful treatment of gastric cancer. However, the mechanisms of MDR are intricate and have not been fully understood. To elucidate the molecular mechanisms of MDR in gastric cancer, we employed the proteomic approach of isobaric tags for relative and absolute quantification (iTRAQ), followed by LC-MS/MS, using the vincristine-resistant SGC7901/VCR cell line and its parental SGC7901 cell line as a model. In total, 820 unique proteins were identified and 91 proteins showed to be differentially expressed in SGC7901/VCR compared with SGC7901. Several differentially expressed proteins were further validated by western blot analysis. Furthermore, the association of MVP, one of the highly expressed proteins in SGC7901/VCR, with MDR was verified. Our study is the first application of iTRAQ technology for MDR mechanisms analysis in gastric cancer, and many of the differentially expressed proteins identified have not been linked to MDR in gastric cancer before, which showed the value of this technology in identifying differentially expressed proteins in cancer.
1. Introduction
Despite the decreasing incidence and mortality, gastric cancer remains the second leading cause of cancer-related death in the world [1]. Chemotherapy plays an important role in the treatment of gastric cancer at various stages. However, a major problem in gastric cancer treatment is the development of resistance to multiple chemotherapeutic agents in tumor cells [2]. Several mechanisms have been found to be responsible for anticancer drug resistance such as increased drug efflux, DNA repair activity, and altered survival and apoptotic signaling pathways [3]. These pathogenesis studies on multidrug resistance (MDR) of tumors have been undertaken successfully, but the mechanisms of MDR are intricate and have not been fully elucidated yet. To further characterize the mechanisms of MDR, in recent years many model cell lines selected by anticancer drugs are available. Vincristine-resistant SGC7901/VCR, which is derived from human gastric cancer cell line SGC7901 by stepwise selection in vitro using vincristine, and can also cross-resist to other anticancer drugs such as cisplatin, adriamycin, etoposide, mitomycin C, and 5-fluorouracil (5-FU), has been widely employed as a cell culture model for the investigation of the mechanism underlying MDR in gastric cancer [4]. Though the overexpression of the membrane P-glycoprotein in SGC7901/VCR was highly correlated with its MDR phenotype, treatment with verapamil, a potent inhibitor of P-glycoprotein, did not fully restore the sensitivity of SGC7901/VCR to vincristine [5], suggesting that other still unknown mechanisms might be involved in the development of MDR of SGC7901/VCR.
2-DE is the principal step of proteomics and widely used in comparative studies of protein expression levels. However, this technique has several disadvantages, including poor reproducibility between gels, low sensitivity in the detection of proteins in low concentrations and hydrophobic membrane proteins, limited sample capacity and low linear range of visualization procedures [6, 7]. To overcome these major limitations of 2-DE technique, we focused in recent years on newly emerging proteomic approaches, including ICAT, iTRAQ, 18O, and stable isotope labeling with amino acids in cell culture (SILAC) [8]. Among these methods, isobaric tags for relative and absolute quantification (iTRAQ) analysis provides a more comprehensive approach for the discovery and quantification of the proteome [9]. In this study, we used iTRAQ method to perform quantitative protein profiling of the SGC7901/VCR and its parental cell line SGC7901. Furthermore, the differential expression levels of partial proteins were validated by Western blot analysis. Many unique proteins identified using this approach have not previously been associated with MDR of gastric cancer. Thus, the results presented here will no doubt provide important clues to the mechanisms of MDR in gastric cancer.
2. Materials and Methods
2.1. Cell Lines
Vincristine-resistant human gastric cancer cell line SGC7901/VCR and its parental cell line SGC7901 were a gift from Dr. DM Fan (The Fourth Military Medical University, China). SGC7901 was cultured with RPMI1640 medium containing 10% fetal calf serum (Gibico BRL, Grand Island, NY, USA). To maintain biologic characteristics of MDR, SGC7901/VCR was cultured with RPMI1640 medium containing 10% fetal calf serum and 1 mg/L vincristine (Sigma-Aldrich, St. louis, MO, USA).
2.2. Reagents
The iTRAQ kits were purchased from Applied Biosystems (Foster City, CA, USA). Sequence grade modified trypsin was purchased from Promega (Madison, WI, USA). PVDF membrane, goat antimouse, goat antirabbit or rabbit antigoat IgG-conjugated with horseradish peroxidase, and the enhanced chemiluminescence (ECL) system were purchased from Amersham Biosciences (Uppsala, Sweden). Monoclonal or polyclonal antibodies against MIF, MCM3, MVP, YWHAG, HSPB1, SRI, ABCB1, and Actin were from Santa Cruz Biotechnology, Santa Cruz, CA, USA.
2.3. Protein Sample Preparation and iTRAQ Labeling
The cells were harvested and lysed in lysis buffer (7 M urea, 1 mg/mL DNase I, 1 mM Na3VO4, and 1 mM PMSF). The lysates were incubated at 37°C for 1 hour, and then centrifuged at 15,000 rpm for 30 minutes at 4°C. The supernatant was collected and the concentration of the total proteins was determined using 2D Quantification kit (Amersham Biosciences). For each sample, a total of 100 μg of protein was precipitated by the addition of four volumes of cold acetone and stored in −20°C for 2 hours. The precipitated protein was then dissolved in solution buffer, denatured, and cysteines blocked according to the manufacturer (Applied Biosystems). Each sample was then digested with 20 μL of 0.25 μg/μL trypsin (Promega) solution at 37°C overnight and labeled with the iTRAQ tags as follows: (i) parental cell line SGC7901-119 tag and (ii) Vincristine-resistant cell line SGC7901/VCR-121 tag. The labeled samples were pooled prior to further analysis.
2.4. Strong Cation Exchange Chromatography
To reduce sample's complexity during LC-MS/MS analysis, the pooled samples were diluted 10-fold with SCX buffer A (10 mM KH2PO4 in 25% acetonitrile at pH 3.0) and subjected to a 2.1 × 200 mm Polysulfoethyl A SCX column (Poly LC, Columbia, MD, USA). The column was eluted with a gradient of 0%–25% SCX buffer B (10 mMKH2PO4at pH3.0 in25% acetonitrile containing 350 mM KCl) over 30 minutes, followed by a gradient of 25%–100% SCX buffer B over 40 minutes. The fractions were collected at 1-minute intervals. These SCX fractions were lyophilized in vacuum concentrator, and subjected to C-18 clean-up using a C18 Discovery DSC-18 SPE column (100 mg capacity, Supelco, Sigma-Aldrich). The cleaned fractions were then lyophilized again and stored in −20°C prior to mass spectrometric analysis.
2.5. ESI-Q-TOF-MS Analysis and Data Processing
Mass spectrometric analysis was performed using a nano-LC coupled online to QStarXL mass spectrometer (Applied Biosystems). Peptides were loaded on a 75 cm × 10 cm, 3-mm fused silica C18 capillary column, followed by mobile phase elution: buffer A (0.1% formic acid in 2% acetonitrile) and buffer B (0.1% formic acid in 98% acetonitrile). The peptides were eluted from 2% buffer B to 100% buffer B over 60 minutes at a flow rate 300 nL/min. The LC eluent was directed to ESI source for Q-TOF-MS analysis. The mass spectrometer was set to perform information-dependent acquisition (IDA) in the positive ion mode, with a selected mass range of 300–2000 m/z. Peptides with +2 to +4 charge states were selected for tandem mass spectrometry, and the time of summation of MS/MS events was set to 3 seconds. The two most abundantly charged peptides above a 10 count threshold were selected for MS/MS and dynamically excluded for 60 seconds with ±50 mmu mass tolerance.
Peptide identification and quantification were performed using ProteinPilot software packages (Applied Biosystems). Each MS/MS spectrum was searched against the IPI human protein database v3.49 and protein identification was accepted based on ProteinPilot confidence scores. Relative quantification of proteins, in the case of iTRAQ, is performed on the MS/MS scans and is given by the peak areas ratio at m/z 119 and 121 Da. Error factor (EF) and P-value are calculated using ProteinPilot software which gave an indication of the deviation and significance in the protein quantification.
2.6. Western Blot Analysis
The cells were lysed at 4°C for 30 minutes in a lysis buffer (50 mM Tris, pH 7.4, 100 mM NaCl2, 1 mM MgCl2, 2.5 mM Na3VO4, 1 mM PMSF, 2.5 mM EDTA, 0.5% Triton X-100, 0.5% NP-40, 5 μg/mL of aprotinin, pepstatin A, and leupeptin). The cell lysates were centrifuged at 15,000 rpm for 15 minutes at 4°C. Protein concentration was determined using 2D Quantification kit (Amersham Biosciences). The protein samples (about 20 μg) were separated using SDS-PAGE. After SDS-PAGE electrophoresis, proteins were transferred to PVDF membranes. The membranes were blocked overnight at 4°C with 5% nonfat dry milk in TBS-T buffer (20 mM Tris, pH 7.6, 100 mM NaCl2, 0.5% Tween-20), followed by 3 hours of incubation with the primary antibody (1 : 1500–1 : 2000 dilution) in TBS-T buffer containing 5% nonfat dry milk at room temperature. After washing three times with TBS-T buffer, the membranes were incubated with a horseradish peroxidase-conjugated goat antimouse IgG, goat antirabbit IgG, or rabbit anti-goat IgG as a secondary antibody (1 : 3000 dilution) for 1 hour at room temperature. The membranes were then washed three times in TBS-T buffer and the reactions were visualized with ECL detection system. All of the Western blot analyses were repeated at least three times.
2.7. Transfection of the Full-Length MVP Gene to Cells
The full-length MVP gene was amplified from cDNA synthesized by RT-PCR using the total RNA extracted from cells SGC7901/VCR as the template. The following primers were used for PCR: forward: 5-CCCAAGCTTGTCACCATGGCAACTGAAGAG-3 (HindIII site underlined); reverse: 5-CGGGATCCCGCAGTACAGGCACCACGTGG-3 (BamHI site underlined). The purified PCR products were digested with HindIII and BamHI, and then cloned into the pcDNA3.1 vector (Invitrogen Life Technologies, Grand Island, NY) followed by sequence confirmation by DNA sequencing analysis. SGC7901 cells were transfected with pcDNA3.1/MVP or pcDNA3.1/control vector using lipofectamine 2000 following the manufacturer's protocol (Invitrogen Life Technologies). Briefly, SGC7901 cells were seeded into 6-well plates, and when the cells were 90% confluent, they were transfected with 4 μg pcDNA3.1/MVP or pcDNA3.1/control vector. Two days following transfection, the cells were replated and selected with 800 μg/mL G418 for 2 weeks, and stable clones were propagated for further analysis. The cytotoxicity was determined using MTT assay described previously [10]. Briefly, the transfected SGC7901/MVP cells and SGC7901/vector cells were seeded in each well of 96-well plates. The adriamycin and vincristine of different concentrations were then added to the cells, and the cells were cultured for 24 hours before the cell viability examination using the MTT assay.
2.8. Administration of MVP siRNA to Cells
The cells were transfected with MVP siRNA (sc-35824) (Santa Cruz Biotechnology) according to the siRNA transfection protocol provided by the manufacturer. Briefly, SGC7901/VCR cells were plated into 6-well plates and 96-well plates at the density of 105 cells/mL medium, respectively. When the cells were 60%–80% confluent, they were transfected with 10 nmol/L of MVP siRNA and control siRNA after a pre-incubation for 20 minutes with siRNA transfection reagent in siRNA transfection medium (Santa Cruz Biotechnology). After 4 hours of transfection, the medium was replaced with RPMI1640 medium containing 10% fetal calf serum, and continued to culture the cells for additional 44 hours. The cells were then incubated with different concentrations of adriamycin and vincristine. After 24-hour incubation, MVP expression level was determined by Western blot analysis described above, and the cell viability of SGC7901/VCR was examined using the MTT assay.
2.9. Statistical Analysis
The data were expressed as mean ± SE, and analyzed with the Student's t-test between two groups. It was considered statistically significant if P-value was less than .05.
3. Results
3.1. iTRAQ Analysis of Differentially Expressed Proteins
To investigate the molecular consequences of multidrug resistance in gastric cancer, we employed a quantitative proteomics iTRAQ method for this study using the vincristine-resistant gastric cancer cell line SGC7901/VCR and its parental gastric cancer cell line SGC7901 as a model. To reduce extreme sample's complexity, a batch of 70 fractions was separated per iTRAQ experiment using strong cation exchange chromatography. These fractions were then combined in 20 samples and analyzed by LC/MS/MS. A schematic flow of the iTRAQ method is shown in Figure 1(a). MS/MS spectrum of Sorcin b (peptide sequence: FISFDTDR) is illustrated in Figure 1(b). Vincristine-resistant SGC7901/VCR cells were labeled with iTRAQ 121 tag, and SGC7901 cells were labeled with iTRAQ 119 tag. Thus the ratio of 121 : 119 would indicate the relative abundance of the Sorcin b protein (Figure 1(c)). To increase the coverage of protein identification and/or the confidence of the data generated, two separate preparations were made, and each was analyzed by LC/MS/MS. A total of 820 unique proteins were identified with 95% confidence by the ProteinPilot search algorithm against the IPI human protein database v3.49. Although relative quantification analysis by ProteinPilot 2.0 software come with statistical analysis and since most methods are prone to technical variation, we included an additional 1.3-fold change cutoff for all iTRAQ ratios to reduce false positives for the selection of differentially expressed proteins. This filtering measure resulted in a final set of 91 differentially expressed proteins in SGC7901/VCR versus SGC7901. Of those, 35 proteins were increased and 56 were decreased in SGC7901/VCR (Table 1). These 91 proteins, which were differentially expressed between the SGC7901/VCR and SGC7901, could be classified into 14 functional categories using the PANTHER classification system (http://www.pantherdb.org) (Figure 2). The top three molecular functions categories were nucleic acid binding (25.3%), cytoskeletal protein (13.2%), and oxidoreductase (9.9%).
Figure 1.

(a) Flow chart of iTRAQ proteomics approach. (b) A representative MS/MS spectrum showing the peptides from Sorcin (peptide sequence: FISFDTDR). The cells SGC7901/VCR and SGC7901 were labeled with iTRAQ reagents 121 and 119. So the ratio of 121 : 119 would indicate the relative abundance of Sorcin protein in vincristine-resistant SGC7901/VCR versus SGC7901 (c).
Table 1.
iTRAQ analysis of differentially expressed proteins between vincristine-resistant SGC7901/VCR (iTRAQ 121) and SGC7901 (iTRAQ 119).
| N | Accession | Gene symbol | Name | 121 : 119 | P-value 121 : 119 | Function |
|---|---|---|---|---|---|---|
| 1 | IPI : IPI00013214.2 | MCM3 | DNA replication licensing factor MCM3 | 0.38 | .03 | Hydrolase |
| 2 | IPI : IPI00218831.4 | GSTM1 | Glutathione S-transferase Mu 1 | 0.41 | .02 | Transferase |
| 3 | IPI : IPI00293276.10 | MIF | Macrophage migration inhibitory factor | 0.42 | .05 | Calcium binding protein |
| 4 | IPI : IPI00025277.5 | PDCD6 | Programmed cell death protein 6 | 0.42 | .00 | Calcium binding protein |
| 5 | IPI : IPI00873768.1 | NEDD8 | Putative uncharacterized protein NEDD8 (Fragment) | 0.42 | .04 | Nucleic acid binding |
| 6 | IPI : IPI00017617.1 | DDX5 | Probable ATP-dependent RNA helicase DDX5 | 0.45 | .02 | Nucleic acid binding |
| 7 | IPI : IPI00887678.1 | PPIA | Peptidyl-prolyl cis-trans isomerase A | 0.52 | .00 | Chaperones |
| 8 | IPI : IPI00013679.1 | DUT | Isoform 1 of Deoxyuridine 5′-triphosphate nucleotidohydrolase, mitochondrial | 0.53 | 0.01 | Hydrolase |
| 9 | IPI : IPI00453473.6 | HIST4H4 | Histone H4 | 0.53 | .01 | Nucleic acid binding |
| 10 | IPI : IPI00794659.1 | RPS20 | 40S ribosomal protein S20 | 0.56 | .01 | Nucleic acid binding |
| 11 | IPI : IPI00441498.1 | FOLR1 | Folate receptor alpha | 0.57 | .00 | Transporter |
| 12 | IPI : IPI00003348.3 | GNB2 | Guanine nucleotide-binding protein G(I)/G(S)/G(T) subunit beta-2 | 0.59 | .02 | Hydrolase |
| 13 | IPI : IPI00027497.5 | GPI | Glucose-6-phosphate isomerase | 0.61 | .00 | Hydrolase |
| 14 | IPI : IPI00216953.1 | LMNA | Isoform ADelta10 of Lamin-A/C | 0.61 | .01 | Cytoskeletal protein |
| 15 | IPI : IPI00472171.3 | RPL7 | 60S ribosomal protein L7 | 0.62 | .04 | Nucleic acid binding |
| 16 | IPI : IPI00419833.8 | HIST1H2BL | Histone H2B type 1-L | 0.62 | .01 | Nucleic acid binding |
| 17 | IPI : IPI00746438.2 | RPL11 | Isoform 2 of 60S ribosomal protein L11 | 0.62 | .01 | Nucleic acid binding |
| 18 | IPI : IPI00219910.2 | BLVRB | Flavin reductase | 0.64 | .04 | Oxidoreductase |
| 19 | IPI : IPI00024915.2 | PRDX5 | Isoform Mitochondrial of Peroxiredoxin-5, mitochondrial | 0.64 | .03 | Oxidoreductase |
| 20 | IPI : IPI00304596.3 | NONO | Non-POU domain-containing octamer-binding protein | 0.65 | .04 | Nucleic acid binding |
| 21 | IPI : IPI00219217.3 | LDHB | L-lactate dehydrogenase B chain | 0.66 | .04 | Oxidoreductase |
| 22 | IPI : IPI00872107.1 | ILF2 | Interleukin enhancer binding factor 2 variant (Fragment) | 0.66 | .03 | Nucleic acid binding |
| 23 | IPI : IPI00329801.12 | ANXA5 | ANXA5 Annexin A5 | 0.66 | .02 | Calcium binding protein |
| 24 | IPI : IPI00299024.9 | BASP1 | Brain acid soluble protein 1 | 0.67 | .01 | Signaling molecule |
| 25 | IPI : IPI00479186.6 | PKM2 | Isoform M1 of Pyruvate kinase isozymes M1/M2 | 0.67 | .03 | Kinase |
| 26 | IPI : IPI00382470.3 | HSP90AA1 | Hsp89-alpha-delta-N | 0.69 | .01 | Chaperones |
| 27 | IPI : IPI00217966.8 | LDHA | L-lactate dehydrogenase A chain | 0.70 | 0.03 | Oxidoreductase |
| 28 | IPI : IPI00220362.5 | HSPE1 | 10 kDa heat shock protein, mitochondrial | 0.71 | .04 | Chaperones |
| 29 | IPI : IPI00027463.1 | S100A6 | S100A6 Protein S100-A6 | 0.72 | .03 | Calcium binding protein |
| 30 | IPI : IPI00553185.2 | CCT3 | T-complex protein 1 subunit gamma | 0.72 | 0.01 | Chaperones |
| 31 | IPI : IPI00873403.1 | RPL24 | 60S ribosomal protein L24 | 0.74 | .01 | Nucleic acid binding |
| 32 | IPI : IPI00003918.6 | RPL4 | 60S ribosomal protein L4 | 0.74 | .03 | Nucleic acid binding |
| 33 | IPI : IPI00216298.6 | TXN | Thioredoxin | 0.74 | .02 | Oxidoreductase |
| 34 | IPI : IPI00472119.2 | RPS3A | 40S ribosomal protein S3a | 0.75 | .01 | Nucleic acid binding |
| 35 | IPI : IPI00014898.3 | PLEC1 | Isoform 1 of Plectin-1 | 0.76 | .00 | Cytoskeletal protein |
| 36 | IPI : IPI00784154.1 | HSPD1 | 60 kDa heat shock protein, mitochondrial | 1.32 | .00 | Chaperones |
| 37 | IPI : IPI00301311.1 | SET | Isoform 2 of Protein SET | 1.32 | .00 | Signaling molecule |
| 38 | IPI : IPI00646512.1 | RBBP7 | Histone-binding protein RBBP7 | 1.33 | .03 | Nucleic acid binding |
| 39 | IPI : IPI00168849.3 | TRIP10 | Isoform 1 of Cdc42-interacting protein 4 | 1.33 | .03 | Cytoskeletal protein |
| 40 | IPI : IPI00856098.1 | RRBP1 | Isoform 1 of Ribosome-binding protein 1 | 1.33 | .01 | Extracellular matrix |
| 41 | IPI : IPI00026216.4 | NPEPPS | Puromycin-sensitive aminopeptidase | 1.34 | .03 | Protease |
| 42 | IPI : IPI00298547.3 | PARK7 | Protein DJ-1 | 1.35 | .00 | Nucleic acid binding |
| 43 | IPI : IPI00420014.2 | SNRNP | Isoform 1 of U5 small nuclear ribonucleoprotein 200 kDa helicase | 1.35 | .03 | Nucleic acid binding |
| 44 | IPI : IPI00396485.3 | EEF1A1 | Elongation factor 1-alpha 1 | 1.36 | .00 | Nucleic acid binding |
| 45 | IPI : IPI00645208.3 | FUS | Isoform Short of RNA-binding protein FUS | 1.37 | .01 | Nucleic acid binding |
| 46 | IPI : IPI00879160.1 | RANBP1 | Ran-specific GTPase-activating protein | 1.38 | .01 | Signaling molecule |
| 47 | IPI : IPI00029079.5 | GMPS | GMP synthase [glutamine-hydrolyzing] | 1.38 | .02 | Transferase |
| 48 | IPI : IPI00019502.3 | MYH9 | Isoform 1 of Myosin-9 | 1.38 | .00 | Cytoskeletal protein |
| 49 | IPI : IPI00009904.1 | PDIA4 | Protein disulfide-isomerase A4 | 1.39 | .03 | Isomerase |
| 50 | IPI : IPI00186290.6 | EEF2 | Elongation factor 2 | 1.39 | .01 | Nucleic acid binding |
| 51 | IPI : IPI00438229.2 | TRIM28 | Isoform 1 of Transcription intermediary factor 1-beta | 1.39 | .01 | Nucleic acid binding |
| 52 | IPI : IPI00333541.6 | FLNA | Isoform 1 of Filamin-A | 1.40 | .00 | Cytoskeletal protein |
| 53 | IPI : IPI00022228.2 | HDLBP | Vigilin | 1.40 | .01 | Transporter |
| 54 | IPI : IPI00747237.1 | NOP16 | HSPC185 | 1.40 | .04 | Signaling molecule |
| 55 | IPI : IPI00012197.1 | DCTPP1 | XTP3-transactivated gene A protein | 1.41 | .04 | Extracellular matrix |
| 56 | IPI : IPI00025252.1 | PDIA3 | Protein disulfide-isomerase A3 | 1.41 | .00 | Isomerase |
| 57 | IPI : IPI00304925.5 | HSPA1B | Heat shock 70 kDa protein 1 | 1.42 | .02 | Chaperones |
| 58 | IPI : IPI00219622.3 | PSMA2 | Proteasome subunit alpha type-2 | 1.42 | .00 | Protease |
| 59 | IPI : IPI00395646.1 | TXNDC5 | MUTED thioredoxin domain containing 5 isoform 2 | 1.43 | .02 | Isomerase |
| 60 | IPI : IPI00147874.1 | NANS | Sialic acid synthase | 1.44 | .02 | Synthase |
| 61 | IPI : IPI00021812.2 | AHNAK | Neuroblast differentiation-associated protein AHNAK | 1.44 | .00 | Signaling molecule |
| 62 | IPI : IPI00789285.1 | TXNDC17 | Thioredoxin domain-containing protein 17 | 1.45 | .01 | Isomerase |
| 63 | IPI : IPI00020599.1 | CALR | Calreticulin | 1.46 | .03 | Calcium binding protein |
| 64 | IPI : IPI00007926.1 | C6orf108 | c-Myc-responsive protein Rcl | 1.46 | .01 | Signaling molecule |
| 65 | IPI : IPI00101037.3 | RCN3 | Reticulocalbin-3 | 1.48 | .01 | Calcium binding protein |
| 66 | IPI : IPI00307162.2 | VCL | Isoform 2 of Vinculin | 1.48 | .01 | Cytoskeletal protein |
| 67 | IPI : IPI00017726.1 | HSD17B10 | Isoform 1 of 3-hydroxyacyl-CoA dehydrogenase type-2 | 1.48 | .00 | Oxidoreductase |
| 68 | IPI : IPI00645078.1 | UBA1 | Ubiquitin-like modifier-activating enzyme 1 | 1.49 | .02 | Signaling molecule |
| 69 | IPI : IPI00844348.1 | PON2 | paraoxonase 2 isoform 1 | 1.51 | .01 | Hydrolase |
| 70 | IPI : IPI00719669.4 | MRLC2 | Myosin regulatory light chain | 1.53 | .01 | Cytoskeletal protein |
| 71 | IPI : IPI00000105.4 | MVP | Major vault protein | 1.53 | .00 | Nucleic acid binding |
| 72 | IPI : IPI00000873.3 | VARS | Valyl-tRNA synthetase | 1.54 | .05 | Synthase |
| 73 | IPI : IPI00871312.1 | NUDC | Putative uncharacterized protein NUDC (Fragment) | 1.55 | .01 | Cytoskeletal protein |
| 74 | IPI : IPI00215637.5 | DDX3X | ATP-dependent RNA helicase DDX3X | 1.56 | .02 | Nucleic acid binding |
| 75 | IPI : IPI00873622.2 | WDR1 | Putative uncharacterized protein WDR1 | 1.58 | .00 | Cytoskeletal protein |
| 76 | IPI : IPI00011937.1 | PRDX4 | Peroxiredoxin-4 | 1.62 | .00 | Oxidoreductase |
| 77 | IPI : IPI00409590.1 | LMO7 | Isoform 1 of LIM domain only protein 7 | 1.64 | .01 | Cytoskeletal protein |
| 78 | IPI : IPI00022793.5 | HADHB | Trifunctional enzyme subunit beta, mitochondrial | 1.65 | .01 | Transferase |
| 79 | IPI : IPI00884896.1 | TXNRD1 | Isoform 1 of Thioredoxin reductase 1, cytoplasmic | 1.67 | .03 | Oxidoreductase |
| 80 | IPI : IPI00020632.4 | ASS1 | Argininosuccinate synthase | 1.73 | .00 | Synthase |
| 81 | IPI : IPI00795408.1 | RPL23 | 60S ribosomal protein L23 | 1.74 | .01 | Nucleic acid binding |
| 82 | IPI : IPI00218343.4 | TUBA1C | Tubulin alpha-1C chain | 1.82 | .02 | Cytoskeletal protein |
| 83 | IPI : IPI00027223.2 | IDH1 | Isocitrate dehydrogenase [NADP] cytoplasmic | 1.82 | .01 | Oxidoreductase |
| 84 | IPI : IPI00015018.1 | PPA1 | Inorganic pyrophosphatase | 1.98 | .00 | Hydrolase |
| 85 | IPI : IPI00910593.1 | CNN2 | Calponin-2 | 2.00 | .01 | Cytoskeletal protein |
| 86 | IPI : IPI00014424.1 | EEF1A2 | Elongation factor 1-alpha 2 | 2.05 | .00 | Nucleic acid binding |
| 87 | IPI : IPI00220642.7 | YWHAG | 14-3-3 protein gamma | 2.07 | .01 | Chaperones |
| 88 | IPI : IPI00745868.3 | ANXA3 | Putative uncharacterized protein ANXA3 (Fragment) | 2.37 | .01 | Calcium binding protein |
| 89 | IPI : IPI00025512.2 | HSPB1 | Heat shock protein beta-1 | 2.69 | .00 | Chaperones |
| 90 | IPI : IPI00027481.1 | ABCB1 | Multidrug resistance protein 1 | 4.38 | .02 | Transporter |
| 91 | IPI : IPI00414264.2 | SRI | sorcin isoform b | 4.90 | .00 | Calcium binding protein |
Figure 2.

Pie chart showing the various functional categories as a percentage of the 91 differentially expressed proteins based on the PANTHER classification system.
3.2. Validation of Differential Expression Proteins
The differential expression levels of the proteins identified by iTRAQ approach were validated using Western blot analysis. In this study, seven proteins including SRI, ABCB1, HSPB1, YWHAG, MVP, MCM3, and MIF were chosen for further analysis. As expected, ABCB1 (P-glycoprotein), one of the differentially expressed proteins identified, was overexpressed in vincristine-resistant gastric cancer cell line SGC7901/VCR. It is well known that expression of ABCB1 is considered as the primary, but not the only, contributing factor to drug resistance in human tumor cells. Figure 3 showed a representative Western blot analysis result of SRI, ABCB1, HSPB1, YWHAG, MVP, MCM3, and MIF expression in the two cell lines. Compared with SGC7901, vincristine-resistant gastric cancer cell line SGC7901/VCR had an obvious up-regulation of SRI, ABCB1, HSPB1, YWHAG, and MVP, and a marked down-regulation of MCM3 and MIF. This trend is similar to their protein expression level obtained in iTRAQ approach.
Figure 3.
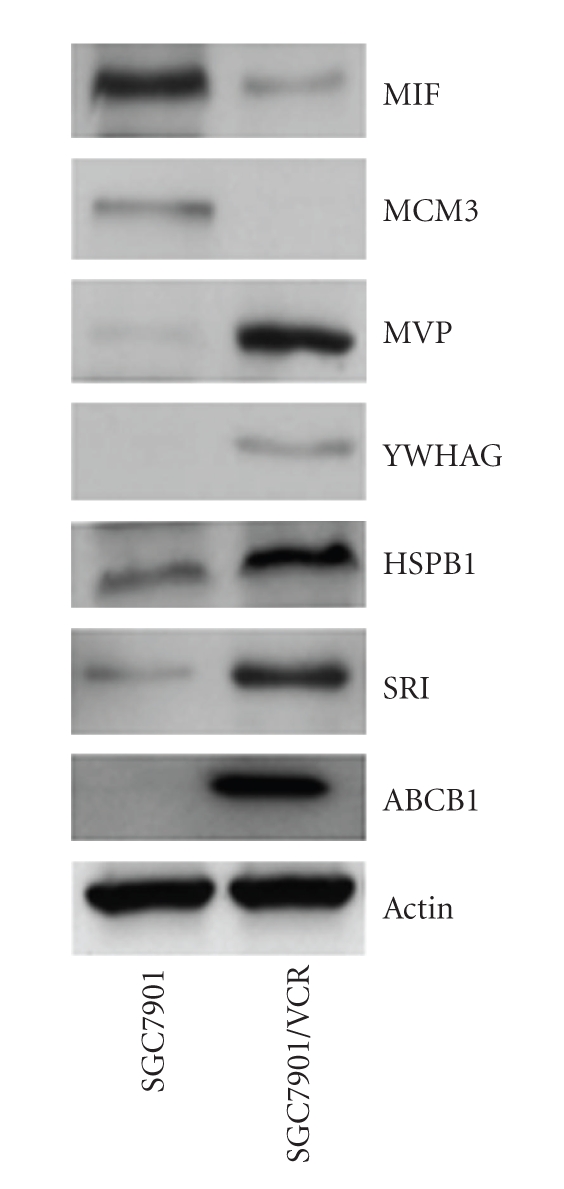
A representative Western blot analysis result of SRI, ABCB1, HSPB1, YWHAG, MVP, MCM3, and MIF expression in the two cell lines. Compared with SGC7901, vincristine-resistant SGC7901/VCR had an obvious up-regulation of SRI, ABCB1, HSPB1, YWHAG, and MVP, and a marked down-regulation of MCM3 and MIF.
3.3. The Association of MVP with MDR
To study the functional role of MVP up-regulation in SGC7901/VCR, we did an experiment to ectopically overexpress MVP in SGC7901 followed by determining the possible changes in mutidrug resistance. Firstly, we cloned the full-length MVP cDNA into pcDNA3.1, and transfected it into the parental drug-sensitive SGC7901 cells. As shown in Figure 4(a), two stable clones with overexpression of ectopic MVP were generated. Then these clones with overexpression of MVP were subjected to drug resistance analysis using the MTT assay. As shown in Figure 4(b), overexpression of ectopic MVP caused resistance to both vincristine and adriamycin, with significant increase in cell viability. The above results showed that the increased expression of MVP in the vincristine-resistant SGC7901/VCR cells contributed significantly to the observed drug resistance phenotype in these cells. To further determine if the decreased expression of MVP potentially restores chemosensitivity of SGC7901/VCR, we also transfected the MVP siRNA to SGC7901/VCR cells. As showed in Figure 5, MVP siRNA transfection could significantly decrease the cell viability of SGC7901/VCR after incubated with 1 mg/L vincristine and 0.8 mg/L adriamycin for 24 hours, compared with control siRNA. All these clearly demonstrated that MVP involved in multidrug resistance in gastric cancer.
Figure 4.

The effect of enforced expression of MVP on drug resistance in SGC7901 cells. (a) Western blot analysis showed that two stable clones with overexpression of ectopic MVP were generated. Subsequently, MTT assay showed that overexpression of ectopic MVP could result in vincristine and adriamycin resistance, with the significant increase of the cell viability (b). The experiment was repeated in triplicate. Points: mean viable cells (% of control) from three experiments; bars: SE *: P ≤ .05 differ from control by t-test.
Figure 5.

The effect of MVP siRNA treatment on chemosensitivity in SGC7901/VCR cells. (a) Western blot analysis showed that treatment of SGC7901/VCR cells with MVP siRNA significantly reduced MVP protein levels, whereas MVP protein expressions was not significantly suppressed by control siRNA. (b) MTT assay showed that MVP siRNA transfection could significantly decrease the cell viability of SGC7901/VCR cells incubated with adriamycin and vincristine. The experiment was repeated in triplicate. Points, mean viable cells (% of control) from three experiments; bars, SE. *, P ≤ .05 differ from control by t-test. Oligofectamine, cells treated with oligofectmine only.
4. Discussion
Quantitative proteomics has been proved to be a usefultechnique for investigation of the molecular mechanism in cancer. With regard to relative and absolute quantification (iTRAQ) analysis, which is currently the most widely used approach for high throughput protein quantitation, enables simultaneous quantitation of up to 8 different biological samples [11]. The aim of this study was to gain insight into the molecular mechanisms of multidrug resistance in gastric cancer. So we used iTRAQ proteomic approach to identify proteins with differential expression between the parental drug-sensitive SGC7901 and vincristine-resistant SGC7901/VCR cells. As a result, 91 proteins with significant alterations in expression between the two cell lines were identified. The seven of them, that is, SRI, ABCB1, HSPB1, YWHAG, MVP, MCM3, and MIF were confirmed using Western blot analysis. We further validated the functional role in drug resistance of one protein, MVP, highly expressed in SGC7901/VCR, and found overexpression of MVP could contribute considerably to the drug resistance in gastric cancer cell. In addition, interestingly enough, our approach led to the identification of ABCB1 (P-glycoprotein), which was highly correlated with MDR, but never reported before in proteomic studies on tumor MDR owing to its inherently hydrophobic nature and low abundance of membrane proteins [12]. It provides evidence that the iTRAQ reagents labeling method for the large scale protein quantification was powerful and reliable. Based on the PANTHER classification system, all the 91 proteins could be classified into 14 functional categories. We discuss some of the key proteins discovered in this work in the following text.
Among the nucleic acid binding proteins identified, the level of major vault protein (MVP) markedly increased in vincristine-resistant SGC7901/VCR. The expression level changes of MVP were also confirmed by Western blot analysis. Major vault protein is the main component of ubiquitous cellular ribonucleoprotein particles called vaults [13, 14]). Increased levels of MVP are found in many human cancer cell lines, characterized as a MDR phenotype [15]. It led to the assumption of a possible role for MVP in mechanisms of MDR. Treatment of colon cancer cell lines SW620 with sodium butyrate induced MVP expression, which resulted in an increase of the resistance to doxorubicin. Moreover anti-MVP polyclonal antibody reversed this drug resistance [16]. These findings suggested that MVP may be involved in drug resistance. However, the role for MVP in the development of MDR has been disputed. Drug resistance is not conferred when vault particles are produced in the MVP-transfected ovarian cancer cell line AC16 [17]. In addition, treatment of MVP wild-type and deficient mice with the anthracycline doxorubicin, Mossink et al. found that both groups of mice responded similarly to the doxorubicin treatment [18]. In our study, to investigate the functional role of MVP up-regulation in SGC7901/VCR, the full-length MVP cDNA was transfected into the parental drug-sensitive SGC7901 cells. We demonstrated that the overexpression of ectopic MVP in parental cell line SGC7901 can confer resistance to both vincristine and adriamycin. Furthermore, when suppression of MVP expression using MVP siRNA in SGC7901/VCR cells, the cells increased the sensitivity to vincristine and adriamycin. Therefore, our results supported MVP correlated with chemotherapeutic resistance in gastric cancer. We also found that the expression of 6 ribosomal proteins (RPS20, RPL7, RPL11, RPL24, RPL4, RPS3A) were decreased and 1 protein (RPL23) was significantly enhanced in vincristine-resistant SGC7901/VCR. Recently it has been shown that some of ribosomal proteins can exhibit various secondary functions besides protein synthesis [19, 20]. Using differential display PCR Shi et al. identified RPS13 and RPL23 as two up-regulated genes in multidrug-resistant gastric cancer cells. In addition, they further demonstrated that RPS13 and RPL23 can promote MDR in gastric cancer cells by suppressing drug-induced apoptosis, and RPL23 may also promote MDR through regulation of glutathione S-transferase-mediated drug-detoxifying system [21]. Ribosomal 28S and ribosomal S15a also were identified when comparing the differentially expressed gene profiles between human head and neck carcinoma cell line UMSCC10b and its cisplatin-resistant counterpart UMSCC10b/Pt-S15 [22]. These data suggest a role for ribosomal proteins in tumor MDR.
The expressions of eight calcium-binding proteins obviously changed in SGC7901/VCR. Soluble resistance-related calcium-binding protein (Sorcin), which has four typical “E-F” hand structures of calcium-binding sites, was highly expressed in vincristine-resistant SGC7901/VCR. In our previous studies, siRNA-mediated sorcin loss in the SGC7901/VCR cells led to an increased sensitivity to vincristine. Furthermore, transfection of full-length sorcin gene to SGC7901 cells can cause resistance to vincristine [23]. It was obvious that the overexpression of sorcin was involved in the MDR phenotype of SGC7901/VCR. Programmed cell death protein 6 (ALG-2) was originally discovered as a gene to participate in T cell receptor-, Fas-, and glucocorticoid-induced programmed cell death [24, 25]. Transfection of T cells with antisense RNA of ALG-2, apoptosis induced by a variety of stimuli was blocked [24]. However, ALG-2 has been shown to be up-regulated in a variety of human tumors questioning its pro-apoptotic function. Rencently, Hoj et al. reported that ALG-2 down-regulation induced accumulation of HeLa cells in the G2/M cell cycle phase and increased the amount of early apoptotic and dead cells [26]. Nevertheless, in our experiment, ALG-2 was sharply decreased in vincristine-resistant SGC7901/VCR, which supported the previously published results demonstrating proapoptotic functions of ALG-2. It is therefore important in further research to address the question of whether down-regulation of ALG-2 will enhance the viability of gastric cancer cells.
One of the major differentially expressed proteins groups is chaperones, such as HSPB1, HSPD1, HSPA1B, HSPE1, and YWHAG, expression level changes of which were obvious in SGC7901/VCR as compared with SGC7901. It has been reported HSPD1 was overexpression in 3 different cell model systems including cisplatin-resistant ovarian cancer, oxaliplatin-resistant ovarian cancer, and cisplatin-resistant bladder cancer [27]. Work by our group also showed that HSPD1 was overexpressed in cisplatin-resistant ovarian cancer cell line COC1/DDP. Furthermore, HSPD1 siRNA transfection could significantly decrease the cell viability of COC1/DDP cells incubated with cisplatin, which supported that the increased expression of HSPD1 was correlated with the MDR of cancer cells (see [5] in press). 14-3-3 protein gamma (YWHAG) belongs to the high conserved and ubiquitous 14-3-3 protein family that participates in a wide variety of cellular processes [28]. 14-3-3 gamma has not previously been linked to chemoresistance. However, elevated levels of 14-3-3 gamma may confer resistance to microtubule inhibitors and enable cells to reenter the cell cycle in the absence of mitosis [29]. Hermeking et al. discovered that 14-3-3 sigma is strongly induced by gamma irradiation and other DNA-damaging agents [30]. In addition, inhibition of 14-3-3 sigma may sensitize human lung cancers to ionizing radiation [31]. In light of the function of 14-3-3 gamma above, it is conceivable that over-expression of 14-3-3 gamma in vincristine-resistant SGC7901/VCR may be important for cells to escape injury of chemotherapeutic agents.
We showed that argininosuccinate synthase (ASS1), which catalyzes the penultimate step of the arginine biosynthetic pathway, was overexpressed in vincristine-resistant SGC7901/VCR. Down-regulation of ASS1 expression has been implicated in resistance to platinum in a series of patients with ovarian cancer treated with platinum-based adjuvant chemotherapy [32]. Nicholson et al. demonstrated ASS1 silencing resulted in a significant increase in resistance to carboplatin, while resistance to taxol was unchanged [33]. This is obvious that decrease of ASS1 only conferred selective resistance to platinum-based drugs. The correlation between ASS1 and MDR in vincristine-resistant SGC7901/VCR needs further study. Oxidoreductase, such as Thioredoxin, Peroxiredoxin-4, Isocitrate dehydrogenase (NADP) cytoplasmic, Isoform 1 of Thioredoxin reductase 1, and Glutathione S-transferase Mu 1, were closely correlated with the development of MDR. Inside cells, GSH and thioredoxin represented the major reducing agents, detoxification of which was commonly recognized as one of the major mechanisms of MDR [34].
This is the first comprehensive study of the multidrug resistance mechanisms in gastric cancer using iTRAQ proteomics approach. In total, 820 unique proteins were identified and 91 proteins were differentially expressed proteins by at least 1.3-fold in SGC7901/VCR versus SGC7901. Then the differential expression levels of partially identified proteins were confirmed by western blot analysis. Furthermore, the association of MVP, one of the highly expressed proteins in SGC7901/VCR, with MDR was verified. This study revealed many novel proteins that have not been associated with MDR in gastric cancer before, and thus new targets are provided for future development of MDR reversing drugs.
Acknowledgments
This work was supported by the program for Changjiang Scholars and Innovative Research Team in University (no. IRT0872) and the National Natural Science Foundation of China (no. 30572116, 30672389, 30771923, 30801348, and 30872250). H.-D. Hu and F. Ye are contributed equally.
References
- 1.Parkin DM, Bray F, Ferlay J, Pisani P. Global cancer statistics, 2002. CA: A Cancer Journal for Clinicians. 2005;55(2):74–108. doi: 10.3322/canjclin.55.2.74. [DOI] [PubMed] [Google Scholar]
- 2.Zhang D, Fan D. Multidrug resistance in gastric cancer: recent research advances and ongoing therapeutic challenges. Expert Review of Anticancer Therapy. 2007;7(10):1369–1378. doi: 10.1586/14737140.7.10.1369. [DOI] [PubMed] [Google Scholar]
- 3.Dietel M. Molecular mechanisms and possibilities of overcoming drug resistance in gastrointestinal tumors. Recent Results in Cancer Research. 1996;142:89–101. doi: 10.1007/978-3-642-80035-1_7. [DOI] [PubMed] [Google Scholar]
- 4.Yang YX, Xiao ZQ, Chen ZC, et al. Proteome analysis of multidrug resistance in vincristine-resistant human gastric cancer cell line SGC7901/VCR. Proteomics. 2006;6(6):2009–2021. doi: 10.1002/pmic.200402031. [DOI] [PubMed] [Google Scholar]
- 5.Li X, Zhang Y, Xiong C, et al. Overexpression of a new gene p28GANK confers multidrug resistance of gastric cancer cells. Cancer Investigation. 2009;27(2):129–139. doi: 10.1080/07357900802189816. [DOI] [PubMed] [Google Scholar]
- 6.Gorg A, Drews O, Luck C, Weiland F, Weiss W. 2-DE with IPGs. Electrophoresis. 2009;30(supplement 1):S122–S132. doi: 10.1002/elps.200900051. [DOI] [PubMed] [Google Scholar]
- 7.Weiss W, Görg A. Sample solublization buffers for two-dimensional electrophoresis. Methods in Molecular Biology. 2008;424:35–42. doi: 10.1007/978-1-60327-064-9_3. [DOI] [PubMed] [Google Scholar]
- 8.Hu L, Ye M, Zou H. Recent advances in mass spectrometry-based peptidome analysis. Expert Review of Proteomics. 2009;6(4):433–447. doi: 10.1586/epr.09.55. [DOI] [PubMed] [Google Scholar]
- 9.Leitner A, Lindner W. Chemical tagging strategies for mass spectrometry-based phospho-proteomics. Methods in Molecular Biology. 2009;527:229–243. doi: 10.1007/978-1-60327-834-8_17. [DOI] [PubMed] [Google Scholar]
- 10.Plumb JA, Milroy R, Kaye SB. Effects of the pH dependence of 3-(4,5-dimethylthiazol-2-yl)-2,5-diphenyltetrazolium bromide-formazan absorption on chemosensitivity determined by a novel tetrazolium-based assay. Cancer Research. 1989;49(16):4435–4440. [PubMed] [Google Scholar]
- 11.Guo T, Gan CS, Zhang H, Zhu Y, Kon OL, Sze SK. Hybridization of pulsed-Q dissociation and collision-activated dissociation in linear ion trap mass spectrometer for iTRAQ quantitation. Journal of Proteome Research. 2008;7(11):4831–4840. doi: 10.1021/pr800403z. [DOI] [PubMed] [Google Scholar]
- 12.Baumert C, Hilgeroth A. Recent advances in the development of P-gp inhibitors. Anti-Cancer Agents in Medicinal Chemistry. 2009;9(4):415–436. doi: 10.2174/1871520610909040415. [DOI] [PubMed] [Google Scholar]
- 13.Dickenson NE, Moore D, Suprenant KA, Dunn RC. Vault ribonucleoprotein particles and the central mass of the nuclear pore complex. Photochemistry and Photobiology. 2007;83(3):686–691. doi: 10.1111/j.1751-1097.2007.00050.x. [DOI] [PubMed] [Google Scholar]
- 14.van Zon A, Mossink MH, Scheper RJ, Sonneveld P, Wiemer EAC. The vault complex. Cellular and Molecular Life Sciences. 2003;60(9):1828–1837. doi: 10.1007/s00018-003-3030-y. [DOI] [PMC free article] [PubMed] [Google Scholar]
- 15.Kickhoefer VA, Rajavel KS, Scheffer GL, Dalton WS, Scheper RJ, Rome LH. Vaults are up-regulated in multidrug-resistant cancer cell lines. Journal of Biological Chemistry. 1998;273(15):8971–8974. doi: 10.1074/jbc.273.15.8971. [DOI] [PubMed] [Google Scholar]
- 16.Kitazono M, Okumura H, Ikeda R, et al. Reversal of LRP-associated drug resistance in colon carcinoma SW-620 cells. International Journal of Cancer. 2001;91(1):126–131. doi: 10.1002/1097-0215(20010101)91:1<126::aid-ijc1018>3.0.co;2-8. [DOI] [PubMed] [Google Scholar]
- 17.Siva AC, Raval-Fernandes S, Stephen AG, et al. Up-regulation of vaults may be necessary but not sufficient for multidrug resistance. International Journal of Cancer. 2001;92(2):195–202. doi: 10.1002/1097-0215(200102)9999:9999<::aid-ijc1168>3.0.co;2-7. [DOI] [PubMed] [Google Scholar]
- 18.Mossink MH, van Zon A, Franzel-Luiten E, et al. Disruption of the murine major vault protein (MVP/LRP) gene does not induce hypersensitivity to cytostatics. Cancer Research. 2002;62(24):7298–7304. [PubMed] [Google Scholar]
- 19.de la Pena M, Dufour D, Gallego J. Three-way RNA junctions with remote tertiary contacts: a recurrent and highly versatile fold. RNA. 2009;15(11):1949–1964. doi: 10.1261/rna.1889509. [DOI] [PMC free article] [PubMed] [Google Scholar]
- 20.Wool IG, Chan YL, Gluck A. Structure and evolution of mammalian ribosomal proteins. Biochemistry and Cell Biology. 1995;73(11-12):933–947. doi: 10.1139/o95-101. [DOI] [PubMed] [Google Scholar]
- 21.Shi Y, Zhai H, Wang X, et al. Ribosomal proteins S13 and L23 promote multidrug resistance in gastric cancer cells by suppressing drug-induced apoptosis. Experimental Cell Research. 2004;296(2):337–346. doi: 10.1016/j.yexcr.2004.02.009. [DOI] [PubMed] [Google Scholar]
- 22.Johnsson A, Zeelenberg I, Min Y, et al. Identification of genes differentially expressed in association with acquired cisplatin resistance. British Journal of Cancer. 2000;83(8):1047–1054. doi: 10.1054/bjoc.2000.1420. [DOI] [PMC free article] [PubMed] [Google Scholar]
- 23.Yang YX, Chen ZC, Zhang GY, Yi H, Xiao ZQ. A subcelluar proteomic investigation into vincristine-resistant gastric cancer cell line. Journal of Cellular Biochemistry. 2008;104(3):1010–1021. doi: 10.1002/jcb.21687. [DOI] [PubMed] [Google Scholar]
- 24.Lacana E, Ganjei JK, Vito P, D’Adamio L. Dissociation of apoptosis and activation of IL-1β-converting enzyme/ced-3 proteases by ALG-2 and the truncated Alzheimer’s gene ALG-3. Journal of Immunology. 1997;158(11):5129–5135. [PubMed] [Google Scholar]
- 25.Vito P, Lacaná E, D’Adamio L. Interfering with apoptosis: Ca2+-binding protein ALG-2 and Alzheimer’s disease gene ALG-3. Science. 1996;271(5248):521–525. doi: 10.1126/science.271.5248.521. [DOI] [PubMed] [Google Scholar]
- 26.Hoj BR, la Cour JM, Mollerup J, Berchtold MW. ALG-2 knockdown in HeLa cells results in G2/M cell cycle phase accumulation and cell death. Biochemical and Biophysical Research Communications. 2009;378(1):145–148. doi: 10.1016/j.bbrc.2008.11.021. [DOI] [PubMed] [Google Scholar]
- 27.Abu-Hadid M, Wilkes JD, Elakawi Z, Pendyala L, Perez RP. Relationship between heat shock protein 60 (HSP6O) mRNA expression and resistance to platinum analogues in human ovarian and bladder carcinoma cell lines. Cancer Letters. 1997;119(1):63–70. doi: 10.1016/s0304-3835(97)00255-3. [DOI] [PubMed] [Google Scholar]
- 28.Morrison DK. The 14-3-3 proteins: integrators of diverse signaling cues that impact cell fate and cancer development. Trends in Cell Biology. 2009;19(1):16–23. doi: 10.1016/j.tcb.2008.10.003. [DOI] [PMC free article] [PubMed] [Google Scholar]
- 29.Qi W, Liu X, Chen W, Li Q, Martinez JD. Overexpression of 14-3-3γ causes polyploidization in H322 lung cancer cells. Molecular Carcinogenesis. 2007;46(10):847–856. doi: 10.1002/mc.20314. [DOI] [PubMed] [Google Scholar]
- 30.Hermeking H, Lengauer C, Polyak K, et al. 14-3-3σ is a p53-regulated inhibitor of G2/M progression. Molecular Cell. 1997;1(1):3–11. doi: 10.1016/s1097-2765(00)80002-7. [DOI] [PubMed] [Google Scholar]
- 31.Qi W, Martinez JD. Reduction of 14-3-3 proteins correlates with increased sensitivity to killing of human lung cancer cells by ionizing radiation. Radiation Research. 2003;160(2):217–223. doi: 10.1667/rr3038. [DOI] [PubMed] [Google Scholar]
- 32.Helleman J, Jansen MP, Span PN, et al. Molecular profiling of platinum resistant ovarian cancer. International Journal of Cancer. 2006;118(8):1963–1971. doi: 10.1002/ijc.21599. [DOI] [PubMed] [Google Scholar]
- 33.Nicholson LJ, Smith PR, Hiller L, et al. Epigenetic silencing of argininosuccinate synthetase confers resistance to platinum-induced cell death but collateral sensitivity to arginine auxotrophy in ovarian cancer. International Journal of Cancer. 2009;125(6):1454–1463. doi: 10.1002/ijc.24546. [DOI] [PubMed] [Google Scholar]
- 34.Naito S, Yokomizo A, Koga H. Mechanisms of drug resistance in chemotherapy for urogenital carcinoma. International Journal of Urology. 1999;6(9):427–439. doi: 10.1046/j.1442-2042.1999.00088.x. [DOI] [PubMed] [Google Scholar]