

Abstract
False-positive or false-negative results attributable to undetected genotyping errors and confounding factors present a constant challenge for genome-wide association studies (GWAS) given the low signals associated with complex phenotypes and the noise associated with high-throughput genotyping. In the context of the genetics of kidneys in diabetes (GoKinD) study, we identify a source of error in genotype calling and demonstrate that a standard battery of quality-control (QC) measures is not sufficient to detect and/or correct it. We show that, if genotyping and calling are done by plate (batch), even a few DNA samples of marginally acceptable quality can profoundly alter the allele calls for other samples on the plate. In turn, this leads to significant differential bias in estimates of allele frequency between plates and, potentially, to false-positive associations, particularly when case and control samples are not sufficiently randomized to plates. This problem may become widespread as investigators tap into existing public databases for GWAS control samples. We describe how to detect and correct this bias by utilizing additional sources of information, including raw signal-intensity data.
Main Text
The results reported here were obtained in the QC phase of data analysis from the GoKinD study comprising DNA samples and more than 300 dichotomous and quantitative variables related to nephropathy (the primary phenotype), neuropathy, retinopathy, and cardiovascular disease; these data were collected from more than 1,800 probands with long-standing (10+ years) type 1 diabetes (T1D). After selection for GWAS by the Genetic Association Information Network (GAIN),1 the DNA samples were distributed across 34 plates and genotyped on the Affymetrix Genome-Wide Human SNP Array 5.0 platform (see Web Resources). Probands were screened into two primary phenotype categories: those with definitive kidney disease (cases) and those without (controls). In addition, DNA and phenotype data were collected from parents of 582 probands. Altogether, more than 3,000 samples were available for genotyping. The data on a subset of 1,825 individuals containing genotype calls in ∼460K SNPs, primary phenotypes, and raw probe intensity (.CEL) files were made available in September of 2007 to qualified investigators through dbGaP2 (see Web Resources) after NIH review of the investigator request form.
The high cost of such large-scale sample and phenotype collection and genotyping, the recognition that genetic risk factors for phenotypes corresponding to diabetic complications are expected to be of the same low to moderate magnitude as those estimated for other complex phenotypes,3 and the fact that the GoKinD study will be a widely used public resource highlight the importance of thorough QC testing. Although the significance of QC analysis has been noted in several GWAS3–5 and a number of steps6–9 have emerged as a guideline for QC of GWAS, addressing QC in the context of data obtained from a public source is somewhat different from conducting QC in an experiment that is totally under the control of the investigator. In the former, the investigator has no input on decisions made previously, such as the choice of platform, allele-calling algorithm, allele-calling protocol (e.g., calling genotypes over the entire sample, smaller batches, or by plate), or the randomization of subjects across plates. Although quality public resources, such as dbGaP, provide detailed information on experimental design as well as probe-intensity data (e.g., .CEL files generated by the Affymetrix platforms) and thus facilitate the development of innovative QC methods, this is by no means a universal practice in current data-sharing protocols. Our goal is to maximize quality, and elucidate limitations, of data obtained from such sources outside of the control of the investigator.
The QC analysis for GoKinD was carried out both at NCBI with the GAINQC software package (see Web Resources) prior to data release and by individual investigators. Alleles were called in batches by plate at the Broad Institute with the Birdseed version 2 software10 (see Web Resources). Filtering criteria applied to SNPs in the full GoKinD data included a call rate >95%, an HWE test p value >10−7, and a number of Mendelian incompatibilities <3. Genotyped SNPs that had a known physical map position and that passed these QC filters (427,350) were used in subsequent analyses. Summary statistics based on the filtered data, as well as results of a plate-effect test for assessing heterogeneity in allele frequencies across plates, were also made available to investigators requesting GoKinD data.
It was apparent from the beginning that the QC at NCBI might not have been sufficient to identify and correct all data problems: the quantile-quantile (Q-Q) plot of the observed versus expected p values for the allelic tests of association in nephropathy cases and controls showed a notable excess of significant p values at or below the level of 10−4 (Figure 1D). Because the initial QC tests of GoKinD data at NCBI were performed with all available samples (including related and duplicated individuals and those with different self-reported ethnicity), we chose to repeat the analyses correcting for these potential biases and conduct several additional QC tests. Moreover, the plate-effect test was based on the GAINQC allelic association test with n − 1 degrees of freedom (df), where n is the total number of plates (n = 34 in our case). Hence, although this test has identified a number of SNPs with heterogeneity in allele-frequency estimates across all plates, it was inappropriate for identifying SNPs with biased allele frequencies on a single plate. Therefore, we also designed a different test for plate effect.
Figure 1.
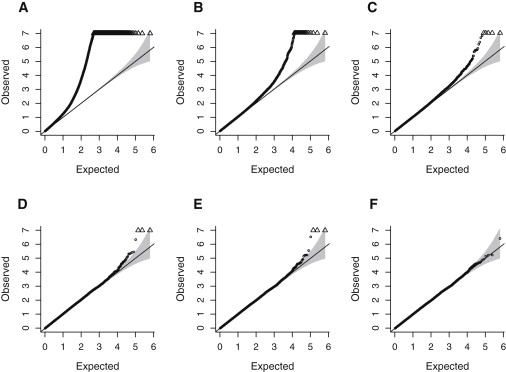
Q-Q Plots of the −log10(p Value) for the Plate and Primary-Phenotype Association Test
The 1 df plate effect (top row) and phenotype association (bottom row) are shown under the following three QC scenarios: (A and D) standard QC, (B and E) standard QC plus removal of the problem samples, and (C and F) standard QC plus removal of the problem samples and recall of the affected plate. Triangles at the top of the plot represent p values < 10−7. The shaded region corresponds to the 95% concentration band as computed by the function qq.chisq of the R package snp.matrix (see Web Resources).
We began with a set of unrelated probands who reported themselves to be of recent European ancestry, and we proceeded with those samples that achieved a call rate of >90% (1,661 of the original sample of 1,825) because many of the QC studies use allele frequencies estimated from the data in subsequent calculations, and sample substructure can yield misleading results.11 As might be expected in a data set this large, sex misspecifications (two) and either duplicates or close relatives (eight, with a pairwise proportion of identity by descent [IBD] estimate ) were identified with PLINK12 options sex-check and genome, respectively, and removed, leaving 1651 samples for subsequent analyses. We also used PLINK to estimate call rates by individual and by SNP, to calculate average heterozygosity (across all SNPs) for each individual, and to assess the fit of the observed genotype distributions for each SNP to those expected under Hardy-Weinberg equilibrium (HWE) (Figure S1 available online).
We conducted plate-effect tests for each plate separately by comparing allele frequencies estimated for the samples from a single plate to those estimated for all other samples. Each of these tests is a χ2 test with 1 df, as opposed to the 33 df test run at NCBI, and therefore is more appropriate for pinpointing problems with a particular plate. We identified plate 4RWG569 as having contributed disproportionately to the excess of significant plate-effect p values (Figure 1A); in particular, 732 autosomal SNPs were significantly associated (p value < 10−7) with it, in stark contrast to the rest of the plates, in which the median number of plate-associated SNPs at the level of 10−7 or below was equal to four. In plate-effect analyses, as well as in the subsequent analysis of the primary phenotype, we employed a basic test of allelic association as implemented in PLINK. SNPs with minor allele frequency (MAF) <1% and X-linked SNPs were omitted.
We also discovered a pattern of genetically impossible relationships among a set of eight individuals; any pair of individuals in the set had a value of just under 0.25, and estimated probabilities P(IBD = 2) ≈ 0.25, P(IBD = 1) ≈ 0, and P(IBD = 0) ≈ 0.75. The values were significantly higher for these same individuals (on average, 42% versus 32% for the rest of GoKinD subjects, leading to a two-sample t test p value <10−13). In addition, these eight individuals were estimated to be related to all other individuals in the sample at about the level of a second cousin (P(IBD = 2) ≈ 0, P(IBD = 1) ≈ 0.25, and P(IBD = 0) ≈ 0.75; ). A key observation was that all eight samples in question were genotyped on the same plate, 4RWG569.
A preliminary GWA analysis of the nephropathy phenotype conducted on the 1651 samples comprising 804 cases and 847 controls also revealed an excess of SNPs with association p value of <10−4. Moreover, we observed three SNPs (denoted as triangles on Figures 1D and 1E) meeting genome-wide criteria for significance (p value < 10−8). Notably, all of these SNPs had significantly different estimates of allele frequency on plate 4RWG569 than on other plates (p value < 10−200).
We hypothesized that the eight “problem” samples were likely to have contributed to the excess of significant association with the primary phenotype (Figure 1D) because all of them were assigned a nephropathy case status. However, removing them from the analysis did not correct the problem. After the eight samples were removed, the overall excess of SNPs associated with both primary phenotype and plate was largely unchanged (Figures 1B and 1E), although the total number of SNPs with highly significant (p value < 10−7) allele frequency differences on plate 4RWG569 dropped to 28 (from 732).
To help elucidate the source of differential allele frequency bias, we constructed cluster plots for the 28 SNPs with strongest plate association by using normalized allele intensities (so-called allele A and B signals). We obtained the allele A and B signals from available .CEL files by using the apt-probeset-genotype application of the Affymetrix Power Tools (APT) software package (see Web Resources). On the basis of our analysis of cluster plots, we concluded that the reason behind the differential plate bias was extreme allele frequency distortion in genotype calls for all samples on this plate and that this distortion was caused by abnormal clustering of the eight poor-quality samples. Typical patterns of MAF distortion are shown in Figures 2B–2E; the remaining cluster plots appear in Figure S2, available online.
Figure 2.
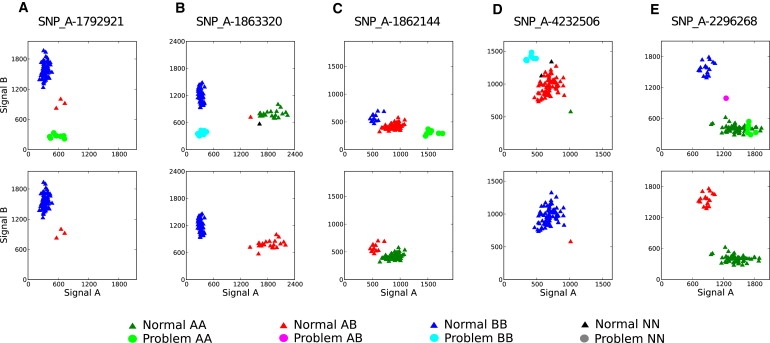
Normalized Signal-Intensity Plots Showing Allele-Frequency Distortion Caused by the Cluster of Problem Samples
The top row corresponds to the original assignment of genotypes on the plate; the bottom row corresponds to the same plate recalled without the problem samples. The SNPs were chosen to have a highly significant plate bias in the original data (p value < 10−11). (A) A typical configuration for a failed Sty SNP in which only the eight problem samples were assigned incorrect genotypes (included for comparison). The other plots represent several configurations leading to genotype misspecifications for the entire plate: (B) an Sty SNP, (C) an Nsp SNP, (D) an Nsp/Sty SNP with the effect similar to an Nsp SNP, and (E) an Nsp/Sty SNP showing the effect of a single sample misclassified as a new cluster. The SNP in (D) is one of three that meets genome-wide criteria for significance (p value < 10−8) in the original data.
Differential genotyping bias has been shown to drive the false-positive rate in previous studies;13,14 here we found that the distortion in genotype calls was exacerbated by the imbalance of cases (83 out of 86 samples) on the plate. This combination led to the excess of false-positive signals in the primary phenotype analysis. In order to correct this bias, we had to recall the genotypes for all samples on the after removing the eight bad ones. The subsequent test for plate and genotype association and primary phenotype GWA study showed marked improvement in the number of false positives (Figures 1C and 1F): only five SNPs crossed the threshold for significant plate association, which is consistent with chance variability, and the overall excess of significant signals, including evidence for genome-wide significant associations with nephropathy, disappeared (Figure 1F).
Because of how dramatically a small number of low-quality samples within an otherwise high-quality set called by plate can affect genotype calls, it is critical to identify poorly performing samples before genotypes are called even when the source of the quality problem in the samples is not immediately obvious. Although the normalized allele intensities proved indispensable in pinpointing the source of differential bias, these alone are not sufficient to allow detection of the problematic samples prior to allele calling and, in fact, may look misleadingly “normal” (see Figure S3) even for the most egregious samples. Instead, we resorted to using raw (pre-normalized) intensity data.
Two methods of identifying and filtering out low-quality DNA samples prior to allele calling were applied to GoKinD data. The first method, referred to as Contrast QC (CQC), was developed by Affymetrix in the context of QC assessment of the SNP Array 6.0 data and implemented in the Genotyping Console (GTC) 2.1 and APT packages (application apt-geno-qc). For each SNP, a CQC metric defined as a function of the allelic contrast
measures the extent of separation of allele intensities into three clusters of AA, AB, and BB genotypes. Here, IA and IB are the median raw intensity values for the allele A and B probeset, respectively. CQC summary scores are calculated for four pre-selected panels: a random set of 9,340 SNPs for testing the overall quality of the sample, two sets of 20,000 enzyme-specific (Nsp or Sty) SNPs, and a set of 20,000 SNPs occurring on both Nsp and Sty fragments. The enzyme-specific panels appear to have been selected to include the tails of the distribution of the restriction fragment lengths for the entire set of enzyme-specific SNPs (see Figure S4) so that the information obtained from a smaller set of SNPs can be maximized. According to the Affymetrix white paper (see Web Resources), CQC score values below 0.4 correspond to insufficient cluster separation and thus to a low call rate. In addition, a difference of 2.0 or greater between the enzyme-specific scores indicates a possible single-enzyme target preparation failure. We employed the latter feature to detect problems with sample quality prior to recalling genotypes.
In order for the application to work with the GoKinD SNP Array 5.0 data, the .QCC library file containing pre-selected panels of Array 6.0 SNPs was modified to include only a subset of the panel SNPs represented on the SNP Array 5.0 platform such that on the 5.0 platform these SNPs were assayed with a probe pair from the same strand and offset (such probes are so-called paired probes). The resulting SNP Array 5.0 “partial” .QCC file contains 3,147 random, 3,532 Nsp-only, 2,952 Sty-only, and 4,477 Nsp/Sty SNPs. We also constructed a “full” .QCC file based on the information on SNP and enzyme pairing available in the NetAffx annotation file and replaced the panel sets with their counterparts from the entire collection of paired probes. Both the partial and the full .QCC files are available upon request from the authors.
The second test, referred to as Skewness QC (SQC), is based on the asymmetry of the log-transformed distribution of IA and IB values measured by Pearson's skewness coefficient , where mean, median, and SD are calculated over the combined set of log-transformed IA and IB values. We applied this test to the enzyme-specific SNP panels defined above and observed that typical values of s lie in the range of −0.1 < s < 0.1; outliers are mostly in the direction of high positive s (skewness to the right), corresponding to an excess of low-intensity probes. If both sNsp and sSty have this property, it might indicate an overall low sample quality or, if only one of the enzyme-specific scores is out of bounds, a single target-preparation failure. Note that the range of values of s is clearly specific to the data and SNP panel; hence, the threshold of 0.1 above should not be viewed as a universal cutoff but rather as a suggestive value.
We applied SQC and CQC tests to the GoKinD data by using both the partial and full SNP panels (for results, see Table S1). In all four scenarios, the eight problem samples were successfully identified as having a single-enzyme (Sty) target preparation failure, which probably caused the majority of Sty-specific SNP probes to display low signal intensity (that is, the low signal detected was actually just background noise) (Figures 3C and 3D). This had a profound impact on the genotype calls, not only for the affected Sty SNPs (Figures 2A and 2B) but also, surprisingly, for the Nsp and Nsp/Sty SNPs as well (Figures 2C and 2E): because probes from the same chip were normalized together, the failed Sty-specific ones pushed some of the moderate-intensity Nsp probes corresponding to heterozygous genotypes to the upper tail of the distribution. This created an artificial new cluster of homozygous genotypes, which are especially evident in Figures 2C and 2D, top row, and completely absent in Figures 2C and 2D, bottom row. As a result, the cluster that would otherwise be assigned a common homozygous genotype was misclassified as heterozygous; with even more severe consequences, the cluster of heterozygous genotypes was misclassified as homozygous for the rare allele. Thus, for these SNPs not only the genotypes for the problem samples but also the genotypes for the rest of the samples on the plate were grossly misspecified. Recalculating PLINK estimates of average heterozygosity and IBD proportions for Sty- and Nsp-specific SNPs separately confirmed (Table 1) that Sty failure was probably responsible for the deviations observed in these characteristics for the eight problem samples.
Figure 3.
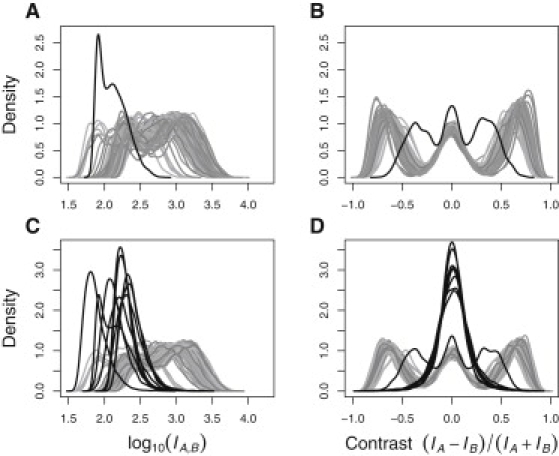
Log-Transformed Probe-Intensity and -Contrast Distributions for the Samples on Plate 4RWG569
The top row corresponds to the panel of Nsp-specific SNPs, and the bottom row corresponds to the panel of Sty-specific SNPs. Solid black curves represent the eight samples with Sty target-preparation failure. In addition to these, one more sample identified by SQC and CQC as failing on both Sty and Nsp panels appears in all four plots and is especially evident in (A) and (B).
Table 1.
The Effect of Sty-Specific SNP Failure on the Estimates of Average Heterozygosity and Pairwise IBD Proportions
| Enzyme- Specific SNP Set |
Average Heterozygosity |
Average Pairwise Proportion of IBD |
|||||
|---|---|---|---|---|---|---|---|
| Within the Problem Samples | Within Other Samples | Within the Problem Samples | Between the Problem and Other Samples | Within Other Samples | |||
| Sty | 0.704 ± 0.002 | 0.317 ± 0.005 | 0.952 ± 0.004 | 0.320 ± 0.074 | 0.015 ± 0.013 | ||
| Nsp/Sty | 0.400 ± 0.003 | 0.319 ± 0.005 | 0.147 ± 0.005 | 0.102 ± 0.011 | 0.007 ± 0.008 | ||
| Nsp | 0.309 ± 0.003 | 0.321 ± 0.006 | 0.0 ± 0.0 | 0.0 ± 0.0 | 0.008 ± 0.011 | ||
In addition to the eight samples discussed above, a few others were identified as having failed for one or both enzymes (see Table S1). These additional failed samples were distributed one or two per plate and did not alter the overall allele calls sufficiently to show plate effects above background. However, our collective experience with GWAS QC suggests that as few as one failed sample can lead to altered allele calls for an entire plate; moreover, in some GWAS where genotypes were called over the entire sample, we observed (data not shown) that failed samples from different plates could cluster together and, hence, lead to a similar genotype-call distortion, this time affecting the entire study. Thus, it is imperative to identify and remove all failed samples (whatever the cause and number) before genotype calling. We also note that the GoKinD data set, and others on which we have conducted QC studies, have plate effects that we have been unable to explain. The magnitude of these plate effects is sufficiently large and the observation sufficiently common to justify more research in this area.
In conclusion, our studies suggest that it is often insufficient to simply remove samples lying outside common quality-control thresholds. Such actions might fail to identify—or fix—more fundamental problems affecting much more of the data, and removal of just the poorest-quality samples might make it more difficult to identify the actual cause of the problems. Clearly, unusual patterns of relatedness and outlier heterozygosity rates across SNPs can be useful clues about underlying data-quality problems that might extend beyond those samples, and the one-degree-of-freedom test for differential plate bias in allele-frequency estimates is a useful approach for identifying plates with potentially problematic data. Proper experimental design, such as randomizing cases and controls to plates, would also have attenuated the most egregious of the effects that the plate bias caused in the primary association analyses. The resulting higher genotype error rate in cases and controls would be expected to both reduce power and increase the number of false-positive associations. In addition, genotyping error could be detected and potentially accounted for by the use of duplicate genotyping.15–17 However, because many current GWAS are designed to make use of samples from public databases, investigators obtaining such data rarely have input into the design of the original study or access to intended duplicate genotypes. And so, for many investigators, recalling genotypes after detecting and removing failed samples remains the most effective way of eliminating this source of genotyping bias.
Conducting association studies in which genotype data for cases and controls have been generated at different genotyping centers and/or at different times certainly enhances the opportunity for plate biases in allele frequency estimation to generate higher rates of false-positive results. It is therefore critical for both individual investigators and public data resources to keep and make publicly available all of the data needed to assign genotypes, particularly the probe-intensity files. Ideally, those responsible for releasing data publicly would re-examine data released before such measures were available and analyze the probe-intensity data by using the CQC or SQC (or similar) measures to identify samples that might have a compromised genotype assignment, remove poor-quality samples, and recall genotypes as indicated. At the least, maintaining and/or providing upon request pre- and post-normalization intensity data will ensure that investigators are able to identify and correct data-quality problems that might impact the entire sample but that are not recognized until after analysis. Similarly, both standard reports from genotyping centers and publications should include information on the allele- calling algorithm and version used for generating the genotype data, as well as metrics (such as CQC or SQC) used for determining which samples should be included in allele calling.
Acknowledgments
The authors are grateful for helpful comments from John Novembre, Anya Tsalenko, Simon Cawley, and Casey Gates; Anastasia Efstathiou, M.D. provided expert assistance in creating the GoKinD files used for analysis. This research was supported in part by awards R01 DK077489, U01 HL084715, and P60 DK20595 and by GAIN (Genetic Association Information Network). The Genetics of Kidneys in Diabetes (GoKinD) study was conducted by the GoKinD investigators and supported by the Juvenile Diabetes Research Foundation, the CDC, and the Special Statutory Funding Program for Type 1 Diabetes Research administered by the National Institute of Diabetes and Digestive and Kidney Diseases (NIDDK). This manuscript was not prepared in collaboration with investigators of the GoKinD study and does not necessarily reflect the opinions or views of the GoKinD study or the NIDDK.
Supplemental Data
Web Resources
The URLs for data presented herein are as follows:
Genome-Wide Human SNP Array 5.0, http://www.affymetrix.com/products_services/arrays/specific/genome_wide/genome_wide_snp_5.affx
NetAffx annotation file for Genome-Wide Human SNP Array 5.0, http://www.affymetrix.com/support/technical/byproduct.affx?product=genomewidesnp_5
Affymetrix Power Tools, http://www.affymetrix.com/support/developer/powertools/index.affx
snpMatrix, http://www.bioconductor.org/packages/2.3/bioc/html/snpMatrix.html
GainQC, http://www.sph.umich.edu/csg/abecasis/GainQC/index.html
CQC white paper, http://www.affymetrix.com/support/technical/whitepapers/genotyping_console_cqc_whitepaper.pdf
References
- 1.Manolio T.A., Rodriguez L.L., Brooks L., Abecasis G., Ballinger D., Daly M., Donnelly P., Faraone S.V., Frazer K., Gabriel S., GAIN Collaborative Research Group. Collaborative Association Study of Psoriasis. International Multi-Center ADHD Genetics Project. Molecular Genetics of Schizophrenia Collaboration. Bipolar Genome Study. Major Depression Stage 1 Genomewide Association in Population-Based Samples Study. Genetics of Kidneys in Diabetes (GoKinD) Study New models of collaboration in genome-wide association studies: The Genetic Association Information Network. Nat. Genet. 2007;39:1045–1051. doi: 10.1038/ng2127. [DOI] [PubMed] [Google Scholar]
- 2.Mailman M.D., Feolo M., Jin Y., Kimura M., Tryka K., Bagoutdinov R., Hao L., Kiang A., Paschall J., Phan L. The NCBI dbGaP database of genotypes and phenotypes. Nat. Genet. 2007;39:1181–1186. doi: 10.1038/ng1007-1181. [DOI] [PMC free article] [PubMed] [Google Scholar]
- 3.Wellcome Trust Case Control Consortium Genome-wide association study of 14,000 cases of seven common diseases and 3,000 shared controls. Nature. 2007;447:661–678. doi: 10.1038/nature05911. [DOI] [PMC free article] [PubMed] [Google Scholar]
- 4.McCarthy M.I., Abecasis G.R., Cardon L.R., Goldstein D.B., Little J., Ioannidis J.P., Hirschhorn J.N. Genome-wide association studies for complex traits: Consensus, uncertainty and challenges. Nat. Rev. Genet. 2008;9:356–369. doi: 10.1038/nrg2344. [DOI] [PubMed] [Google Scholar]
- 5.Clayton D.G., Walker N.M., Smyth D.J., Pask R., Cooper J.D., Maier L.M., Smink L.J., Lam A.C., Ovington N.R., Stevens H.E. Population structure, differential bias and genomic control in a large-scale, case-control association study. Nat. Genet. 2005;37:1243–1246. doi: 10.1038/ng1653. [DOI] [PubMed] [Google Scholar]
- 6.Carvalho B., Bengtsson H., Speed T.P., Irizarry R.A. Exploration, normalization, and genotype calls of high-density oligonucleotide SNP array data. Biostatistics. 2007;8:485–499. doi: 10.1093/biostatistics/kxl042. [DOI] [PubMed] [Google Scholar]
- 7.Ziegler A., König I.R., Thompson J.R. Biostatistical aspects of genome-wide association studies. Biom. J. 2008;50:8–28. doi: 10.1002/bimj.200710398. [DOI] [PubMed] [Google Scholar]
- 8.Plagnol V., Cooper J.D., Todd J.A., Clayton D.G. A method to address differential bias in genotyping in large-scale association studies. PLoS Genet. 2007;3:e74. doi: 10.1371/journal.pgen.0030074. [DOI] [PMC free article] [PubMed] [Google Scholar]
- 9.Weale M.E. Quality control for genome-wide association studies. Methods Mol. Biol. 2010;628:341–372. doi: 10.1007/978-1-60327-367-1_19. [DOI] [PubMed] [Google Scholar]
- 10.Korn J.M., Kuruvilla F.G., McCarroll S.A., Wysoker A., Nemesh J., Cawley S., Hubbell E., Veitch J., Collins P.J., Darvishi K. Integrated genotype calling and association analysis of SNPs, common copy number polymorphisms and rare CNVs. Nat. Genet. 2008;40:1253–1260. doi: 10.1038/ng.237. [DOI] [PMC free article] [PubMed] [Google Scholar]
- 11.Pritchard J.K., Donnelly P. Case-control studies of association in structured or admixed populations. Theor. Popul. Biol. 2001;60:227–237. doi: 10.1006/tpbi.2001.1543. [DOI] [PubMed] [Google Scholar]
- 12.Purcell S., Neale B., Todd-Brown K., Thomas L., Ferreira M.A., Bender D., Maller J., Sklar P., de Bakker P.I., Daly M.J., Sham P.C. PLINK: A tool set for whole-genome association and population-based linkage analyses. Am. J. Hum. Genet. 2007;81:559–575. doi: 10.1086/519795. [DOI] [PMC free article] [PubMed] [Google Scholar]
- 13.Moskvina V., Craddock N., Holmans P., Owen M.J., O'Donovan M.C. Effects of differential genotyping error rate on the type I error probability of case-control studies. Hum. Hered. 2006;61:55–64. doi: 10.1159/000092553. [DOI] [PubMed] [Google Scholar]
- 14.Ahn K., Gordon D., Finch S.J. Increase of rejection rate in case-control studies with the differential genotyping error rates. Stat. Appl. Genet. Mol. Biol. 2009;8 doi: 10.2202/1544-6115.1429. Article25. [DOI] [PubMed] [Google Scholar]
- 15.Tintle N., Gordon D., Van Bruggen D., Finch S. The cost effectiveness of duplicate genotyping for testing genetic association. Ann. Hum. Genet. 2009;73:370–378. doi: 10.1111/j.1469-1809.2009.00516.x. [DOI] [PMC free article] [PubMed] [Google Scholar]
- 16.Tintle N.L., Gordon D., McMahon F.J., Finch S.J. Using duplicate genotyped data in genetic analyses: Testing association and estimating error rates. Stat. Appl. Genet. Mol. Biol. 2007;6 doi: 10.2202/1544-6115.1251. Article4. [DOI] [PubMed] [Google Scholar]
- 17.Hao K., Wang X. Incorporating individual error rate into association test of unmatched case-control design. Hum. Hered. 2004;58:154–163. doi: 10.1159/000083542. [DOI] [PubMed] [Google Scholar]
Associated Data
This section collects any data citations, data availability statements, or supplementary materials included in this article.