

Abstract
High melanocytic nevus count is a strong predictor of melanoma risk. A GWAS of nevus count in Australian adolescent twins identified an association of nevus count with the interferon regulatory factor 4 gene (IRF4 [p = 6 × 10⁻⁹]). There was a strong genotype-by-age interaction, which was replicated in independent UK samples of adolescents and adults. The rs12203592∗T allele was associated with high nevus counts and high freckling scores in adolescents, but with low nevus counts and high freckling scores in adults. The rs12203592∗T increased counts of flat (compound and junctional) nevi in Australian adolescent twins, but decreased counts of raised (intradermal) nevi. In combined analysis of melanoma case-control data from Australia, the UK, and Sweden, the rs12203592∗C allele was associated with melanoma (odds ratio [OR] 1.15, p = 4 × 10⁻³), most significantly on the trunk (OR = 1.33, p = 2.5 × 10⁻⁵). The melanoma association was corroborated in a GWAS performed by the GenoMEL consortium for an adjacent SNP, rs872071 (rs872071∗T: OR 1.14, p = 0.0035; excluding Australian, the UK, and Swedish samples typed at rs12203592: OR 1.08, p = 0.08).
Introduction
The incidence of cutaneous malignant melanoma (CMM [MIM 155600]) has increased in populations of European descent in North America, Europe, and Australia, as a result of long-term changes in sun-exposure behavior.1 Despite the importance of environmental effects, susceptibility to developing CMM (and nonmelanoma skin cancers) has a strong genetic component,2–5 acting via at least two sets of intermediate pigmentary phenotypes—skin color, tanning response, or phototype—as well as number of acquired melanocytic nevi on the skin.6 These intermediate phenotypes interact with the key environmental factor, exposure to ultraviolet light.
Melanoma rates vary 50-fold between dark-skinned and light-skinned racial groups, and 2- to 3-fold between poorly tanning and moderately tanning Europeans.7,8 A number of the genes controlling overall pigmentation and tanning response have been identified (MC1R [MIM 155555], IRF4 [MIM 601900], OCA2 [MIM 611409], ASIP [MIM 600201], TYRP1 [MIM 115501], SLC45A2 [MIM 606202], SLC24A5 [MIM 609802], SLC24A4 [MIM 609840]),9 and many of these exhibit evidence of natural selection, most likely acting (in part) via effects on skin cancer mortality.10 We have estimated that approximately half of the heritability of melanoma mediated via this pathway is accounted for by known pigmentation gene variants (in the Australian population, at least).11
Melanoma risk increases by 2%–4% per additional nevus counted, depending on the population under study, so that individuals in the highest decile experience a 5- to 10-fold higher risk.12 Total nevus count has been shown to be a highly heritable trait in multiple studies (∼70%).13,14 We have shown that as much as half of the genetic variance for mole count can be attributed to a quantitative trait locus (QTL) in the region of CDKN2A (MIM 600160) on chromosome 9.13,15,16 Although high-penetrance coding mutations in CDKN2A are responsible for multiplex familial CMM, and these families also carry larger numbers of nevi, these variants exist at population frequencies of less than 0.1%, and so explain no more than 1%–2% of melanomas in the general population. More recently, we have characterized common SNPs in MTAP (MIM 156540), a gene adjacent to CDKN2A,17 that are associated both with nevus count and melanoma risk.15,17
To identify additional genes contributing to variation in nevus count, we have conducted a GWAS in a healthy Australian adolescent twin cohort, the Brisbane Twin Nevus Study (BTNS) cohort, on Illumina 610K SNP arrays. Significant associations were followed up in two UK twin samples. We also present results from case-control analyses of SNPs with peak association with melanoma risk in multiple populations.
Subjects and Methods
Subjects and Phenotypes
Australia
Twins in the present study come from the Brisbane Twin Nevus Study (BTNS). As described in detail elsewhere,13,16,17 adolescent twins, their siblings, and their parents have been recruited over 16 years into an ongoing study of genetic and environmental factors contributing to the development of pigmented nevi and other risk factors for skin cancer. The proband twins are recruited at age 12 via schools around Brisbane, Australia, and followed up at age 14. All controls are screened to be unaffected by CMM. The sample is overwhelmingly (> 95%) of northern European origin (mainly Anglo-Celtic). All participants gave informed consent for participation in these studies, and the study protocol was approved by appropriate institutional review boards.
Total-body nevus counting was performed in the adolescent twins on two occasions by a trained nurse (at ages 12 and 14), and in singleton siblings on one occasion (the first visit of the twins). For simplicity, we use only the first measurement from the twins. There were 1979 twins and singleton siblings for whom nevus counts and genotypes were available. Mole counts in the parents of the twins were assessed by a four-point questionnaire item with levels “none,” “a few,” “moderate,” and “many”; the item was accompanied by a cartoon showing 0, 6, 14, and 28 spots visible on a silhouette of a human in the anatomical position. Of the parents of the twins, 1470 had self-reported nevus scores and genotypes available. Freckling in the adolescent sample was rated on a four-point scale by the examiner, separately for the face, shoulders, and back, as “none—completely absent,” “mild—infrequent or sparse,” “moderate,” or “severe—near confluent for most of site.” We combined these scores over the three sites. The parent questionnaire asked, “When you were a child, how many freckles did you have on your face at the end of summer? Match your answers with the pictures,” with response levels “none,” “a few,” “moderate,” and “many.” The melanoma case individuals and their relatives were asked,“Freckles are spots found in groups that cannot be felt. During childhood, how much freckling did you have? Would you say…,” with response levels “none,” “light,” “moderate,” and “heavy.”
Melanoma cases (n = 1271, mean age 44.1 yrs) were a stratified sample of all cases of CMM diagnosed in the state of Queensland during the period of 1982–1990, as described in detail elsewhere.18 These individuals were originally studied in 1991–1994, but they were recontacted and interviewed in 2002–2004. Nurse-measured total-body mole counts are available for only a small subset, but most participants completed a questionnaire item on mole count, the possible item responses being “no moles,” “a few moles,” “a moderate number,” and “very many moles”; the item was accompanied by a cartoon showing 0, 6, 14, and 28 spots visible on a silhouette of a human in the anatomical position.
Ancestry was measured via questions to either the individual or a parent about the country of birth and ancestry of each of the grandparents of the individual. Since most subjects were of European ancestry, we have constructed three ancestry scores based on the proportion of grandparents of Northern European (British, Scandinavian, Danish, Dutch, German, French), Southern European (Spanish, Italian, Greek), and Eastern European ancestry. In addition, the Northern indicator was supplemented by “Celtic” (Ireland, Scotland, and Wales), English, and Continental indicators, to test whether there were further substructure effects. Ancestry data are available for all cases and controls included in these analyses.
TwinsUK
The St. Thomas' UK adult twin registry (TwinsUK) cohort is unselected for any disease and is representative of the general UK population. Nevus counts were collected at St. Thomas Hospital in London, and the study was approved by the St. Thomas' Hospital Research Ethics Committee. Written informed consent was obtained from every participant in the study. Examination was performed by trained research nurses following a standardized and reproducible nevus-count protocol.19 The total-body nevus count (excluding the genital area, breasts, and posterior scalp) was defined as the sum of all nevi > 2 mm in diameter. Genotype data were available for 1821 subjects: 1535 dizygotic (DZ) and 286 monozygotic (MZ) twins. The mean age was 47 yrs (range 18–80).
Leeds Case-Control Study
The Leeds adult nevus data were drawn from a case-control study of melanoma. The melanoma cases were from a cohort of population-ascertained incident patients with melanoma (stages I to IIIA) recruited in a geographically defined area of Northern England between September 2000 and March 2008.20 A blood sample was taken for DNA analysis (median time from diagnosis = 245 days). Recruitment took place where possible, between 3 and 6 mo after diagnosis. Nevi > 2mm in diameter were counted by three research nurses trained for this purpose by the same clinician. Controls were identified by case individuals' family doctors as not having melanoma and were randomly invited to join the study from individuals of the same sex and within the same five-year age group of a case. Of 1775 individuals, we excluded those who failed genotyping (the call rate was 0.980) and those without a nevus count (354 cases and 11 controls overall), leaving 925 cases (25 rare) and 485 controls, aged between 18 and 87 (mean age = 53.1, median = 54). Analyses were conducted on cases and controls, with adjustment for case-control status, or solely on controls.
The analysis of the effect of genotype on melanoma case-control status utilized those samples from the case-control study of melanoma described above. Those cases without tumor-site information were excluded, as were those who failed genotyping, giving 1200 cases and 473 controls. We also added 414 controls randomly recruited from general practicioners' practices to answer questions on lifestyle and diet.
Leeds Adolescent Twin Study
Adolescent nevus data came from 100 MZ and 113 DZ twin pairs between the ages of 10 and 18 yrs (mean age = 14 yrs, 4 mo), recruited via schools in the Yorkshire and Surrey regions of England in 1997–1998 to take part in a study of the heritability of nevus count. Further details of the study are published elsewhere.14 Nevi were counted, all by the same dermatologist, and a blood sample was taken for analysis of DNA. Benign melanocytic nevi were counted on 20 body sites, including the eye, buttocks, and anterior scalp, and were sized into < 2 mm, 2–5 mm, and 5–10 mm categories. Only those nevi > 2 mm were analyzed here. Nineteen samples failed genotyping (0.955 call rate).
Stockholm
The Swedish sample was composed of 775 mainly consecutive patients (mean age 55.9 yrs) receiving care for CMM at the Karolinska University Hospital in Solna during 1993–2007. Blood samples were collected from new melanoma patients that were recruited for genetic studies after informed consent was obtained, and the project was approved by the Karolinska Institutet Ethics Board. The clinical and phenotypic characteristics of the subjects were obtained from medical records. Of the patients, 22% had a confirmed family history of melanoma, whereas 11% were diagnosed with multiple primary melanomas. All patients had at least one histopathologically confirmed melanoma (all multiple-melanoma patients had at least two pathologically confirmed primary melanomas). The subjects in the control group (n = 517, mean age = 43.6 yrs) were blood donors from the Stockholm area recruited on a voluntary basis.
GenoMEL Data Set
Cases and controls were provided by GenoMEL participating groups, (see GenoMEL website for a complete list of groups). Note that a subset of the Leeds, Swedish, and Australian melanoma cases described above are included in the GenoMEL GWAS data set. Ethical consent was obtained from all participants. The cases and controls were selected from sets of samples accrued by the various contributing groups; these sample sets were recruited in different ways, as described in the genome-wide association report.21 Cases who fulfilled one of the three following criteria were selected as more likely to carry a genetic susceptibility: (1) a personal and a family history of melanoma, (2) multiple primary melanomas, or (3) onset before the age of 40 yrs. Also selected were cases who were free of CDKN2A mutations, the major high-penetrance susceptibility gene for melanoma. The control data were supplemented by the control data from the Wellcome Trust Case-Control Consortium (WTCCC) and a French control group.21 After quality control (QC), including genotyping completeness and principal-components analysis to restrict analyses to those of European ancestry, data were available on 1539 cases and 3917 controls.
Genotyping
Australian Samples
DNA samples from the BTNS were genotyped by the Scientific Services Division at deCODE Genetics, Iceland, with the use of the Illumina 610-Quad BeadChip; genotypes were called with the Illumina BeadStudio software. Standard QC filters were applied so that the analysis was restricted to samples and SNPs with high data quality. Additional genotyping in the Australian BTNS and CMM case samples was conducted in assays designed with the Sequenom MassARRAY Assay Design software (version 3.0). SNPs were typed with the use of Sequenom iPLEX chemistry on a MALDI-TOF Compact Mass Spectrometer (Sequenom) as described previously.17,22
TwinsUK Samples
The TwinsUK sample was genotyped with the use of the Infinium 610K assay (Illumina), and population substructure was detected and removed as described previously.23
Leeds Samples
Genotyping of rs12203592 in Leeds was performed with the Taqman genotyping assay C_31918199_10 (Applied Biosystems). The 2 ul PCR reactions were performed in 384-well plates with the use of 10 ng of DNA (dried) together with 0.05 μl assay mix and 1 μl Universal Master Mix (Applied Biosystems) according to the manufacturer's instructions. End-point reading of the genotypes was performed with a 7900HT Real-Time PCR System (Applied Biosystems).
Stockholm Samples
The rs12203592 genotypes were assessed with the use of the Taqman SNP genotyping assay C_31918199_10 (Applied Biosystems). The 5 μl PCR reactions were performed in standard 384-well plates with the use of 25 ng of DNA together with 0.25 μl of 20× assay mix and 2.5 μl of 2× Type-it Fast SNP Probe master mix (QIAGEN) according to the manufacturer's protocol. The PCR program was as follows: 95°C for 5 min, 95°C for 15 s, and 60°C for 30 s, for 40 cycles, via the 7900HT Real-Time PCR System (Applied Biosystems). The same system was used for subsequent end-point reading of the genotypes. At least two negative controls were included in each PCR run. The SNP genotypes showed no deviation from Hardy-Weinberg equilibrium.
GenoMEL Samples
Genotyping information for rs872071 was taken from the Illumina 317K data generated for the GWAS.21 This SNP passed QC with a call rate of 96%.
Statistical Analysis
Australian Sample
For the GWAS, we first applied filters to SNP data before evaluating genotyping quality per individual and excluded SNPs with a mean BeadStudio GenCall score < 0.7. Next, we excluded poorly performing samples (call rate < 0.95) and SNPs with a call rate < 0.95, Hardy-Weinberg equilibrium p < 10−6, or minor allele frequency < 0.01. After these exclusions, we compared self-reported with genotype-inferred family relationships, the latter based on genome-wide identity-by-state (IBS) sharing. Forty-eight families with pedigree errors were identified; 21 samples from these families were excluded to correct errors that could not be resolved. No SNPs or individuals showed segregation patterns inconsistent with Mendelian inheritance in > 5% of families and SNPs, respectively. Lastly, we excluded 88 individuals identified as outliers from populations of European descent through the estimation of genetic ancestry with the use of EIGENSTRAT24 as well as data from 11 populations of the HapMap 3 and five Northern European populations genotyped by the GenomeEUtwin consortium. After these exclusions, there remained 529,721 SNPs and 4296 individuals with genotype data for analysis.
Analysis of the nevus counts in the BTNS was carried out after cube-root transformation of the counts and including age, age2, year studied, body surface area, estimated cumulative UV exposure, ancestry, hair color, and skin color as covariates. For the Australian data, a Box-Cox analysis found that a cube-root transformation was significantly better than log transformation. Results of linear mixed-model analysis of cube-root transformed total nevus count also closely matched the results of a negative binomial generalized linear mixed-model analysis of raw counts and were superior to the equivalent analysis of log total nevus count in terms of model-fit diagnostics.
Association of the GWAS SNP genotypes to quantitative phenotypes was carried out with MERLIN 1.2, with the “–fastassoc” option used.25 Fine-scale follow up and multivariate mixed-model association analysis was carried with MENDEL 9.026 and WOMBAT version 06-11-2008.27 Allelic association to categorical phenotypes was performed with the use of gene-dropping simulation in the Sib-pair package. Descriptive statistics and plots were produced with the R statistical programming environment.28
TwinsUK
Analyses of the rs12203592 allele's interaction with age were carried out in a method similar to that of the Australian cohorts, with the use of R (see Web Resources).28
Leeds Nevus Data: Adolescent Twins and Adult Population Controls
The twin samples were analyzed by regressing log nevus count on genotype in a linear mixed-effects model, with twin pair as a random effect via the lme function in R. Age (by quartile) and sex were included in the model. The analysis was conducted both with and without MZ twins. Excluding the MZ twins increased the estimated effect of the genotype, although it was less significant, suggesting that the model is fairly robust to zygosity of twins. Thus, results are reported for all twin pairs.
Nevus count was investigated in the adult case-control samples by regressing nevus count on genotype, adjusting for case-control status and sex. This was repeated with the analysis of each separate age quartile.
Combined Nevus Analysis
In combined analyses, we have used log-transformed nevus counts (the cube-root transformation has not been investigated across a full range of ages, and results from both transformations are not greatly different). Age effects were modeled with the use of localized weighted regression in R.
Melanoma Analysis
The melanoma analysis of rs12203592 was conducted by combining the data from Brisbane, Leeds, and Stockholm and performing a logistic regression of case-control status on genotype, with study center and reported ethnic background as covariates. We also carried out multinomial regression across the different tumor-site categories (head/neck, trunk, limbs, or rare sites) and histological subgroups (superficial spreading melanoma, lentigo malignant melanoma, all other types).
GenoMEL Melanoma Analysis
The melanoma analysis of rs872071 was conducted within the GenoMEL GWAS data set; rs872071 is on the Illumina 317K array. Statistical analysis involved principal-components analysis for the identification of persons of European ancestry. Case-control analysis involved logistic regression stratified by the country of recruitment.
Imputation was applied to the GenoMEL GWAS data in an effort to impute the genotype at rs12203592, but because of insufficient tagging SNPs on the array, the imputed genotypes did not pass QC. Although the linkage disequilibrium (LD) between the two SNPs is high (0.89), the r2 value is only 0.18, reflecting the wide difference in allele frequencies; the two SNPs are 14.7 kb apart.
The analysis of rs872071 involved genotyping information taken from the Illumina 317K array utilized in the GenoMEL GWAS.21 Note that some Australian, Leeds, and Swedish cases are included in these data, so we present analysis results for the complete set of rs872071 genotypes, as well as for the subset of cases and controls, excluding those in whom direct rs12203592 genotyping was performed. Subset analysis was conducted for those cases for whom anatomical-site information relating to the primary was available (Leeds, Genoa, Leiden, Lund, Barcelona; 356 cases, 1764 controls). For both the full and the subset analyses, case-control status was regressed on genotype (coded as additive) in a logistic regression, adjusting for contributing center as a factor.
Haplotype Analysis of rs872071 and rs12203592
The Brisbane melanoma data contain genotyping information on both SNPs; logistic regression adjusting for geographical origin (Northern Europe or Southern Europe) was conducted, including both SNPs as explanatory variables. Further haplotype analysis was conducted for the two SNPs.
Results
Genome-wide SNP genotype data (Illumina 610K) was available for a total of 1810 Australian adolescent twins (BTNS study) in whom mole counts had been measured. The two most significant association peaks (See Figure 1 and Figure S1 available online) were observed over the MTAP-CDKN2A region on chromosome 9p (peak SNP, p = 7 × 10⁻¹²) and in IRF4 on chromosome 6p (peak SNP, p = 6 × 10⁻⁹). A lesser peak that did not quite reach genomic levels of significance was also observed on chromosome 9q—this coincides with a linkage peak we have previously noted.16
Figure 1.
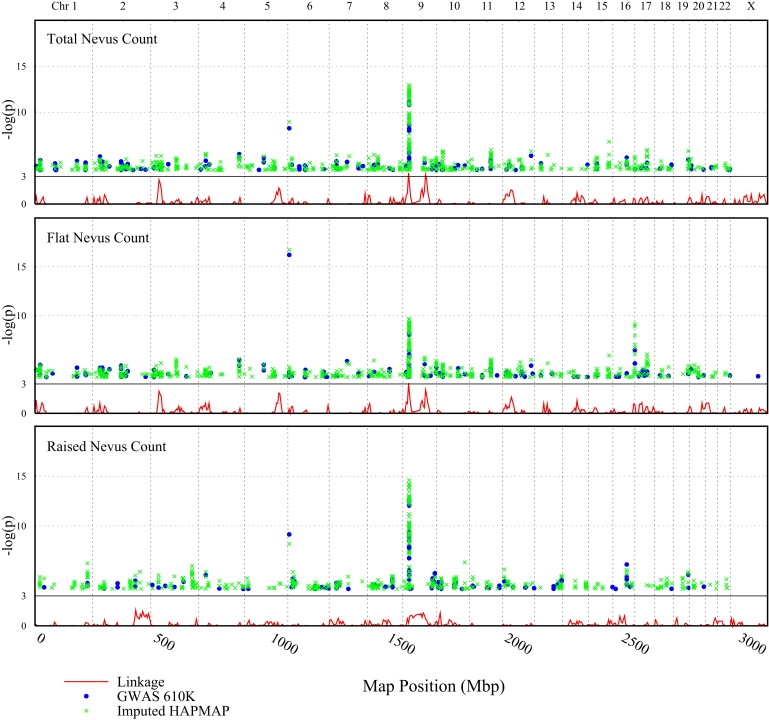
Manhattan Plot of GWAS p Values for Counts of All Moles, Macular Moles, and Papular Moles
Dark points represent results for directly measured SNP genotypes, lighter points represent those for imputed SNP genotypes. The lower line represents results from linkage analysis of the same data set.
The IRF4 SNP with the strongest association with nevus count in the GWAS was rs12203592. Variants in IRF4, notably rs12203592, are associated with eye color, hair color, skin color, and freckling,11,29,30 and as we have described previously,11 rs12203592 exhibits significant gradients of allele frequency versus ancestry within the British Isles (comparing England with Scotland, Ireland, and Wales), and more striking ones are exhibited when Northern Europe is compared to Southern Europe (p = 10−18), with the T allele frequency increasing to the north and west. A quantitative-trait transmission-disequilibrium test (TDT) of nevus count using twins and their parental genotypes in the BTNS was highly significant (F1,1362 = 104.3, p = 1.2 × 10⁻²³), demonstrating that the association was not due to ethnic stratification.
Flat nevi made up the majority (82%) of nevi in these Australian adolescents. Each rs12203592∗T allele increased the nevus count for flat lesions by an average of 30 (p = 5 × 10⁻²³; Figure 2). The effect on raised nevi was only one nevus per allele in the opposite direction. The effects of genotype were similar on sun-exposed and intermittently exposed sites, and adjusting for covariates including eye, skin, and hair color did not affect these associations. Including freckling score as a covariate strengthened the negative relationship between the rs12203592∗T allele and raised nevi (Figure 2); within the twins scored as “mildly” or “moderately” freckled, raised nevus count decreased by five nevi per T allele (p = 4 × 10⁻¹¹). Adjustment for freckling had no impact on the effects of genotype on total flat nevus count (Figure 3).
Figure 2.
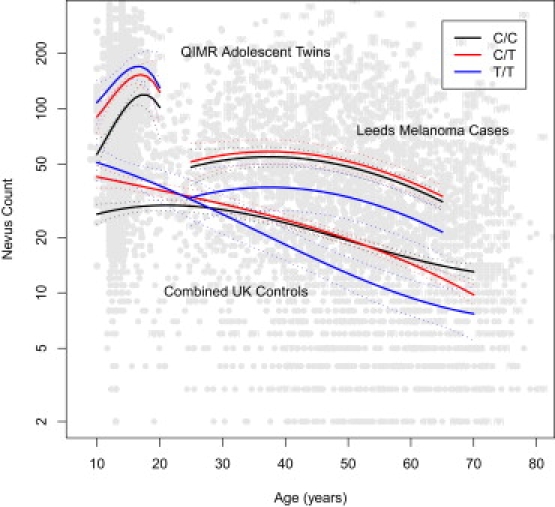
Nevus Counts versus Age and IRF4 Genotype
Lines represent cubic-polynomial-smoothed predictions from the best-fitting linear model (dotted lines are 95% confidence intervals). The three sets of lines represent Australian adolescent twins (BTNS), combined data from the UK control populations, and UK melanoma cases. Likelihood-ratio tests showed that the three UK control groups could be combined (p = 0.94).
Figure 3.
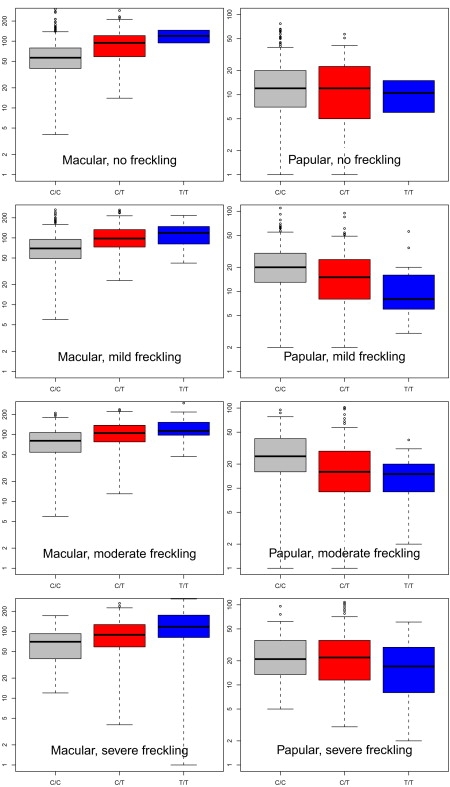
Adolescent Macular and Papular Mole Counts versus rs12203592 Genotype, Stratified on the Four Levels of Freckling Score
The association between papular counts and genotype is highly statistically significant in all cells except the first (no freckling).
We then attempted to replicate this nevus association by using the parents of those twins for whom we had self-reported nevus score and genotype. In parents (n = 1470, mean age = 47.2 yrs) there was evidence of association (p = 0.0002), but the effect was in the opposite direction to that observed in the adolescent twins. The rs12203592 allele associated with high self-reported nevus count was the C allele (Table 1 and Figure 4). The data show a strong gene-by-age interaction, and we sought to confirm this interesting result in additional samples: adolescent twins from Leeds (n = 426), adult twins from TwinsUK (n = 1821), and a melanoma case-control study from Leeds (n = 1410).
Table 1.
Association between rs12203592 Genotype and Mole Count, Skin Color, and Hair Color in Three Queensland Samples
| rs12203592 Genotype |
Parents of Twinsa |
CMM Familiesa |
Adolescent Twinsa |
||||||
|---|---|---|---|---|---|---|---|---|---|
| Mean Mole Scoreb | Prop. Light Skin | Prop. Dark Hair |
Mean Mole Scoreb |
Prop. Light Skin | Prop. Dark Hair |
Total Mole Count |
Prop. Light Skin | Prop. Dark Hair | |
| C/C | 2.38 (737) | 55.0% | 29.0% | 2.62 (818) | 68.8% | 17.7% | 89.1 (1204) | 32.9% | 33.0% |
| C/T | 2.28 (467) | 63.8% | 50.1% | 2.39 (418) | 73.8% | 39.3% | 122.5 (652) | 44.4% | 57.4% |
| T/T | 2.22 (74) | 86.7% | 62.7% | 2.07 (70) | 89.0% | 54.3% | 147.7 (122) | 76.8% | 67.6% |
| p valuec | 0.002 | 1.9 × 10⁻¹⁰ | 1.9 × 10−49 | ||||||
Abbreviations are as follows: CMM, cutaneous malignant melanoma; Prop., proportion.
All four grandparents reported to be of Northern European ancestry.
Self-reported mole score on a four-point scale.
Kruskal-Wallis chi-square p value.
Figure 4.
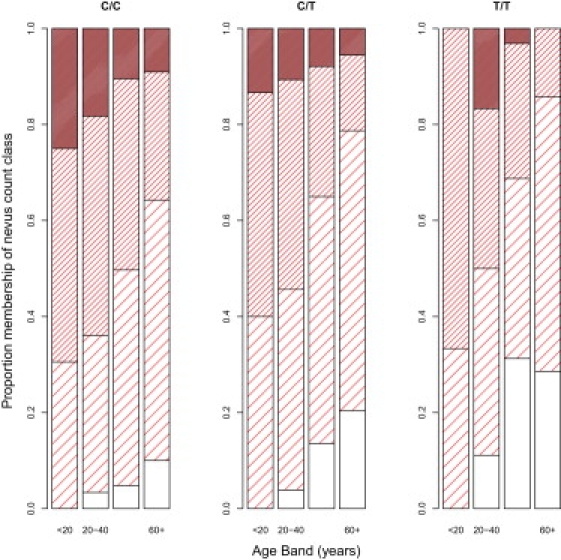
Self-Reported Mole Scores in Queensland Melanoma Cases versus Age and Genotype at rs12203592 in IRF4
Bar shading represents the proportion reporting each of the four possible responses, from “none” (no shading) to “very many” (solid shading). Differences between genotypes are highly significant (see Table S1).
The same pattern of gene-by-age interaction was observed in all UK samples across an age range from 10 to 80 yrs (Figure 2, Figure S2). The relationship of log number of nevi with age showed a highly significant curvilinear trend (p = 9 × 10⁻⁴), as would be expected given the literature, increasing during adolescence and then decreasing significantly with increasing age thereafter. In the Leeds adolescents, T/T carriers had significantly higher nevus counts than C/T or C/C carriers (p = 8.27 × 10⁻⁵; Figure 2, Figure S2). In the TwinsUK sample, adult twins carrying the rs12203592 T/T genotype had significantly fewer moles than those with either C/T or C/C genotype (p = 0.021 and p = 0.015). A similar result was seen in Leeds adults, for whom T/T carriers also had lower nevus counts (p = 0.13 overall, but 2.7 × 10⁻⁴ in the oldest age quartile) (Figure 2, Figure S2). Any confounding of nevi and freckles is unlikely to have influenced association of nevi with IRF4 genotype, because freckling scores do not exhibit the gene-by-age interaction. That is, the rs12203592∗T allele increases freckling in both adolescents and adults to a similar extent.
Given the sizable effect of the rs12203592∗C allele on adult nevus count, we hypothesized that the rs12203592∗C allele would increase melanoma risk. Gudbjartsson and coworkers31 reported that rs1540771 in the region of IRF4 was not associated with melanoma risk, although it was associated with hair color, sun sensitivity, and freckling (the LD r2 of rs1540771 with rs12203592 is 0.14 in the BTNS).
In a combined analysis of melanoma case-control data from Australia (n = 1271 cases), the UK (n = 1200 cases), and Sweden (n = 775 cases), there was a significant association in the predicted direction; allelic odds ratio (OR) = 1.15 (p = 0.004). The “divergent pathway” model for melanoma carcinogenesis predicts that a locus that acts on melanoma risk via an increase in nevus count should have its greatest effect on sites with larger numbers of nevi, such as the trunk.6,32 A multinomial regression of tumor site versus genotype gave a more significant association signal (p = 4 × 10⁻⁴), and there was significant heterogeneity in risk across sites, with the highest risk for tumors arising on the trunk, as predicted: allelic OR = 1.33 (comparing truncal cases to controls, p = 2.5 × 10⁻⁵; Table 2, Table S1, and Figure 5). There were trends for effects with age paralleling the effects on mole count, but none were significant, and we also could not distinguish among dominant, multiplicative, and recessive model fits. There was no evidence for heterogeneity of effects across the studies, which, in passing, makes confounding effects of delays in follow-up blood collection unlikely (in the Queensland study, these range up to 10 yrs, but they were usually under 1 yr in the UK melanoma cases). Finally, further confirmation came from the GenoMEL GWAS;21 the rs872071∗T allele was associated with increased risk of melanoma: OR 1.14, p = 0.0035. After exclusion of overlapping UK, Swedish, and Australian samples genotyped at rs12203592 from the GenoMEL GWAS, the OR was 1.08 (p = 0.08), with the trunk again being the most extreme site (OR = 1.19, p = 0.16). This SNP is adjacent to and in strong LD with rs12203592 (r2 = 0.18, D′ = 0.91 in the HapMap European sample), which was not genotyped in the GWAS and could not be well imputed. Combined analysis of rs872071 and rs12203592 in the Brisbane melanoma study indicates that rs872071 does not add to the rs12203592 association. Because only a subset of cases had full nevus counts available, it was not possible to demonstrate that adjusting for total nevus count significantly attenuated the correlation between rs12203592 genotype and melanoma risk (for the UK samples, the crude genotype-melanoma OR = 1.22, p = 0.03; adjusted for nevus count, OR = 1.12, p = 0.28).
Table 2.
Association between All Melanomas and Melanoma Occurring on the Trunk with IRF4 Genotype in Multiple Populations
| Population |
rs12203592∗T Allele Frequency |
Odds Ratio for rs12203592∗C (95% Confidence Interval) |
||
|---|---|---|---|---|
|
Controls (N) |
All Cases (N) |
Truncal CMM (N) | All Sites | |
| QIMR (N. Europea) | 0.238 (2908) | 0.214 (1310) | 0.201 (451) | 1.181 (1.040–1.340) |
| QIMR (Othera) | 0.173 (987) | 0.173 (176) | 0.158 (60) | 1.004 (0.687–1.466) |
| Leeds (English) | 0.231 (453) | 0.191 (1111) | 0.158 (379) | 1.277 (1.059–1.540) |
| Leeds (Celtic) | 0.425 (20) | 0.143 (60) | 0.250 (20) | 1.541 (0.501–4.738) |
| Leeds (Unspecified) | 0.218 (385) | 0.262 (21) | 0.700 (5) | 0.796 (0.357–1.773) |
| Stockholm | 0.073 (517) | 0.073 (775) | 0.059 (349) | 1.001 (0.801–1.251) |
| Overallb | 1.150 (1.046–1.264) | |||
Ancestry (reported for grandparents).
Binomial random effects model (allelic association p = 6.3x10⁻⁹) – a fixed-effects model detected significant inter-study heterogeneity (p = 0.004).
Figure 5.
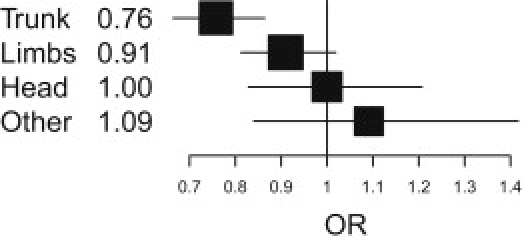
Combined Analysis of Melanoma Case-Control Data from Australia, the UK, and Sweden for rs12203592 by Tumor Site, Showing the Strongest Association with Melanoma on the Trunk: OR = 1.32, p = 2.5 × 10⁻⁵
Discussion
We have carried out a GWAS of nevus count in which the two highest association signals were with SNPs in the MTAP and IRF4 genes. In both cases,17,21 these same SNPs also predispose one to developing melanoma. This confirms the value of studying the intermediate phenotype of nevus count in the search for melanoma genes.
Total nevus counts increase through childhood until the fourth decade and then decrease thereafter.33 This parallels changes in individual nevi, as melanocytes proliferate, differentiate, and then senesce with age. In the present study, we found a complete reversal in the direction of the association of nevus count with the rs12203592 genotype when we compared our adolescent cohorts to older individuals. The data suggest that rs12203592∗T carriers are prone to developing many nevi at a young age, but these nevi involute faster, with few remaining by late adulthood. In the Australian adolescent twins, each copy of the rs12203592∗T allele increased the total nevus count by 30. Several studies have shown that nevus counts are far lower in the British Isles than in Queensland, and this has been attributed to their different levels of sun exposure.34,35 In the UK adolescents, each copy of the rs12203592∗T allele increased the total nevus count by only five nevi. Despite a 3-fold difference in mean nevus count, the relative effects of rs12203592 genotype on mean counts are consistent between countries, as is the pattern of the interaction with age (Figure S2). For comparison, the MTAP rs4636294∗A allele increases nevus count by a mean of 11.17 We found no evidence for any interaction between IRF4 and MTAP SNP genotypes on nevus count.
In the Australian adolescent twins, a parallel to these age effects was the observation that rs12203592∗T was associated with decreased counts of raised (papular) nevi and increased counts of flat (macular) nevi. Papular nevi are a histologically distinct subgroup (tending to be compound or intradermal) and made up 18% of the total nevus count in this sample. We have previously shown that the genetic correlation between raised and flat mole counts is significantly less than unity.13 In the literature, there is no clear evidence of association between any one of these subgroups of nevi and melanoma risk, as most epidemiological studies have concentrated on either total nevus count or presence of atypical or dysplastic nevi (uncommon in our young samples).
IRF4 is a member of the interferon regulatory factor family of transcription factors.36 SNPs in IRF4 have been implicated in susceptibility to a number of hematological malignancies, including lymphoma (rs12211228),37 chronic lymphocytic leukemia (rs872071), and multiple myeloma. Studies have excluded pigmentation-associated IRF4 SNPs such as rs12203592 as being associated with non-Hodgkin lymphoma.38 IRF4 expression is limited to a very small number of tissue types, but it is not commonly pointed out that these include foreskin derived melanocytes, intradermal and compound melanocytic nevi, Spitz nevi, and melanomas.39–41 Therefore, it seems likely that the association between rs12203592 and traits such as nevus count is due to an effect of IRF4 itself, rather than nearby genes. SNP rs12203592 is located in intron 4 of IRF4 within a 280 bp sequence that is highly conserved across mammalian species (ECR Browser), and the C allele has recently been reported to repress IRF4 promoter activity.42
The IRF4 rs12203592∗T allele is associated with pale skin, dark hair, and freckling. 11,29,30 In the WTCCC study, IRF4 is one of only 12 loci where SNPs show highly significant differences (rs9378805 p = 5 × 10⁻¹³) in frequency across the UK.43 The rs12203592∗T allele appears to be associated with Celtic ancestry, but paradoxically, it is the protective allele for melanoma in our study, suggesting that effects of IRF4 on nevi override opposing effects mediated via skin color and freckling. A similar contrast is seen for MC1R melanoma-risk alleles, which simultaneously increase skin pallor and decrease total nevus count—MC1R acts to switch the skin melanin type from eumelanin to pheomelanin, and we might speculate that in this case the effects of skin coloring outweigh any protective effect of a reduction in nevus numbers.9
Under the “divergent pathway” model,6,32 melanomas are hypothesized to arise by two broad processes. In individuals who have a low propensity to develop nevi, melanomas will develop only after chronic sun exposure and will occur on exposed sites such as the head and neck, mimicking the distribution of nonmelanoma skin cancers. In members of the population who have a high propensity to develop nevi, sun exposure will be less critical, nevus count will be a relatively more important determinant of risk, and site distribution of melanoma will be proportional to surface area of the different body regions. Multiple studies have found total nevus count to be most strongly associated with melanoma arising on the trunk.32,44 The pattern of association that we observed for rs12203592 is consistent with an action on risk primarily via a nevus-count pathway.
We demonstrate a strong gene-by-age interaction for IRF4 and nevus count with complete reversal of the direction of association with age. This important observation could easily have been missed in a single sample combining different age groups. Trait-associated variants reported in GWAS generally have modest effect sizes.45 Similar interactions could result in underestimates of effect size when large GWAS data sets are analyzed jointly to increase power for gene discovery.46 The results also highlight changing patterns of melanocytic nevi subtypes across the lifespan and differential effects of genetic variants contributing to different subtypes. In light of the association with nevi, we reexamined the association of rs12203592 with melanoma and found strong evidence for association of the rs12203592∗C allele with melanoma on the trunk in case-control sets from Australia, the UK, and Sweden, as well as corroborative evidence from the GenoMEL data set. Greater understanding of the changing nevus subtypes with age and of the biological role(s) of the different IRF4 alleles on both nevi and skin pigmentation may help us to develop better predictions of melanoma risk and new pathways for future treatment.
Acknowledgments
The Australian studies were supported by the National Institutes of Health (NIH)/National Cancer Institute (CA88363), the National Health and Medical Research Council of Australia (NHMRC), and the Cancer Council Queensland. D.L.D., D.C.W., N.K.H., and G.W.M. are supported by the NHMRC Fellowships scheme. The TwinsUK study was supported by the Wellcome Trust, the Department of Health via the National Institute for Health Research (NIHR), a comprehensive Biomedical Research Centre award to Guy's & St. Thomas' NHS Foundation Trust in partnership with King's College London, EC Framework 7 Health-2007-A ENGAGE project, and the CDRF. T.D.S. is an NIHR senior investigator, and D.G. is an MRC clinical research fellow. The authors acknowledge the funding and support of the National Eye Institute via an NIH/CIDR genotyping project (PI: Terri Young). The Leeds twin study and case-control studies were funded by Cancer Research UK (project grant C8216/A6129 and programme awards C588/A4994 and C588/A10721) and by the NIH (R01 CA83115). GenoMEL is also funded by the European Commission under the 6th Framework Programme, contract no. LSHC-CT-2006-018702, by a Cancer Research UK Programme Award (C588/A4994), and by NIH R01 ROI CA83115. Work at CNG was supported by the Ministère de l'Enseignement Supérieur et de la Recherche and Institut National du Cancer (INCa). The Swedish Study was supported from Karolinska Institutet research funds and the Magnus Bergvall Foundation.
Supplemental Data
Web Resources
The URLs for data presented herein are as follows:
ECR Browser, http://ecrbrowser.dcode.org/
GenoMEL, http://www.genomel.org
Online Mendelian Inheritance in Man (OMIM), http://www.ncbi.nlm.nih.gov/Omim/
The R Project for Statistical Computing, http://www.r-project.org
Scientific Services Division at deCODE Genetics, Iceland, http://www.decode.com/genotyping/
References
- 1.Tucker M.A. Melanoma epidemiology. Hematol. Oncol. Clin. North Am. 2009;23:383–395, vii. doi: 10.1016/j.hoc.2009.03.010. [DOI] [PMC free article] [PubMed] [Google Scholar]
- 2.Czene K., Lichtenstein P., Hemminki K. Environmental and heritable causes of cancer among 9.6 million individuals in the Swedish Family-Cancer Database. Int. J. Cancer. 2002;99:260–266. doi: 10.1002/ijc.10332. [DOI] [PubMed] [Google Scholar]
- 3.Begg C.B., Hummer A., Mujumdar U., Armstrong B.K., Kricker A., Marrett L.D., Millikan R.C., Gruber S.B., Anton-Culver H., Klotz J.B., GEM Study Group Familial aggregation of melanoma risks in a large population-based sample of melanoma cases. Cancer Causes Control. 2004;15:957–965. doi: 10.1007/s10522-004-2474-2. [DOI] [PubMed] [Google Scholar]
- 4.Do K.A., Aitken J.F., Green A.C., Martin N.G. Analysis of melanoma onset: assessing familial aggregation by using estimating equations and fitting variance components via Bayesian random effects models. Twin Res. 2004;7:98–113. doi: 10.1375/13690520460741480. [DOI] [PubMed] [Google Scholar]
- 5.Shekar S.N., Duffy D.L., Youl P., Baxter A.J., Kvaskoff M., Whiteman D.C., Green A.C., Hughes M.C., Hayward N.K., Coates M., Martin N.G. A population-based study of Australian twins with melanoma suggests a strong genetic contribution to liability. J. Invest. Dermatol. 2009;129:2211–2219. doi: 10.1038/jid.2009.48. [DOI] [PMC free article] [PubMed] [Google Scholar]
- 6.Whiteman D.C., Watt P., Purdie D.M., Hughes M.C., Hayward N.K., Green A.C. Melanocytic nevi, solar keratoses, and divergent pathways to cutaneous melanoma. J. Natl. Cancer Inst. 2003;95:806–812. doi: 10.1093/jnci/95.11.806. [DOI] [PubMed] [Google Scholar]
- 7.Aitken J.F., Duffy D.L., Green A., Youl P., MacLennan R., Martin N.G. Heterogeneity of melanoma risk in families of melanoma patients. Am. J. Epidemiol. 1994;140:961–973. doi: 10.1093/oxfordjournals.aje.a117203. [DOI] [PubMed] [Google Scholar]
- 8.Bliss J.M., Ford D., Swerdlow A.J., Armstrong B.K., Cristofolini M., Elwood J.M., Green A., Holly E.A., Mack T., MacKie R.M., The International Melanoma Analysis Group (IMAGE) Risk of cutaneous melanoma associated with pigmentation characteristics and freckling: systematic overview of 10 case-control studies. Int. J. Cancer. 1995;62:367–376. doi: 10.1002/ijc.2910620402. [DOI] [PubMed] [Google Scholar]
- 9.Sturm R.A. Molecular genetics of human pigmentation diversity. Hum. Mol. Genet. 2009;18(R1):R9–R17. doi: 10.1093/hmg/ddp003. [DOI] [PubMed] [Google Scholar]
- 10.Parra E.J. Human pigmentation variation: evolution, genetic basis, and implications for public health. Am. J. Phys. Anthropol. 2007;45(Suppl 45):85–105. doi: 10.1002/ajpa.20727. [DOI] [PubMed] [Google Scholar]
- 11.Duffy D.L., Zhao Z.Z., Sturm R.A., Hayward N.K., Martin N.G., Montgomery G.W. Multiple pigmentation gene polymorphisms account for a substantial proportion of risk of cutaneous malignant melanoma. J. Invest. Dermatol. 2010;130:520–528. doi: 10.1038/jid.2009.258. [DOI] [PMC free article] [PubMed] [Google Scholar]
- 12.Chang Y.M., Newton-Bishop J.A., Bishop D.T., Armstrong B.K., Bataille V., Bergman W., Berwick M., Bracci P.M., Elwood J.M., Ernstoff M.S. A pooled analysis of melanocytic nevus phenotype and the risk of cutaneous melanoma at different latitudes. Int. J. Cancer. 2009;124:420–428. doi: 10.1002/ijc.23869. [DOI] [PMC free article] [PubMed] [Google Scholar]
- 13.Zhu G., Duffy D.L., Eldridge A., Grace M., Mayne C., O'Gorman L., Aitken J.F., Neale M.C., Hayward N.K., Green A.C., Martin N.G. A major quantitative-trait locus for mole density is linked to the familial melanoma gene CDKN2A: a maximum-likelihood combined linkage and association analysis in twins and their sibs. Am. J. Hum. Genet. 1999;65:483–492. doi: 10.1086/302494. [DOI] [PMC free article] [PubMed] [Google Scholar]
- 14.Wachsmuth R.C., Gaut R.M., Barrett J.H., Saunders C.L., Randerson-Moor J.A., Eldridge A., Martin N.G., Bishop T.D., Newton Bishop J.A. Heritability and gene-environment interactions for melanocytic nevus density examined in a U.K. adolescent twin study. J. Invest. Dermatol. 2001;117:348–352. doi: 10.1046/j.0022-202x.2001.01415.x. [DOI] [PubMed] [Google Scholar]
- 15.Falchi M., Spector T.D., Perks U., Kato B.S., Bataille V. Genome-wide search for nevus density shows linkage to two melanoma loci on chromosome 9 and identifies a new QTL on 5q31 in an adult twin cohort. Hum. Mol. Genet. 2006;15:2975–2979. doi: 10.1093/hmg/ddl227. [DOI] [PubMed] [Google Scholar]
- 16.Zhu G., Montgomery G.W., James M.R., Trent J.M., Hayward N.K., Martin N.G., Duffy D.L. A genome-wide scan for naevus count: linkage to CDKN2A and to other chromosome regions. Eur. J. Hum. Genet. 2007;15:94–102. doi: 10.1038/sj.ejhg.5201729. [DOI] [PubMed] [Google Scholar]
- 17.Falchi M., Bataille V., Hayward N.K., Duffy D.L., Bishop J.A.N., Pastinen T., Cervino A., Zhao Z.Z., Deloukas P., Soranzo N. Genome-wide association study identifies variants at 9p21 and 22q13 associated with development of cutaneous nevi. Nat. Genet. 2009;41:915–919. doi: 10.1038/ng.410. [DOI] [PMC free article] [PubMed] [Google Scholar]
- 18.Baxter A.J., Hughes M.C., Kvaskoff M., Siskind V., Shekar S., Aitken J.F., Green A.C., Duffy D.L., Hayward N.K., Martin N.G., Whiteman D.C. The Queensland Study of Melanoma: environmental and genetic associations (Q-MEGA); study design, baseline characteristics, and repeatability of phenotype and sun exposure measures. Twin Res. Hum. Genet. 2008;11:183–196. doi: 10.1375/twin.11.2.183. [DOI] [PMC free article] [PubMed] [Google Scholar]
- 19.Bataille V., Snieder H., MacGregor A.J., Sasieni P., Spector T.D. Genetics of risk factors for melanoma: an adult twin study of nevi and freckles. J. Natl. Cancer Inst. 2000;92:457–463. doi: 10.1093/jnci/92.6.457. [DOI] [PubMed] [Google Scholar]
- 20.Newton-Bishop J.A., Beswick S., Randerson-Moor J., Chang Y.M., Affleck P., Elliott F., Chan M., Leake S., Karpavicius B., Haynes S. Serum 25-hydroxyvitamin D3 levels are associated with breslow thickness at presentation and survival from melanoma. J. Clin. Oncol. 2009;27:5439–5444. doi: 10.1200/JCO.2009.22.1135. [DOI] [PMC free article] [PubMed] [Google Scholar]
- 21.Bishop D.T., Demenais F., Iles M.M., Harland M., Taylor J.C., Corda E., Randerson-Moor J., Aitken J.F., Avril M.-F., Azizi E. Genome-wide association study identifies three loci associated with melanoma risk. Nat. Genet. 2009;41:920–925. doi: 10.1038/ng.411. [DOI] [PMC free article] [PubMed] [Google Scholar]
- 22.Zhao Z.Z., Nyholt D.R., Le L., Martin N.G., James M.R., Treloar S.A., Montgomery G.W. KRAS variation and risk of endometriosis. Mol. Hum. Reprod. 2006;12:671–676. doi: 10.1093/molehr/gal078. [DOI] [PubMed] [Google Scholar]
- 23.Richards J.B., Rivadeneira F., Inouye M., Pastinen T.M., Soranzo N., Wilson S.G., Andrew T., Falchi M., Gwilliam R., Ahmadi K.R. Bone mineral density, osteoporosis, and osteoporotic fractures: a genome-wide association study. Lancet. 2008;371:1505–1512. doi: 10.1016/S0140-6736(08)60599-1. [DOI] [PMC free article] [PubMed] [Google Scholar]
- 24.Price A.L., Patterson N.J., Plenge R.M., Weinblatt M.E., Shadick N.A., Reich D. Principal components analysis corrects for stratification in genome-wide association studies. Nat. Genet. 2006;38:904–909. doi: 10.1038/ng1847. [DOI] [PubMed] [Google Scholar]
- 25.Chen W.M., Abecasis G.R. Family-based association tests for genomewide association scans. Am. J. Hum. Genet. 2007;81:913–926. doi: 10.1086/521580. [DOI] [PMC free article] [PubMed] [Google Scholar]
- 26.Lange K., Sinsheimer J.S., Sobel E. Association testing with Mendel. Genet. Epidemiol. 2005;29:36–50. doi: 10.1002/gepi.20073. [DOI] [PubMed] [Google Scholar]
- 27.Meyer K. WOMBAT: a tool for mixed model analyses in quantitative genetics by restricted maximum likelihood (REML) J. Zhejiang Univ. Sci. B. 2007;8:815–821. doi: 10.1631/jzus.2007.B0815. [DOI] [PMC free article] [PubMed] [Google Scholar]
- 28.R Core Development Team . R Foundation for Statistical Computing; Vienna, Austria: 2009. R: A Language and Environment for Statistical Computing. [Google Scholar]
- 29.Sulem P., Gudbjartsson D.F., Stacey S.N., Helgason A., Rafnar T., Magnusson K.P., Manolescu A., Karason A., Palsson A., Thorleifsson G. Genetic determinants of hair, eye and skin pigmentation in Europeans. Nat. Genet. 2007;39:1443–1452. doi: 10.1038/ng.2007.13. [DOI] [PubMed] [Google Scholar]
- 30.Han J., Kraft P., Nan H., Guo Q., Chen C., Qureshi A., Hankinson S.E., Hu F.B., Duffy D.L., Zhao Z.Z. A genome-wide association study identifies novel alleles associated with hair color and skin pigmentation. PLoS Genet. 2008;4:e1000074. doi: 10.1371/journal.pgen.1000074. [DOI] [PMC free article] [PubMed] [Google Scholar]
- 31.Gudbjartsson D.F., Sulem P., Stacey S.N., Goldstein A.M., Rafnar T., Sigurgeirsson B., Benediktsdottir K.R., Thorisdottir K., Ragnarsson R., Sveinsdottir S.G. ASIP and TYR pigmentation variants associate with cutaneous melanoma and basal cell carcinoma. Nat. Genet. 2008;40:886–891. doi: 10.1038/ng.161. [DOI] [PubMed] [Google Scholar]
- 32.Olsen C.M., Zens M.S., Stukel T.A., Sacerdote C., Chang Y.M., Armstrong B.K., Bataille V., Berwick M., Elwood J.M., Holly E.A. Nevus density and melanoma risk in women: a pooled analysis to test the divergent pathway hypothesis. Int. J. Cancer. 2009;124:937–944. doi: 10.1002/ijc.24011. [DOI] [PMC free article] [PubMed] [Google Scholar]
- 33.MacKie R.M., English J., Aitchison T.C., Fitzsimons C.P., Wilson P. The number and distribution of benign pigmented moles (melanocytic naevi) in a healthy British population. Br. J. Dermatol. 1985;113:167–174. doi: 10.1111/j.1365-2133.1985.tb02060.x. [DOI] [PubMed] [Google Scholar]
- 34.Fritschi L., McHenry P., Green A., Mackie R., Green L., Siskind V. Naevi in schoolchildren in Scotland and Australia. Br. J. Dermatol. 1994;130:599–603. doi: 10.1111/j.1365-2133.1994.tb13106.x. [DOI] [PubMed] [Google Scholar]
- 35.Bataille V., Grulich A., Sasieni P., Swerdlow A., Newton Bishop J., McCarthy W., Hersey P., Cuzick J. The association between naevi and melanoma in populations with different levels of sun exposure: a joint case-control study of melanoma in the UK and Australia. Br. J. Cancer. 1998;77:505–510. doi: 10.1038/bjc.1998.81. [DOI] [PMC free article] [PubMed] [Google Scholar]
- 36.Shaffer A.L., Emre N.C., Romesser P.B., Staudt L.M. IRF4: Immunity. Malignancy! Therapy? Clin. Cancer Res. 2009;15:2954–2961. doi: 10.1158/1078-0432.CCR-08-1845. [DOI] [PMC free article] [PubMed] [Google Scholar]
- 37.Wang S.S., Purdue M.P., Cerhan J.R., Zheng T., Menashe I., Armstrong B.K., Lan Q., Hartge P., Kricker A., Zhang Y. Common gene variants in the tumor necrosis factor (TNF) and TNF receptor superfamilies and NF-kB transcription factors and non-Hodgkin lymphoma risk. PLoS ONE. 2009;4:e5360. doi: 10.1371/journal.pone.0005360. [DOI] [PMC free article] [PubMed] [Google Scholar]
- 38.Gathany A.H., Hartge P., Davis S., Cerhan J.R., Severson R.K., Cozen W., Rothman N., Chanock S.J., Wang S.S. Relationship between interferon regulatory factor 4 genetic polymorphisms, measures of sun sensitivity and risk for non-Hodgkin lymphoma. Cancer Causes Control. 2009;20:1291–1302. doi: 10.1007/s10552-009-9348-5. [DOI] [PMC free article] [PubMed] [Google Scholar]
- 39.Grossman A., Mittrücker H.W., Nicholl J., Suzuki A., Chung S., Antonio L., Suggs S., Sutherland G.R., Siderovski D.P., Mak T.W. Cloning of human lymphocyte-specific interferon regulatory factor (hLSIRF/hIRF4) and mapping of the gene to 6p23-p25. Genomics. 1996;37:229–233. doi: 10.1006/geno.1996.0547. [DOI] [PubMed] [Google Scholar]
- 40.Natkunam Y., Warnke R.A., Montgomery K., Falini B., van De Rijn M. Analysis of MUM1/IRF4 protein expression using tissue microarrays and immunohistochemistry. Mod. Pathol. 2001;14:686–694. doi: 10.1038/modpathol.3880373. [DOI] [PubMed] [Google Scholar]
- 41.Sundram U., Harvell J.D., Rouse R.V., Natkunam Y. Expression of the B-cell proliferation marker MUM1 by melanocytic lesions and comparison with S100, gp100 (HMB45), and MelanA. Mod. Pathol. 2003;16:802–810. doi: 10.1097/01.MP.0000081726.49886.CF. [DOI] [PubMed] [Google Scholar]
- 42.Do T.N., Ucisik-Akkaya E., Davis C.F., Morrison B.A., Dorak M.T. An intronic polymorphism of IRF4 gene influences gene transcription in vitro and shows a risk association with childhood acute lymphoblastic leukemia in males. Biochim. Biophys. Acta. 2009;1802:292–300. doi: 10.1016/j.bbadis.2009.10.015. [DOI] [PubMed] [Google Scholar]
- 43.Wellcome Trust Case Control Consortium Genome-wide association study of 14,000 cases of seven common diseases and 3,000 shared controls. Nature. 2007;447:661–678. doi: 10.1038/nature05911. [DOI] [PMC free article] [PubMed] [Google Scholar]
- 44.Cho E., Rosner B.A., Colditz G.A. Risk factors for melanoma by body site. Cancer Epidemiol. Biomarkers Prev. 2005;14:1241–1244. doi: 10.1158/1055-9965.EPI-04-0632. [DOI] [PubMed] [Google Scholar]
- 45.Hindorff L.A., Sethupathy P., Junkins H.A., Ramos E.M., Mehta J.P., Collins F.S., Manolio T.A. Potential etiologic and functional implications of genome-wide association loci for human diseases and traits. Proc. Natl. Acad. Sci. USA. 2009;106:9362–9367. doi: 10.1073/pnas.0903103106. [DOI] [PMC free article] [PubMed] [Google Scholar]
- 46.Maher B. Personal genomes: The case of the missing heritability. Nature. 2008;456:18–21. doi: 10.1038/456018a. [DOI] [PubMed] [Google Scholar]
Associated Data
This section collects any data citations, data availability statements, or supplementary materials included in this article.