Abstract
In reverberant environments, acoustic reflections interfere with the direct sound arriving at a listener's ears, distorting the binaural cues for sound localization. We investigated the effects of reverberation on the directional sensitivity of single neurons in the inferior colliculus (IC) of unanesthetized rabbits. We find that reverberation degrades the directional sensitivity of single neurons, although the amount of degradation depends on the characteristic frequency (CF) and the type of binaural cues available. When interaural time differences (ITDs) are the only available directional cue, low-CF cells sensitive to ITDs in the waveform fine time structure maintain better directional sensitivity in reverberation than high-CF cells sensitive to ITDs in the envelope induced by cochlear filtering. Conversely, when both ITD and interaural level difference (ILD) cues are available, directional sensitivity in reverberation is comparable throughout the tonotopic axis of the IC. This result suggests that, at high frequencies, ILDs provide better directional information than envelope ITDs, emphasizing the importance of the ILD-processing pathway for sound localization in reverberation.
Introduction
Indoors and in nature alike, the auditory scenes that we perceive unfold in reverberant environments. In a reverberant sound field, reflected acoustic waves reach the listener from all directions, interfering with the direct sound at a listener's ears and distorting the binaural cues for sound localization, including interaural time (ITDs) and level differences (ILDs). Although human listeners rely primarily on low-frequency ITD cues for localizing a single sound source in an anechoic environment (Wightman and Kistler, 1992; Macpherson and Middlebrooks, 2002), they are likely to use whatever cues are the most reliable in challenging listening conditions involving multiple sources and reverberation (Rakerd and Hartmann, 1985). In some circumstances, listeners may also use ITD cues available in the amplitude envelopes of high-frequency sounds, which can be as effective for lateralization as ITDs in the waveform fine structure of low-frequency sounds (Bernstein and Trahiotis, 2002). In previous work (Devore et al., 2009), we showed that reverberation degrades the directional sensitivity of low-frequency ITD-sensitive neurons in the auditory midbrain, although not as much as predicted by current models of binaural processing. Here, we extend that work by characterizing directional sensitivity in neurons across a wide range of the tonotopic axis and assessing the influence of individual binaural cues.
Neural sensitivity to binaural cues emerges in two separate circuits in the auditory brainstem (Goldberg and Brown, 1969; Caird and Klinke, 1983; Yin and Chan, 1990; Joris and Yin, 1995). ITD sensitivity arises in the medial (MSO) and lateral (LSO) superior olives through detection of coincidences between precisely timed monaural inputs from the two ears. Whereas MSO neurons receive low-frequency excitatory inputs from the two sides and are predominantly sensitive to ITDs (Goldberg and Brown, 1969; Yin and Chan, 1990), LSO neurons receive excitatory inputs from the ipsilateral side and inhibitory inputs from the contralateral side and are sensitive to both ILD and ITD (Boudreau and Tsuchitani, 1968; Joris and Yin, 1995; Batra et al., 1997a; Tollin and Yin, 2005). Both MSO and LSO form direct excitatory projections to the inferior colliculus (IC), the primary nucleus in the auditory midbrain, in which most neurons are sensitive to binaural cues. Although binaural properties in the IC often mirror those of its brainstem inputs, some neurons exhibit emerging forms of tuning that are not observed or are less prevalent in the brainstem (Batra et al., 1993; Fitzpatrick et al., 2002). In general, lower characteristic frequency (CF) IC neurons are sensitive to ITD in stimulus fine structure, whereas at higher CFs, IC neurons are sensitive to ITD in envelopes (Yin et al., 1984; Batra et al., 1993; Joris, 2003; Griffin et al., 2005), although for stimuli with naturally co-occurring binaural cues, ILD may be a more potent directional cue than envelope ITDs in high-frequency neurons (Delgutte et al., 1995).
Here, we use virtual auditory space techniques to characterize the effects of reverberation on the directional sensitivity of IC neurons in unanesthetized rabbits and examine the role of individual binaural cues in these effects. We find that reverberation degrades the directional sensitivity of IC neurons, although the amount of degradation depends on the CF, the type of binaural sensitivity, and which binaural cues are available.
Materials and Methods
Surgical preparation.
Methods for recording from single neurons in the IC of unanesthetized Dutch-Belted rabbits (Oryctolagus cuniculus) were developed based on the techniques of Kuwada et al. (1987) and Nelson and Carney (2007). All procedures were approved by the animal care and use committees of both the Massachusetts Eye and Ear Infirmary and the Massachusetts Institute of Technology.
Under aseptic conditions, animals were anesthetized with an intramuscular injection of acepromazine (1 mg/kg), ketamine (44 mg/kg), and xylazine (6 mg/kg). A stainless steel cylinder and brass head bar were affixed to the skull using stainless steel screws and dental acrylic. At the end of the procedure, custom ear mold impressions were taken using vinyl polysiloxane (Reprosil).
After a 2 week recovery period, animals were habituated to the experimental setup until they could sit quietly for 2–3 h with the head fixed. Subsequently, the animals underwent a second aseptic surgical procedure in which a small (∼3 mm diameter) craniotomy was made 10.5 mm posterior and 3 mm lateral to bregma. The exposed area was covered with a topical antibiotic (Bacitracin) and covered with sterile elastopolymer (Sammons-Preston). We commenced daily recording sessions after a 2 d recovery period.
Virtual space stimuli.
Virtual space stimuli were created by convolving reproducible 400 ms broadband noise bursts with binaural room impulse responses (BRIRs) simulated using the room-image method (Allen and Berkley, 1979; Shinn-Cunningham et al., 2001). BRIRs were computed between a point source and a pair of receivers located in the center of a virtual room measuring 11 × 13 × 3 m (Devore et al., 2009). BRIRs were calculated for source azimuths in the frontal hemifield (−90° to +90°) at a distance of 1 m with respect to the midpoint of the receivers.
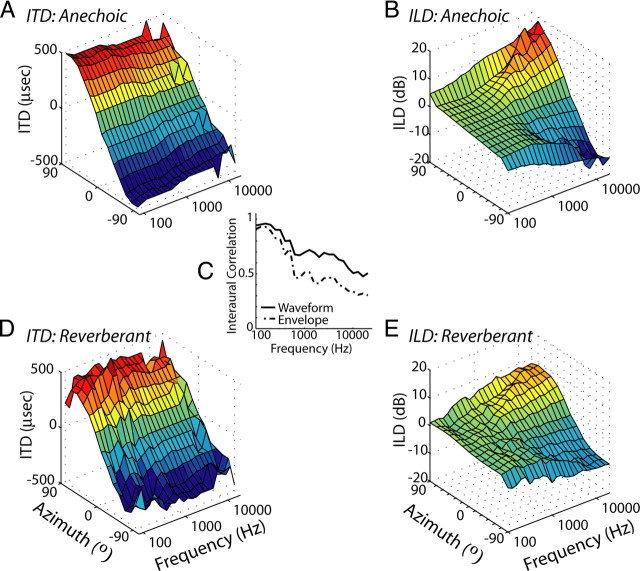
Two sets of reverberant BRIRs, called “ITD-only” and “ITD+ILD,” were simulated. The ITD-only set did not include a model of the head in the simulations, so that ITD varied systematically with azimuth in the resulting BRIRs, whereas ILD remained near 0 dB for all azimuths. The inter-receiver distance (12 cm) was chosen to ensure that ITDs spanned the ±360 μs range typically encountered by rabbits (Bishop et al., 2009). In the ITD+ILD set, we modeled the rabbit head as a rigid sphere, so that ITD and ILD covaried with azimuth. Introducing a rigid sphere between two receivers results in a frequency-dependent increase in ITD (Kuhn, 1977). To compensate for this, we chose the diameter of the sphere (10 cm) so that broadband ITDs were approximately equal for the ITD-only and ITD+ILD BRIRs. Anechoic impulse responses were generated by time windowing the direct wave front from both sets of reverberant BRIRs. We normalized all sets of BRIRs to obtain equal intensity at the receivers for a broadband source at 0°. Figure 1 shows three-dimensional surface plots of waveform ITD and ILD as a function of frequency (⅓-octave bands) and source azimuth for anechoic and reverberant BRIRs in the ITD+ILD condition. In general, reverberation does not strongly affect the mean waveform ITD (Fig. 1A,D), although the variability is increased. The peak interaural correlations of both the stimulus waveform and its Hilbert envelope decrease with increasing center frequency in reverberation (Fig. 1C). The effect is more pronounced for the envelope, especially at higher frequencies. Reverberation also reduces the overall magnitude of ILDs (Fig. 1B,E), especially at higher frequencies in which the ILDs are larger.
Figure 1.
Analysis of binaural cues for virtual space stimuli. A, D, Waveform ITD as a function of frequency and virtual source azimuth for anechoic (A) and reverberant (D) ITD+ILD virtual space stimuli used in the present experiments. Waveform ITD is estimated as the delay corresponding to the peak of the interaural cross-correlation function computed in ⅓-octave bands. C, Peak interaural correlation as a function of center frequency computed in ⅓-octave bands from the stimulus waveform (solid line) and its Hilbert envelope (dashed line). Graph depicts average value across all azimuths. B, E, ILD computed in ⅓-octave bands as a function of filter center frequency and virtual source azimuth for the anechoic (B) and reverberant (E) ITD+ILD virtual space stimuli.
Additional sets of ITD-only BRIRs were created for different distances (0.5 and 3 m) between source and receiver. Because ITD-only stimuli have ILDs near 0 dB, the ratios of direct-to-reverberant energies (D/R) are similar in both ears and for all azimuths. Thus, we defined an overall D/R for the ITD-only stimuli by averaging across azimuths and ears (average D/R: 0.5 m, +10 dB; 1 m, 0 dB; 3 m, −9 dB). As a consequence of the decreasing D/R, peak interaural correlation also decreases with increasing source-to-listener distance in the simulated environment (Devore et al., 2009).
Experimental procedures.
Sound stimuli were generated by a 24-bit digital-to-analog converter (National Instruments NIDAC 4461) at a sampling rate of 50 kHz and digitally filtered to compensate for the transfer function of the acoustic assemblies. The acoustic assemblies consisted of a pair of Beyer-Dynamic (DT-48) speakers attached to sound tubes running through the custom-fitted ear molds. A probe-tube microphone (Etymotic ER-7C) measured acoustic pressure in the ear canal at the end of the sound delivery tube. At the start of each recording session, we determined the system transfer function in each ear using a broadband chirp stimulus and generated digital equalization filters over the range of 0.1–22.5 kHz.
Single neurons were isolated using epoxy-insulated tungsten electrodes (A-M Systems) inserted through a 25 gauge guide tube and advanced using a remote-controlled hydraulic micropositioner (David Kopf Instruments 650). The neural signal was amplified, bandpass filtered between 0.3 and 3kHz, and fed to a software spike detector triggering on level crossings. Spike times were saved to disk for subsequent analysis.
The search stimulus was a sinusoidally amplitude-modulated (40 Hz) broadband noise burst presented diotically at a nominal level of 65 dB sound pressure level. Multiunit frequency tuning was assessed audio visually at ∼500 μm intervals once the electrode entered the IC, as determined by the emergence of neural activity synchronized to the search stimulus. When a single neuron was well isolated, its CF was determined using an automatic tracking procedure (Kiang and Moxon, 1974) or by presenting a series of 50 ms tone pips of different frequencies near threshold. We also determined the rate threshold for diotic (and sometimes contralateral) broadband noise by measuring a rate-level function.
Animals were monitored on a closed-circuit video system throughout recording sessions, which typically lasted 2–3 h but were terminated immediately if the animal showed any signs of discomfort. During the final recording session, recording sites were marked by electrolytic lesions (10 μA direct current for 30–45 s); subsequent histological examination verified the lesion sites to be within the IC. Because tens to hundreds of penetrations were made over months, it was not possible to reconstruct the position of each recording site within the IC. Rather, we relied primarily on physiological criteria to define individual recording sites as “central nucleus-like” (Nelson et al., 2009): (1) the site fit into an orderly tonotopic progression along the dorsoventral axis of the penetration and (2) the response was nonhabituating across trials. Neurons that did not meet both criteria were excluded from data analysis.
Characterization of ITD and ILD sensitivity.
ITD sensitivity was assessed by measuring firing rate as a function of ITD (±2000 μs in 200 μs steps) for 200 ms broadband homophasic noise bursts at 15–20 dB above threshold. A neuron was considered ITD sensitive if an ANOVA for the distribution of firing rates across ITD showed a statistically significant effect of ITD (p < 0.05). If the neuron was sensitive, the best ITD was defined as the ITD producing the maximum response. To determine whether neurons were sensitive to ITDs in the amplitude envelope or ITDs in the waveform fine structure (Joris, 2003), in many neurons, we also measured a delay function using a similar procedure but with the noise waveform inverted at one ear. In a subset of neurons, we measured rate responses at the best ITD as a function of the interaural cross-correlation coefficient (IACC). We used a Gramm–Schmidt orthogonalization procedure (Culling et al., 2001) to create a pairs of 400 ms noise bursts with prescribed IACC between +1 and −1. In all measurements, the independent variable (ITD and IACC) was randomly varied from trial to trial, and we obtained at least five (but typically 8–10) repeats for each value of ITD/IACC.
ILD sensitivity was assessed using 200 ms broadband noise bursts (with the same waveform at the two ears) by simultaneously increasing the intensity at the contralateral ear by +ILD/2 and decreasing the intensity at the ipsilateral ear by ILD/2, keeping the average binaural level constant at 15–20 dB above threshold. ILD was typically varied over ±30 dB. Neurons were classified as ILD sensitive using the same ANOVA criterion as described above for ITD sensitivity.
Characterization of directional sensitivity.
In general, only ITD-sensitive neurons were studied with the virtual space stimuli, although we occasionally characterized directional sensitivity in cells sensitive to ILD but not ITD.
Directional responses were obtained for each virtual room condition (anechoic and reverberant) and virtual space stimulus type (ITD-only and ITD+ILD) in pseudorandom order. In initial experiments, we exclusively studied responses to ITD-only stimuli. We typically used 13 azimuths (15° spacing) or, occasionally, 7 azimuths (30° spacing), randomized on a trial-by-trial basis, obtaining typically 10 (range of 8–25) presentations of the stimulus at each azimuth. Stimuli were presented at 15–20 dB above broadband noise threshold. Time permitting, we characterized directional sensitivity using virtual space stimuli with different D/R.
Data analysis.
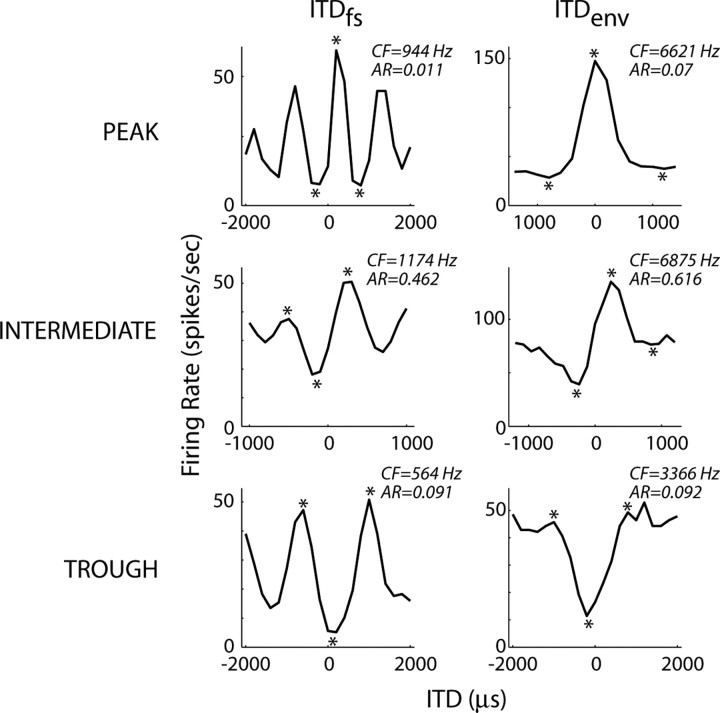
ITD-sensitive neurons in the auditory brainstem and midbrain are often classified as peak type or trough type based on rate-ITD functions for pure tones of different frequencies (Yin and Kuwada, 1983; Batra et al., 1993). Because this classification is thought to provide information about the neural mechanisms giving rise to ITD sensitivity, we developed a similar classification based on the shape of the delay function for homophasic noise. To do so, we determined the three local extrema nearest 0 μs (see Fig. 10, asterisks). Neurons were initially classified as either peak or trough depending on whether the central extremum was a maximum (peak) or minimum (trough). Next, we computed an asymmetry ratio, , where R1, R2, and R3 are the firing rates at the three extrema, with R2 being the central extremum. If the asymmetry ratio exceeded 0.25, the neuron was reclassified as intermediate. Example noise delay functions from each of the three ITD tuning shape classes are shown in Figure 10, with the asymmetry ratio indicated in each panel.
Figure 10.
ITD tuning shape groups. Example noise delay functions for low-CF, ITDfs-sensitive (left column) and high-CF, ITDenv-sensitive (right column) IC neurons selected from each of the three ITD tuning shape groups (peak, top row; intermediate, middle row; trough, bottom row). The asterisks point to the three local extrema used to determine the tuning type (see Materials and Methods). AR, Absolute range.
For each room condition, a directional response function was computed by averaging the number of spikes that occurred in a 400 ms window after stimulus onset across all trials for each azimuth. Directional response functions were smoothed across azimuths using a three-point triangular smoothing filter having weights [⅙, ⅔, ⅙]. For conditions in which we obtained a sufficient number of trials (>15), we quantified neural sensitivity to azimuth by estimating the mutual information (MI) between the stimulus azimuth s and neural firing rate r (or, equivalently, spike count) as MI = , where p(s) is the probability distribution of source azimuths (assumed to be uniform), p(r) is the distribution of spike counts combined across all azimuths, and p(s, r) is the joint distribution of stimulus azimuth and spike count (Cover and Thomas, 1991). We used a bootstrap resampling method (Chase and Young, 2005) to correct for biases in our estimates of MI attributable to small sample sizes. Information transfer was defined as the debiased MI expressed as a percentage of the entropy of the uniform stimulus distribution, .
Results
We studied the effects of reverberation on the directional rate responses of single neurons in the IC of unanesthetized rabbits, focusing on neurons sensitive to ITD in broadband noise. Our aim was twofold: first, to characterize the effects of reverberation on neural sensitivity to ITD across the tonotopic axis, and second, to elucidate the influence of ILD on directional sensitivity in reverberation.
Sensitivity to ITD in fine time structure versus envelope
We measured responses to broadband noise as a function of ITD in 791 neurons in the inferior colliculi of four unanesthetized rabbits. A large fraction of these neurons were sensitive to ITD (475 of 791 neurons, 60%). However, this fraction may not be representative of the entire nucleus, because we approached the IC dorsally, resulting in a bias toward neurons with lower CFs.
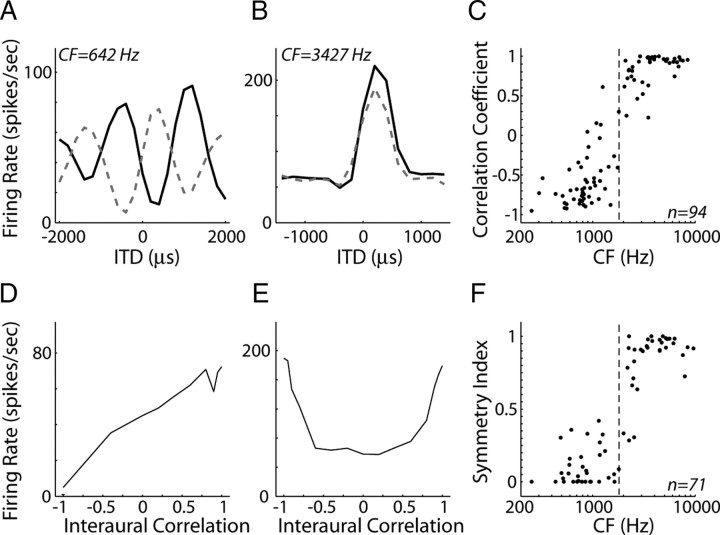
As in the IC of anesthetized cat (Joris, 2003), we find that lower CF neurons are primarily sensitive to ITD in the fine time structure of the noise waveform (ITDfs), whereas higher CF neurons are sensitive to ITD in the amplitude envelope induced by cochlear filtering (ITDenv). ITDfs and ITDenv sensitivity were distinguished by comparing noise delay functions obtained with homophasic and antiphasic noise (Fig. 2A,B). Inverting the stimulus at one ear causes a 180° phase shift in fine time structure but does not alter the envelope. Thus, in ITDfs-sensitive cells (Fig. 2A), noise delay functions for homophasic stimuli show peaks and valleys that interleave with those of noise delay functions obtained with antiphasic stimuli, whereas the two noise delay functions are similar in ITDenv-sensitive cells (Fig. 2B). Figure 2C shows the correlation coefficient between noise delay functions measured with homophasic and antiphasic stimuli as a function of CF. The correlation coefficient transitions from negative values (indicating ITDfs sensitivity) to positive values (indicating ITDenv sensitivity) as CF increases from 0.8 to 3 kHz, consistent with Joris' (2003) results in anesthetized cat.
Figure 2.
Transition from fine time structure to envelope ITD sensitivity in IC neurons. A, B, Homophasic (solid line) and antiphasic (dashed line) noise delay functions for two IC neurons with CFs of 642 Hz (A) and 3427 Hz (B). C, Correlation coefficient between homophasic and antiphasic noise delay functions versus CF for our sample of IC neurons. D, E, Firing rate as a function of waveform interaural correlation measured at best delay for the same neurons as in A and B. F, Symmetry index of rate-interaural correlation functions versus CF across our sample of IC neurons. Dashed lines in C and F show the CF cutoff that best separates ITDfs-sensitive neurons from ITDenv-sensitive neurons.
ITDfs and ITDenv sensitivity can alternatively be distinguished by examining the symmetry in rate responses as a function of IACC for interaurally decorrelated noise pairs at the best ITD. ITDfs-sensitive cells (Fig. 2D) generally have asymmetric rate-IACC curves that increase nearly monotonically as the interaural correlation coefficient is increased from −1 (anticorrelated) to +1 (perfectly correlated), whereas in ITDenv-sensitive cells (Fig. 2E). the rate-IACC curve is nonmonotonic and symmetric about an IACC of 0 (uncorrelated).
We quantified the shape of a rate-IACC curve by computing a symmetry index, 1 − , where r is the vector of firing rates across IACC. The symmetry index is 0 for asymmetric, monotonic curves (Fig. 2D) and reaches a maximum of 1 for symmetric, nonmonotonic curves (Fig. 2E). Figure 2F shows the symmetry index as a function CF, demonstrating a transition from ITDfs to ITDenv sensitivity between 0.8 and 3.0 kHz, consistent with that found using homophasic and antiphasic noise delay functions (Fig. 2C).
Because we could not obtain all the necessary data to quantitatively distinguish ITDfs sensitivity from ITDenv sensitivity for every neuron in our sample, we devised a classification procedure based on CF alone. We optimized the CF boundary using the data in Figure 2 by assuming that correlation coefficients ≤0 or symmetry indices ≤0.5 indicate ITDfs sensitivity, whereas correlation coefficients >0 or symmetry indices >0.5 indicate ITDenv sensitivity. A CF boundary of 1.85 kHz minimized the number of classification errors (Fig. 2C,F, dashed lines); thus, we assume that neurons with CFs <1.85 kHz are primarily sensitive to ITDfs and neurons with CFs >1.85 kHz are primarily sensitive to ITDenv.
Directional sensitivity for anechoic ITD-only virtual space stimuli
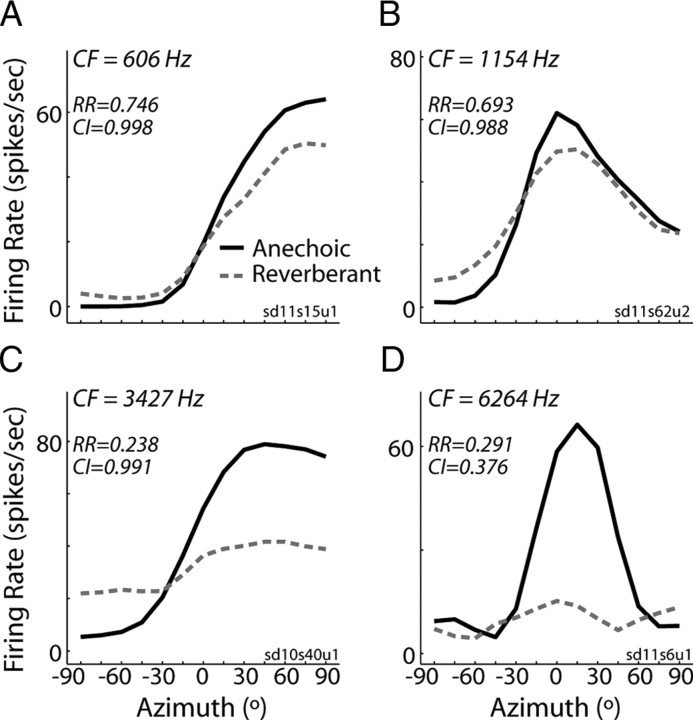
We characterized directional sensitivity using anechoic ITD-only virtual space stimuli in 194 ITD-sensitive IC neurons. The CFs for this sample of neurons spanned 255–9600 Hz, with approximately half (102 of 194) below 2 kHz. Because the ILD is always near 0 dB for these stimuli, anechoic directional response functions are essentially equivalent to noise delay functions sampled with fine resolution within the naturally occurring range of ITD (Fig. 3, black lines). In general, neurons tended to respond more vigorously to sources in the hemifield contralateral to the recording site (Fig. 3A,C, positive azimuths), although some neurons had nonmonotonic directional response functions with a clear best azimuth (Fig. 3B,D).
Figure 3.
Directional rate responses to ITD-only stimuli. Anechoic (solid lines) and reverberant (dashed lines) directional response functions obtained using ITD-only virtual space simulations for four IC neurons. The relative range (RR) and correlation index (CI) metrics for each unit are indicated in each panel.
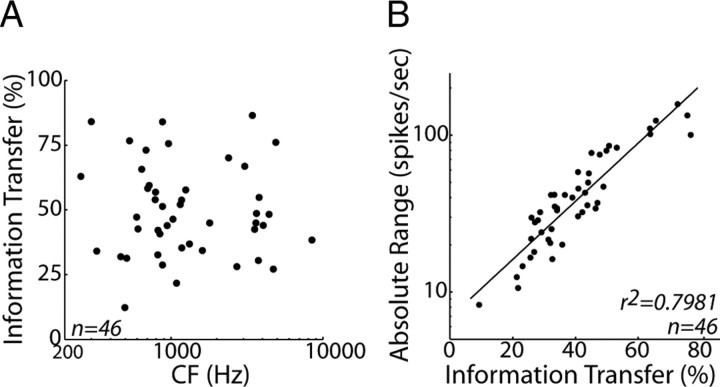
In those neurons in which responses to a large number of stimulus trials were measured at each azimuth (46 of 194 neurons), we quantified directional sensitivity by computing the information transfer between stimulus azimuth and spike count (see Materials and Methods). Information transfer measures the extent to which the stimulus azimuth is unambiguously encoded by the spike count and is sensitive to both mean firing rate and trial-to-trial variability in firing rates. Information transfer does not depend systematically on CF (Fig. 4A) (r2 = 0.001, p = 0.65), suggesting that neurons across a wide range of the tonotopic axis exhibit comparable sensitivity to virtual source azimuth in the anechoic condition. Consistent with results from the IC of anesthetized cat (Devore et al., 2009), we find that information transfer is highly correlated with the absolute range of firing rates [max(R) − min(R)] across azimuths (Fig. 4B) (r2 = 0.79, p < 0.001). Because we did not present enough stimulus trials to reliably estimate information transfer for all of the neurons in our sample, we quantify directional sensitivity over the entire sample using the absolute range.
Figure 4.
Information transfer is related to absolute range of firing rates. A, Information transfer between stimulus azimuth and spike count versus CF for the 46 neurons in which we measured responses to enough stimulus trials to reliably estimate information transfer. B, Absolute range of firing rates versus information transfer for the same sample of neurons.
Absolute range is highly variable across our neuron sample, although it shows no systematic dependence on CF. Figure 5A shows a scatter plot of absolute range against CF for our sample of ITD-sensitive IC neurons. The solid line represents the mean absolute range within each of six frequency bins containing approximately equal numbers of data points (edge frequencies of 250, 700, 950, 2000, 3500, 5000, and 10,000 Hz). Neurons in the lower three CF bins are primarily sensitive to ITDfs, whereas neurons in the upper three bins are primarily sensitive to ITDenv (Fig. 2C,F). There is no significant effect of CF on the mean absolute range (ANOVA, F(5,188) = 0.66, p = 0.656), indicating that, for anechoic stimuli, comparable directional information is available in the rate responses of ITDfs- and ITDenv-sensitive neurons.
Figure 5.
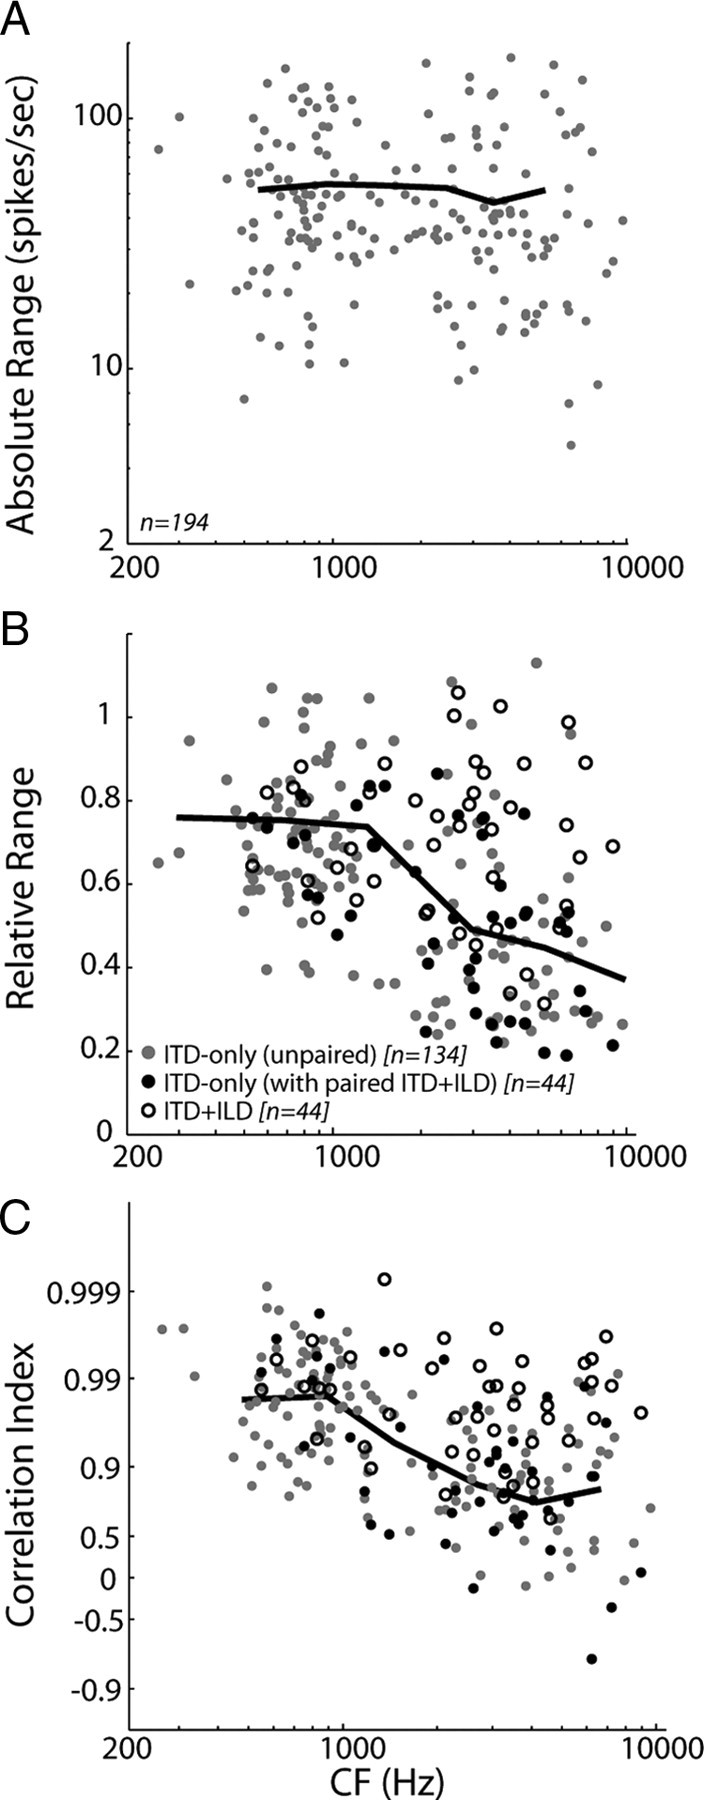
Directional sensitivity for anechoic and reverberant stimuli. A, Absolute range of firing rates versus CF across our sample of IC neurons. Solid line shows the mean absolute ranges in each of six frequency bins (edge frequencies of 250, 700, 950, 2000, 3500, 5000, and 10,000 Hz) containing approximately equal numbers of data points. B, Relative range of firing rates versus CF for ITD-only stimuli (filled symbols) and ITD+ILD stimuli (open symbols). Black and gray filled symbols represent the entire population of neurons tested with ITD-only stimuli; the darker coloring indicates those units in which we additionally obtained responses using ITD+ILD stimuli. Solid line shows the mean relative ranges for ITD-only stimuli in the same six frequency bins as in A. C, Correlation index between anechoic and reverberant response functions versus CF for ITD-only stimuli (filled symbols) and ITD+ILD stimuli (open symbols). Same symbol conventions as in B. Solid line shows the mean correlation index for ITD-only stimuli in the same frequency bins as in A.
Effect of reverberation on directional sensitivity with ITD-only stimuli
Our results so far show that neurons across a wide range of the tonotopic axis are equally capable of encoding the naturally occurring range of ITD via their spike rates. However, differences between neurons sensitive to ITDfs and ITDenv emerge when reverberation is introduced. We measured directional response functions in 178 neurons using ITD-only reverberant virtual space stimuli that had a D/R of 0 dB, typical of sound sources at a moderate distance from a listener in a classroom. In general, reverberation causes a compression of the range of firing rates (Fig. 3, dashed lines), such that peak firing rates are reduced and minimum firing rates increased. This observation is consistent with previous results for low-CF, ITDfs-sensitive neurons in the IC of anesthetized cat and can be partly accounted for by the decrease in interaural correlation between the ear input signals in reverberation (Devore et al., 2009). Here, we find that the compression is noticeably more pronounced in high-CF, ITDenv-sensitive neurons (Fig. 3, bottom row) than in low-CF, ITDfs-sensitive neurons (Fig. 3, top row).
To quantify the effects of reverberation on directional sensitivity in individual neurons, we computed the relative range: the ratio of the range of firing rates across azimuths in reverberation to the range of firing rates in the anechoic condition. The black and gray filled symbols in Figure 5B together represent the relative range versus CF for the population of neurons tested using ITD-only stimuli. The different colors distinguish between those units that were further tested with ITD+ILD stimuli (Fig. 5B, filled black symbols) and those that were not (Fig. 5B, filled gray symbols). The solid line depicts the mean relative range in each of the same six frequency bins as in Figure 5A, computed from all the neurons tested with ITD-only stimuli. Although relative range is somewhat variable within each bin, there is a significant dependence on CF (ANOVA, F(5,172) = 13.54, p < 0.001). Post hoc multiple comparisons (with Bonferroni's corrections) reveal that the relative range is significantly smaller in each of the three higher CF bins than in each of the three lower bins (p < 0.002, all pairwise comparisons). This trend can be at least partially attributed to the decrease in interaural correlation in the stimulus waveform with increasing frequency in reverberation (Fig. 1C, solid line). However, at all frequencies, reverberation causes more decorrelation of the stimulus envelope than the overall waveform (Fig. 1C, compare solid and dashed lines). Thus, the fact that directional sensitivity is worse at high CFs may also reflect the transition from ITDfs to ITDenv sensitivity with increasing CF.
In a subset of neurons, we measured directional response functions using ITD-only virtual space stimuli with different amounts of reverberation, quantified by the D/R (see Materials and Methods). Consistent with previous results obtained from IC neurons in anesthetized cat (Devore et al., 2009), lowering D/R (i.e., increasing reverberation) typically resulted in increasing compression of the range of firing rates, although the compression was more pronounced in high-CF neurons (Fig. 6). For all D/R, the relative range was lower in high-CF neurons than in low-CF neurons (t test, p < 0.01).
Figure 6.
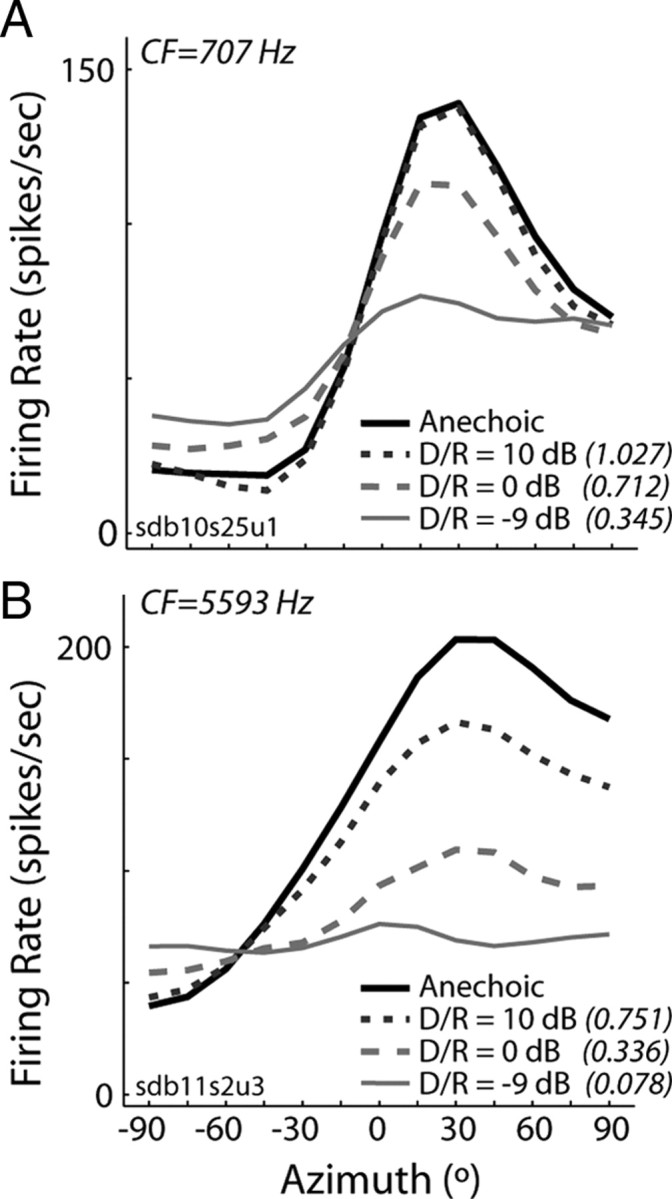
Directional sensitivity degrades with increasing reverberation. A, B, Directional response functions obtained from two IC neurons using ITD-only virtual space stimuli with different amounts of reverberation, quantified by the D/R.
Ultimately, the functional consequences of directional response function compression depend on the form of the downstream neural decoder. We showed previously that, if the decoder compares the total neural activity elicited by a sound source in each hemisphere of the brain, then directional response function compression causes a reduction in the range of outputs from the decoder and therefore degrades sound localization accuracy (Devore et al., 2009). Conversely, if the neural code for sound localization involves a labeled-line readout of the activity profile in a population of ITD-tuned neurons, as in the Jeffress (1948) model, then decoding accuracy might not be greatly affected if only the gain of the activity profile, rather than the shape of the profile, is altered. (Nevertheless, the precision of decoding would still be degraded if the compression of the range of firing rates causes an increase in the coefficient of variation, as would be the case for Poisson firings.)
To address this issue, we examined the effect of reverberation on the shape of directional response functions. We used the Pearson's product-moment correlation coefficient to measure the similarity between anechoic and reverberant directional response functions. The filled symbols in Figure 5C show the correlation coefficient as a function of CF for ITD-only stimuli. As with the relative range shown in Figure 5B, the black and gray filled symbols together represent the neurons tested with ITD-only stimuli. In general, the correlation coefficient is high at low CFs, suggesting that reverberation has only minor effects on the shape of directional response functions. However, there is a significant dependence of the correlation coefficient on CF (ANOVA, F(5,172) = 20.86, p < 0.001), with the correlation coefficient decreasing, on average, as CF increases (Fig. 5C, solid line). These results suggest that, for ITD-only stimuli, directional information from high-CF, ITDenv-sensitive neurons is degraded in reverberant settings, as measured by both changes in the gain and shape of directional response functions.
Directional sensitivity for stimuli with covarying ITD and ILD
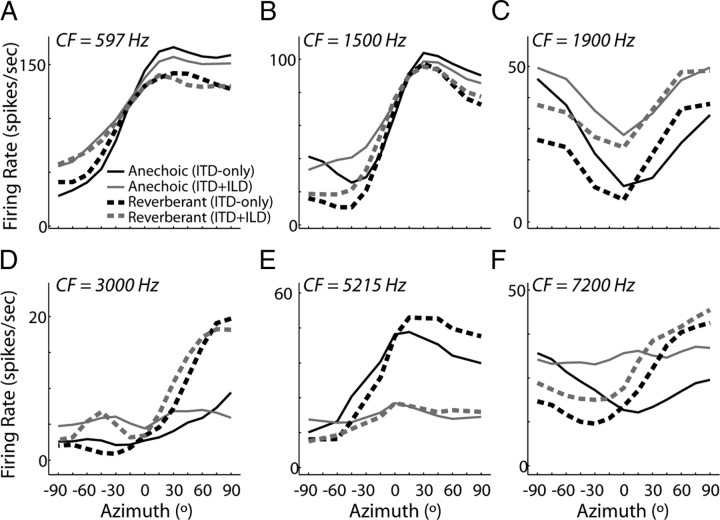
To examine the effects of reverberation in more realistic conditions, we further characterized directional sensitivity in 44 ITD-sensitive IC neurons using the ITD+ILD virtual space stimuli that had an azimuth-dependent ILD in addition to ITD (Fig. 1E). Figure 7 shows anechoic (black) and reverberant (gray) directional response functions from six IC neurons obtained using ITD+ILD stimuli (dashed lines) along with responses to ITD-only stimuli (solid lines). For high-CF, ITDenv-sensitive neurons (Fig. 7, bottom row), there is a systematic, azimuth-dependent difference between directional response functions for ITD-only and ITD+ILD stimuli. Namely, firing rates for ITD+ILD stimuli tend to be lower than ITD-only firing rates at ipsilateral azimuths (negative ILDs) and higher at contralateral azimuths (positive ILDs), often resulting in a larger absolute range of firing rates. For low-CF, ITDfs-sensitive neurons, the differences between directional responses to ITD-only and ITD+ILD stimuli were less prominent and less systematic (Fig. 7, top row).
Figure 7.
Directional responses obtained using ITD+ILD stimuli. A–F, Anechoic (black lines) and reverberant (gray lines) DRF obtained from six ITD-sensitive IC neurons using ITD-only (solid lines) and ITD+ILD (dashed lines) virtual space stimuli. Neurons in the left, middle, and right columns belong to the intermediate-, peak-, and trough-type ITD tuning shape groups, respectively.
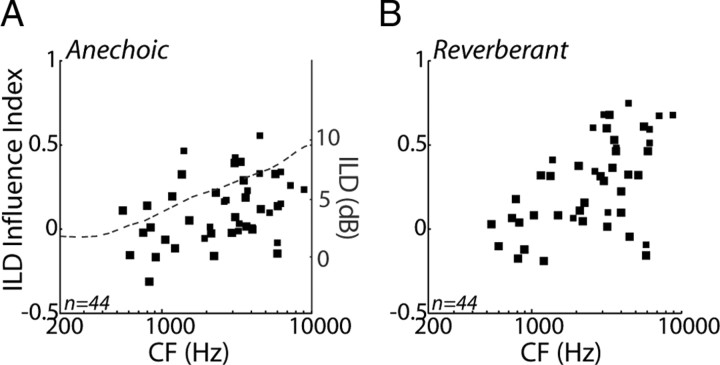
To quantify the effects of ILD on the directional sensitivity, we defined an ILD influence index as, . The ILD influence index takes on values between +1 and −1, in which positive values indicate that the absolute range is larger for ITD+ILD stimuli than for ITD-only stimuli, meaning that ILD contributes to the coding of source azimuth. Figure 8A shows the ILD influence index as a function of CF for the anechoic condition. We split the sample of neurons into low (<1850 Hz) and high (>1850 Hz) CF groups, essentially dividing the sample on the basis of ITDfs sensitivity and ITDenv sensitivity (Fig. 2C,F). The ILD influence index is significantly larger than zero in the high-CF group (one-sided t test, p < 0.001) but not in the low-CF group (p = 0.71), indicating an increasing influence of ILD at higher CFs. In fact, the ILD influence index approximately parallels the frequency dependence of ILDs for ⅓-octave bands in the 90° ITD+ILD virtual space stimuli (Fig. 8A, dashed line), suggesting at least a partial acoustic origin for the increasing influence of ILD with CF in the anechoic condition.
Figure 8.
Influence of ILD on directional sensitivity. A, ILD influence index for anechoic condition versus CF for the 44 IC neurons studied with ITD+ILD stimuli. Dashed line shows the ILD computed in ⅓-octave bands from the anechoic 90° ITD+ILD virtual space stimulus. B, ILD influence index for reverberant condition versus CF for the 44 IC neurons studied with ITD+ILD stimuli.
Consistent with the results for ITD-only stimuli, reverberation generally causes a compression of directional response functions for ITD+ILD stimuli. In low-CF, ITDfs-sensitive neurons, reverberation has a similar effect on rate responses for both types of virtual space stimuli (Fig. 7, top row). In contrast, in high-CF neurons (Fig. 7, bottom row), the range of firing rates in the directional response function often exhibits much less compression for ITD+ILD stimuli than for ITD-only stimuli (Fig. 7D,F), although in some neurons the compression is similar in both conditions (Fig. 7E).
There is an increasing influence of ILD with increasing CF on the absolute range of firing rates for reverberant directional response functions (Fig. 8B). At high CFs, the ILD influence index is larger in the reverberant than in the anechoic condition (p < 0.001) as a result of the severe compression of directional response functions in the ITD-only condition, whereas such compression is more moderate in the ITD+ILD condition. At low CFs, conversely, the ILD influence is comparable in anechoic and reverberant conditions (p = 0.51).
Particularly at high CFs, directional sensitivity is less degraded by reverberation for ITD+ILD stimuli than for ITD-only stimuli. Figure 5B show the relative range plotted against CF for ITD-only (Fig. 5B, filled black circles) and ITD+ILD (Fig. 5B, open black symbols) stimuli for the 44 neurons in which responses to both types of virtual space stimuli were measured. The relative range is larger in the ITD+ILD condition than in the ITD-only condition at high CFs (t test, p < 0.001) but not low CFs (p = 0.51). Consequently, directional sensitivity in reverberation is comparable across the entire tonotopic axis for the more realistic ITD+ILD stimuli, whereas in the ITD-only condition, there is less directional information available from high-CF neurons.
A similar trend holds when we examine the effects of reverberation on the detailed shape of directional response functions. At high CFs, the correlation coefficient is significantly larger for directional response functions obtained with stimuli containing covarying ITD and ILD (Fig. 5C, open black symbols) than for ITD-only stimuli (Fig. 5C, filled black symbols) (t test, p < 0.001). Conversely, at low CFs, the correlation coefficients for the two stimulus conditions are not significantly different (p = 0.10). To the extent that the responses of high-CF neurons are less degraded by reverberation when stimuli contain ILD that covary with ITD, these results suggest that ILDs may provide more reliable directional information than ITDenv in reverberation.
Directional sensitivity in reverberation for exclusively ILD-sensitive neurons
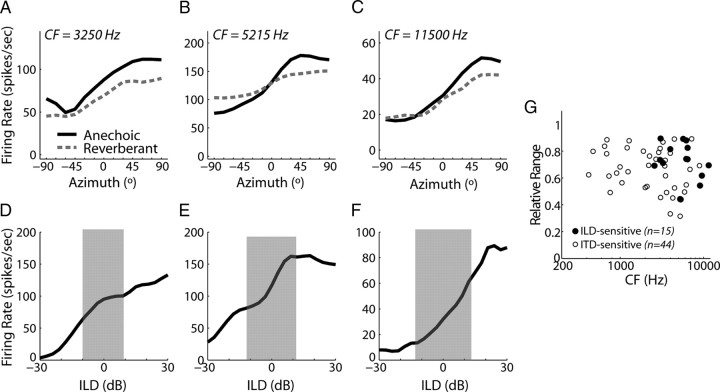
To directly examine the effects of reverberation on ILD sensitivity, we measured directional response functions using the ITD+ILD stimuli in 15 high-CF neurons (2575–11,500 Hz) that were sensitive to ILD but not sensitive to ITD. Figure 9A–C shows directional response functions from three ILD-sensitive neurons, with CF increasing from left to right. For all 15 neurons tested, anechoic directional response functions increased monotonically with stimulus azimuth, indicating a preference for sources contralateral to the recording site. The panels below each set of directional response functions (Fig. 9D–F) show broadband noise-ILD curves for each neuron, obtained by decreasing the sound level in the ipsilateral ear by ILD/2 and increasing the level in the contralateral ear by ILD/2, approximately mimicking the changes that occur when a sound sources moves around the head. The shaded areas in Figure 9D–F delineate the range of ILD between +90° and −90° in the ITD+ILD stimuli, computed over a ⅓-octave band centered at the CF of a neuron. The shape of the directional response function essentially parallels the rate-ILD curve within this range; differences between the two curves may be caused by a different neural integration bandwidth than the postulated ⅓-octave or by nonlinear spectral integration (Escabi and Schreiner, 2002; Davis et al., 2003; Xie et al., 2007).
Figure 9.
Directional response functions for neurons sensitive only to ILD. A–C, Anechoic (solid) and reverberant (dashed) directional response functions obtained using the ITD+ILD stimuli in three IC neurons that were sensitive to ILD but not ITD. D–F, Firing rate versus ILD of broadband noise stimulus for the same three IC neurons as in A–C. The gray shading indicates the naturally occurring range of ILD in the anechoic ITD+ILD virtual space stimuli, computed in a ⅓-octave band centered at the CF of a neuron. G, Relative range for ITD+ILD stimuli versus CF for our sample of exclusively ILD-sensitive neurons (filled symbols) and ITD-sensitive neurons (open symbols).
Similar to our observations for ITD-sensitive neurons, reverberation typically compresses the range of firing rates in ILD-sensitive neurons (Fig. 9A–C, dashed lines). The compression of firing rates in the reverberant directional response functions is consistent with the reduced magnitude of ILDs in reverberation (Fig. 1B,E). Figure 9G shows the relative range versus CF for the ILD-sensitive neurons (filled symbols), along with the relative range from the ITD-sensitive neurons (obtained using ITD+ILD stimuli) reproduced from Figure 5B as open symbols. Directional sensitivity in reverberation does not differ between the two groups of high-CF neurons (t test, p = 0.84). Furthermore, there is no significant difference between the correlation coefficients for the two groups of high-CF neurons (p = 0.14) (data not shown), supporting the notion that, at high CFs, it is the ILDs that provides reliable directional information in reverberation.
Directional sensitivity depends on type of ITD tuning
ITD-sensitive neurons in the auditory brainstem and midbrain have been classified into peak, intermediate, and trough groups by assessing how their best interaural phase depends on the frequency of pure tone stimuli or sinusoidally amplitude modulated tones (Yin and Kuwada, 1983; Batra et al., 1993; Fitzpatrick et al., 2000). This classification provides important information about the neural mechanisms giving rise to ITD sensitivity. Trough-type tuning is generally, but not exclusively, associated with excitatory–inhibitory interactions in the LSO (Joris and Yin, 1995; Tollin and Yin, 2005), whereas peak-type tuning is associated with coincidence detection in the MSO (Yin and Chan, 1990; Batra et al., 1997a). The IC also contains many neurons exhibiting an intermediate form of ITD tuning that may result from convergence of inputs from the brainstem (Yin and Kuwada, 1983; Batra et al., 1993; McAlpine et al., 1998; Fitzpatrick et al., 2002; Agapiou and McAlpine, 2008), although this form of tuning is also occasionally observed in the brainstem (Batra et al., 1997a,b).
To gain insight into how the effects of reverberation depend on the neural mechanisms giving rise to ITD sensitivity, we developed a method for classifying ITD tuning curves into peak, intermediate, and trough tuning shape groups using broadband noise stimuli (see Materials and Methods). The rationale for this method is that, for most ITDfs-sensitive neurons, the ITD tuning curve for broadband noise closely resembles the linear superposition of tuning curves for pure tones of different frequencies (Yin et al., 1986) and generally exhibits a prominent, symmetric peak in peak-type neurons, a prominent, symmetric trough in trough-type neurons, and an asymmetric, biphasic shape in intermediate-type neurons. Figure 10 shows noise delay functions from each tuning shape group for neurons covering a wide range of CFs (top row, peak; middle row, intermediate; bottom row, trough). A breakdown of the neurons by tuning shape group is given in Table 1, with neurons further separated on the basis of CF into ITDfs (CF <1850 Hz) and ITDenv (CF >1850 Hz) subpopulations. Although peak-type ITD tuning is the largest group throughout the tonotopic axis, trough-type tuning is comparatively more common in high-CF, ITDenv-sensitive neurons than in low-CF, ITDfs-sensitive neurons (χ2 test of independence, p < 0.001), consistent with the contrasting biases in CF distributions in MSO and LSO (Guinan et al., 1972). These results with noise stimuli are consistent with those obtained by Fitzpatrick et al. (2002) using tonal stimuli (also in the IC of unanesthetized rabbit), in that peak-type tuning dominates for ITDfs-sensitive neurons, whereas the incidence of trough-type tuning increases among ITDenv-sensitive neurons.
Table 1.
ITD-sensitive neurons broken down by CF and unit type
| Peak | Intermediate | Trough | Total | |
|---|---|---|---|---|
| CF <1850 Hz | 70 (67%) | 19 (18%) | 16 (15%) | 105 |
| CF >1850 Hz | 40 (45%) | 16 (18%) | 33 (37%) | 89 |
| Total | 110 (57%) | 35 (18%) | 49 (25%) | 194 |
We reanalyzed our results obtained with the ITD-only and ITD+ILD virtual space stimuli to determine whether there are systematic differences in directional sensitivity and the effects of reverberation across ITD tuning shape groups. Figure 11A shows the absolute range of firing rates as a function of CF for anechoic ITD-only stimuli. The absolute range depends significantly on ITD tuning shape group (ANOVA, F(2,192) = 24.09, p < 0.001); it is largest in peak-type neurons (Fig. 11A, filled squares) and smallest in trough-type neurons (Fig. 11A, open squares), although there is substantial overlap between the three groups. The smaller absolute range in trough-type neurons is consistent with reports that these neurons tend to be more broadly tuned to ITD than peak-type neurons with tonal stimuli (Batra et al., 1993).
Figure 11.
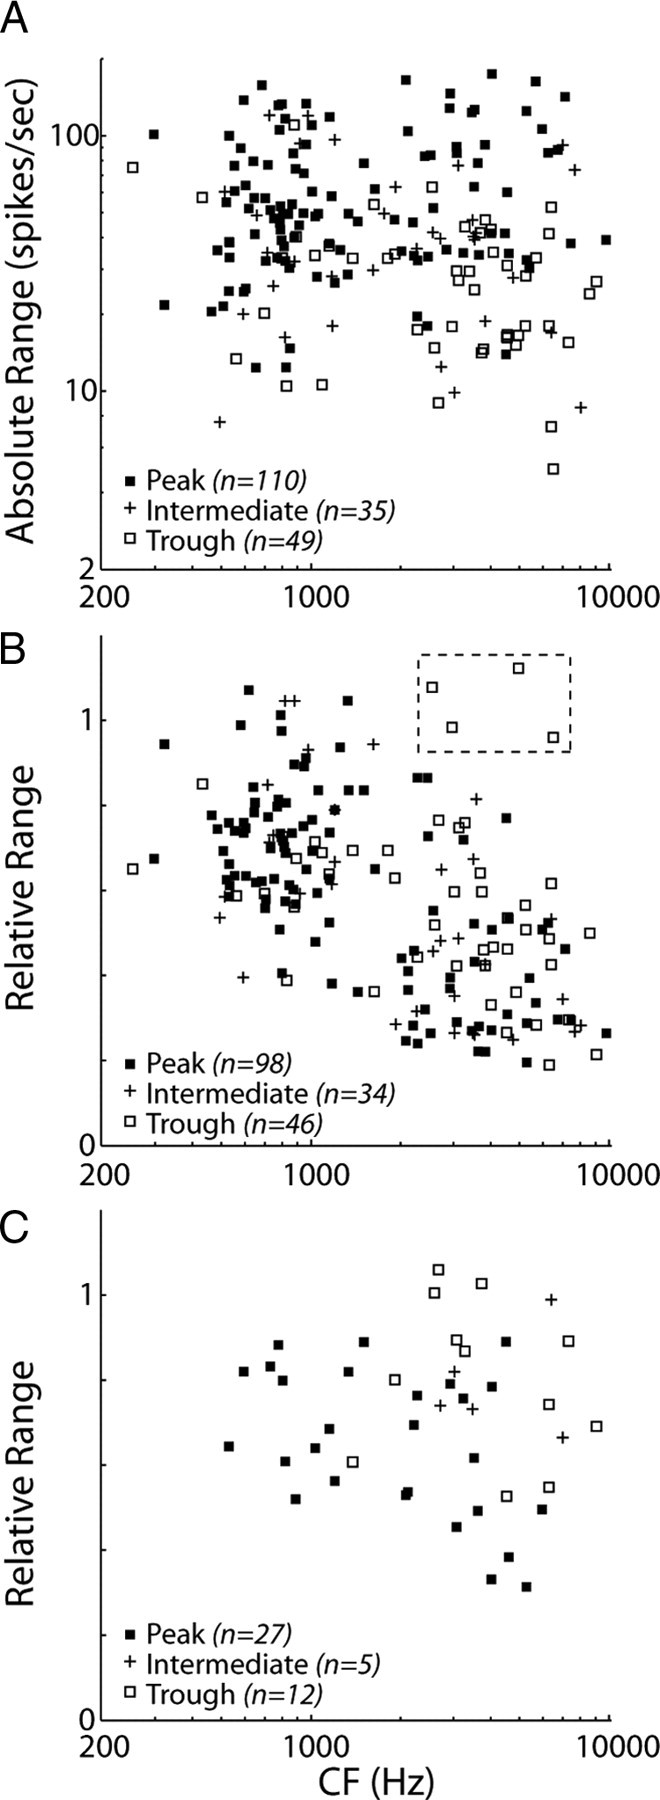
Directional sensitivity across ITD tuning shape groups. A, Absolute range of firing rates in anechoic condition for ITD-only stimuli plotted against CF across our sample of IC neurons. Symbols represent ITD tuning shape group. There is a significant dependence of absolute range on ITD tuning shape group (p < 0.001). B, Relative range of firing rates in reverberation for ITD-only stimuli versus CF. Dashed box indicates four units for which the relative range is an unreliable metric (for details, see Results). Relative range does not differ among ITD tuning shape groups (p = 0.87). C, Relative range of firing rates in reverberation for ITD+ILD stimuli versus CF. At high CFs (>1850 Hz), there is a significant dependence of relative range on ITD tuning shape group (p < 0.001).
In contrast, we did not observe systematic differences between tuning shape groups with respect to the effects of reverberation for ITD-only stimuli. Figure 11B shows the relative range of firing rates in reverberation, measured with ITD-only stimuli, as a function of CF. Both peak (Fig. 11B, filled squares) and intermediate (Fig. 11B, pluses) neurons conform to the population trend in that reverberation causes more compression of directional response functions at higher CFs than at lower CFs. A trend is harder to discern for trough-type neurons because their relative ranges show a great deal of variability at higher CFs (Fig. 11B, open squares). This variability is primarily attributable to four outlying data points showing relative ranges near unity (Fig. 11B, dashed square). Examination of directional response functions for these neurons reveals that the large relative ranges occur because the reverberant directional response function showed unsystematic fluctuations that were comparable in magnitude with the absolute range of firing rates in the anechoic condition, making the relative range an unreliable metric in these trough-type neurons (see example in supplemental Fig. 1, available at www.jneurosci.org as supplemental material). Nevertheless, a two-way ANOVA on the relative range (using the same CF bins as in Fig. 5) shows a main effect of CF (p < 0.001) but not ITD tuning shape (p = 0.87) with no significant interaction (p = 0.36), indicating that the effects of reverberation on directional sensitivity are similar across tuning shape groups when using ITD-only stimuli.
Conversely, for ITD+ILD stimuli, directional sensitivity in reverberation does depend on ITD tuning shape group, especially at higher CFs. Figure 11C shows the relative range as a function of CF for the 44 ITD-sensitive neurons tested with ITD+ILD stimuli. At high CFs (>1850 Hz), trough-type neurons (Fig. 11C, open squares) generally have larger relative ranges than peak-type neurons (Fig. 11C, filled squares). Because these data contain very few peak-type and intermediate neurons at low CFs, we only ran statistical analyses on the high CF data. At high CFs, an ANOVA shows a significant effect of ITD tuning shape group on relative range (p < 0.001). Post hoc multiple comparisons (with Bonferroni's corrections) indicate that relative ranges for peak-type neurons are significantly lower than those of both intermediate- and trough-type neurons (p < 0.005), with no significant difference between intermediate- and trough-type neurons (p = 0.86).
The different effects of ITD tuning shape group on relative range for ITD-only versus ITD+ILD stimuli can be understood by examining the anechoic and reverberant directional response functions from the three high-CF neurons in the bottom row of Figure 7, which belong to the intermediate-, peak-, and trough-type shape classes, respectively. In all three neurons, reverberation severely compresses the range of firing rates in the ITD-only condition. However, in the ITD+ILD condition, directional sensitivity in reverberation improves relative to the ITD-only condition for both the intermediate-type (Fig. 7D) and the trough-type (Fig. 7F) neuron, whereas directional sensitivity remains impoverished in the peak-type neuron (Fig. 7E). Thus, the strong influence of ILD in the trough-type and intermediate-type neurons (but not the peak-type neuron) is responsible for the relatively robust directional responses in reverberation in the ITD+ILD condition. The trends seen in the example neurons of Figure 7 hold across our entire sample (supplemental Fig. 2, available at www.jneurosci.org as supplemental material).
Together, these analyses suggest that the differential effects of reverberation among the ITD tuning shape groups can be explained by their sensitivity to individual binaural cues. Trough- and intermediate-type neurons show a strong influence of ILDs, which are relatively robust, whereas in peak-type neurons, directional sensitivity is primarily dependent on ITDenv cues that are less reliable than ILD in reverberation.
Discussion
In a reverberant environment, acoustic reflections interfere with the direct sound arriving at a listener's ears, distorting the binaural cues for sound localization. We have found that reverberation degrades directional sensitivity in ITD-sensitive IC neurons by compressing the range of firing rates across azimuths, although the amount of degradation depends on the CF and the types of binaural cues available. With virtual space stimuli containing only ITD cues, directional sensitivity in reverberation is significantly worse in high-CF, ITDenv-sensitive neurons than in their low-CF, ITDfs-sensitive counterparts. However, directional sensitivity at high CFs is significantly improved when the virtual space stimuli contain covarying ITD and ILD cues, suggesting that, at high CFs, ILDs provide a more reliable localization cue than envelope ITDs in reverberation.
Reverberation degrades envelope cues more than fine structure cues
Our results demonstrate that, when ITD is the only directional cue available, reverberation causes more severe degradation in directional sensitivity in high-CF neurons than in low-CF neurons, consistent with the frequency dependence of interaural correlation in the input stimulus waveforms (Fig. 1C, inset). However, the steepest degradation of directional sensitivity in reverberation occurs for CFs between 1 and 3 kHz, which coincides with the transition from ITDfs to ITDenv sensitivity (compare Figs. 5B, 2C,F), suggesting that the transition from fine structure to envelope ITD sensitivity, and not simply the decrease in waveform interaural correlation with CF, may be primarily responsible for the degradation. In ongoing experiments, we find a similar pattern of directional sensitivity in reverberation for directional responses extracted by coincidence analysis from auditory nerve spike trains recorded using identical ITD-only virtual space stimuli (Schwartz et al., 2009), suggesting that the differential effects of reverberation on ITDfs versus ITDenv sensitivity are at least partly established in the auditory periphery.
The present results show striking parallels with Sayles and Winter's (2008) finding that reverberation degrades the neural representation of temporal envelope pitch cues more severely than the representation of fine time structure cues in the cochlear nucleus of anesthetized guinea pig. This parallel suggests that the differential effects of reverberation on tuning to ITDfs and ITDenv may primarily reflect a differential degradation of envelope and fine time structure information in the sounds at either ear rather than a difference in processing of the two cues at the site of binaural convergence in the brainstem.
The envelope at the output of a cochlear filter depends on the interactions between the frequency components of the stimulus subsumed by the filter, whereas the fine structure depends primarily on the identity of these frequency components. Because reverberation acts as a linear filter, it only alters the magnitude and phase of the frequency components of a complex sound, without introducing new components. The effect of reverberation may be more pronounced for the envelope than for the fine structure because the complex pattern of changes in the magnitude and phase of individual components may be amplified by the nonlinear interactions between components giving rise to the envelope. The degradation in ITD representation will ultimately depend on how different the effects of the left and right BRIRs are on the output of the cochlear filters on the two sides of the head. The more dramatic changes in each monaural envelope will result in greater interaural decorrelation for the envelope than for the fine structure.
The present results, together with Sayles and Winter's (2008) findings, demonstrate the importance of fine structure information for auditory perception in everyday settings, emphasizing the need for such cues to be provided to the clinical population using electric hearing.
Influence of ILD on directional sensitivity
Directional sensitivity of high-CF ITD-sensitive neurons in reverberation—assessed by both changes in the overall range and the detailed shape of firing rates across azimuths—was significantly improved when virtual space stimuli contained ILD cues that covary with ITD (Fig. 5B,C, compare open and filled black symbols). Moreover, directional sensitivity in these neurons was similar to that observed in a sample of exclusively ILD-sensitive neurons, suggesting that, at high CFs, ILDs play an essential role in reverberant directional sensitivity. An important caveat in interpreting these results is whether our virtual space stimuli, which were computed using a spherical-head model, appropriately capture the natural covariations between ITD and ILD for a rabbit head. In particular, the spherical head model can underestimate the magnitude of ILDs measured in the ear canals of rabbits (Bishop et al., 2009). Given that the ILD influence index seems to parallel the frequency dependence of ILD for our virtual space stimuli (Fig. 8A, dashed line), we would expect ILD to be of even greater importance with more realistic head-related transfer functions, suggesting additional improvements in directional sensitivity in reverberant settings.
Mechanisms underlying directional sensitivity in reverberation
We observed clear differences in directional sensitivity and the effect of reverberation on these responses between IC neurons with different types of ITD tuning (Fig. 11) (supplemental Fig. 2, available at www.jneurosci.org as supplemental material). In the anechoic condition, directional information (as measured by the absolute range of firing rates across azimuths) was lower in trough-type neurons than in peak-type neurons for the ITD-only stimuli. High-CF trough-type neurons also showed the greatest influence of ILD when directional responses to ITD+ILD and ITD-only stimuli were compared in both anechoic and reverberant conditions. These findings are consistent with the view that trough-type responses result primarily from an excitatory–inhibitory interaction in the LSO. The troughs of ITD-sensitive LSO neurons tend to be broad and encompass the entire naturally occurring range of ITD (Joris and Yin, 1995; Batra et al., 1997a; Tollin and Yin, 2005), so that these neurons tend to have low firing rates for ITD-only stimuli. Introducing an ILD favoring the ipsilateral ear is expected to increase the firing rates and improve the directional responses of trough-type LSO neurons and their targets in the contralateral IC. The improvement in directional sensitivity attributable to ILD is particularly significant in reverberation, in which the envelope ITD cues are severely degraded.
Neurons with intermediate-type ITD tuning were, in every respect, intermediate between peak- and trough-type neurons in their directional response properties, behaving sometimes like peak-type neurons (in that they had good directional information for ITD-only anechoic stimuli) and sometimes like trough-type neurons (in that they showed a strong influence of ILD). Robust directional sensitivity in reverberation for intermediate-type neurons might arise through convergence of ITD- and ILD-sensitive inputs within the IC or, more generally, through dual excitatory–excitatory/excitatory–inhibitory interactions (Batra et al., 1993). Such interactions are thought to give rise to the intermediate form of ITD sensitivity (Shackleton et al., 2000; Fitzpatrick et al., 2002; Agapiou and McAlpine, 2008). In general, whereas directional sensitivity of high-CF neurons can be as good as that of low-CF neurons in the anechoic condition, even in the absence of ILD cues, the severe degradation in ITDenv sensitivity in reverberation suggests that it would be advantageous for high-CF ITDenv-sensitive neurons to be tuned to ILD as well as ITD, as is the case for intermediate- and trough-type neurons.
Comparison with human psychophysics
There are close parallels between the present neurophysiological results and those of human psychophysical studies of spatial hearing in reverberant environments. Rakerd et al. (2006) found that ITD discrimination thresholds for ⅓-octave noise bands degrade more rapidly with increasing reverberation at high frequencies (2850 Hz) than at low frequencies (715 Hz), consistent with our observation that reverberation causes more severe compression of directional response function in high-CF, ITDenv-sensitive IC neurons than in low-CF ITDfs-sensitive neurons. Rakerd et al. further found that, for reverberant noise bands, ITD discrimination degraded when they introduced a small ILD in opposition to the ITD, suggesting that ILD has an important influence on localization in reverberation. The substantial influence of ILD on directional responses in reverberation observed in our high-CF IC neuron population suggests that the neural substrate for this phenomenon may be at, or below, the level of the auditory midbrain. Nevertheless, single-unit experiments using stimuli with opposing ITD and ILD are needed to better understand the relationships between our results and those of Rakerd et al.
Kiggins et al. (2005) found that sound localization accuracy in a reverberant room was similar for low-pass (0.5–1.0 kHz) and high-pass (4–8 kHz) pink noise. Likewise, we find comparable directional sensitivity across the tonotopic axis using the ITD+ILD stimuli (Fig. 8B). The parallel between the two studies suggests that our observation that ILD sensitivity at high CFs is comparable with ITDfs sensitivity at low CFs is not just an artifact of the particular simulated reverberant room or the virtual space simulation techniques used. Unlike our study, which used simulated reverberation and a simplified spherical head model, Kiggins et al. used head-related transfer functions obtained using an acoustic mannequin in a real room.
The duplex theory of sound localization (Rayleigh, 1907) stipulates that listeners use ITD at low frequencies and ILD at high frequencies. The present results, which represent one of the few investigations of neural ITD sensitivity across a wide range of CFs using a common set of stimuli, suggest that, in the anechoic condition, ITDenv sensitivity at high CFs can rival that based on fine time structure at low CFs, consistent with some psychophysical experiments (Bernstein and Trahiotis, 2002). However, the low perceptual weight given to high-frequency ITDenv cues in sound localization by most human listeners (Macpherson and Middlebrooks, 2002) may result from the fact that ITDenv cues are less reliable than ILD cues in everyday reverberant listening conditions.
Footnotes
This work was supported by National Institutes of Health Grants R01 DC002258 and P30 DC005209 (B.D.) and the Helen Carr Peake fund (S.D.). We thank Laurel Carney and Shigeyuki Kuwada for help with the awake rabbit preparation, Ken Hancock for software support, and Melissa Wood for technical assistance. We also thank Shigeyuki Kuwada, Christopher Moore, and Barbara Shinn-Cunningham for reading a previous version of the manuscript.
References
- Agapiou JP, McAlpine D. Low-frequency envelope sensitivity produces asymmetric binaural tuning curves. J Neurophysiol. 2008;100:2381–2396. doi: 10.1152/jn.90393.2008. [DOI] [PMC free article] [PubMed] [Google Scholar]
- Allen JB, Berkley DA. Image method for efficiently simulating small-room acoustics. J Acoust Soc Am. 1979;65:943–950. [Google Scholar]
- Batra R, Kuwada S, Stanford TR. High-frequency neurons in the inferior colliculus that are sensitive to interaural delays of amplitude-modulated tones: evidence for dual binaural influences. J Neurophysiol. 1993;70:64–80. doi: 10.1152/jn.1993.70.1.64. [DOI] [PubMed] [Google Scholar]
- Batra R, Kuwada S, Fitzpatrick DC. Sensitivity to interaural temporal disparities of low- and high-frequency neurons in the superior olivary complex. I. Heterogeneity of responses. J Neurophysiol. 1997a;78:1222–1236. doi: 10.1152/jn.1997.78.3.1222. [DOI] [PubMed] [Google Scholar]
- Batra R, Kuwada S, Fitzpatrick DC. Sensitivity to interaural temporal disparities of low- and high-frequency neurons in the superior olivary complex. II. Coincidence detection. J Neurophysiol. 1997b;78:1237–1247. doi: 10.1152/jn.1997.78.3.1237. [DOI] [PubMed] [Google Scholar]
- Bernstein LR, Trahiotis C. Enhancing sensitivity to interaural delays at high frequencies by using “transposed stimuli”. J Acoust Soc Am. 2002;112:1026–1036. doi: 10.1121/1.1497620. [DOI] [PubMed] [Google Scholar]
- Bishop B, Kim DO, Sterbing-D'Angelo S, Kuwada S. Acoustic cues for sound localization measured in a rabbit and a tennis ball and computed using a rigid spherical model. Abstr Assoc Res Otolaryngol. 2009;2009:527. [Google Scholar]
- Boudreau JC, Tsuchitani C. Binaural interaction in the cat superior olive S segment. J Neurophysiol. 1968;31:442–454. doi: 10.1152/jn.1968.31.3.442. [DOI] [PubMed] [Google Scholar]
- Caird D, Klinke R. Processing of binaural stimuli by cat superior olivary complex neurons. Exp Brain Res. 1983;52:385–399. doi: 10.1007/BF00238032. [DOI] [PubMed] [Google Scholar]
- Chase SM, Young ED. Limited segregation of different types of sound localization information among classes of units in the inferior colliculus. J Neurosci. 2005;25:7575–7585. doi: 10.1523/JNEUROSCI.0915-05.2005. [DOI] [PMC free article] [PubMed] [Google Scholar]
- Cover TM, Thomas JA. Elements of information theory. New York: Wiley; 1991. [Google Scholar]
- Culling JF, Colburn HS, Spurchise M. Interaural correlation sensitivity. J Acoust Soc Am. 2001;110:1020–1029. doi: 10.1121/1.1383296. [DOI] [PubMed] [Google Scholar]
- Davis KA, Ramachandran R, May BJ. Auditory processing of spectral cues for sound localization in the inferior colliculus. J Assoc Res Otolaryngol. 2003;4:148–163. doi: 10.1007/s10162-002-2002-5. [DOI] [PMC free article] [PubMed] [Google Scholar]
- Delgutte B, Joris PX, Litovsky RY, Yin TC. Relative importance of different acoustic cues to the directional sensitivity of inferior colliculus neurons. In: Manley GA, Klump GM, Koeppl C, Fastl H, Oeckinghaus H, editors. Advances in hearing research. Singapore: World Scientific Publishing; 1995. pp. 288–299. [Google Scholar]
- Devore S, Ihlefeld A, Hancock K, Shinn-Cunningham B, Delgutte B. Accurate sound localization in reverberant environments is mediated by robust encoding of spatial cues in the auditory midbrain. Neuron. 2009;62:123–134. doi: 10.1016/j.neuron.2009.02.018. [DOI] [PMC free article] [PubMed] [Google Scholar]
- Escabi MA, Schreiner CE. Nonlinear spectrotemporal sound analysis by neurons in the auditory midbrain. J Neurosci. 2002;22:4114–4131. doi: 10.1523/JNEUROSCI.22-10-04114.2002. [DOI] [PMC free article] [PubMed] [Google Scholar]
- Fitzpatrick DC, Kuwada S, Batra R. Neural sensitivity to interaural time differences: beyond the Jeffress model. J Neurosci. 2000;20:1605–1615. doi: 10.1523/JNEUROSCI.20-04-01605.2000. [DOI] [PMC free article] [PubMed] [Google Scholar]
- Fitzpatrick DC, Kuwada S, Batra R. Transformations in processing interaural time differences between the superior olivary complex and inferior colliculus: beyond the Jeffress model. Hear Res. 2002;168:79–89. doi: 10.1016/s0378-5955(02)00359-3. [DOI] [PubMed] [Google Scholar]
- Goldberg JM, Brown PB. Response of binaural neurons of dog superior olivary complex to dichotic tonal stimuli: some physiological mechanisms of sound localization. J Neurophysiol. 1969;32:613–636. doi: 10.1152/jn.1969.32.4.613. [DOI] [PubMed] [Google Scholar]
- Griffin SJ, Bernstein LR, Ingham NJ, McAlpine D. Neural sensitivity to interaural envelope delays in the inferior colliculus of the guinea pig. J Neurophysiol. 2005;93:3463–3478. doi: 10.1152/jn.00794.2004. [DOI] [PubMed] [Google Scholar]
- Guinan JJ, Jr, Norris BE, Guinan SS. Single auditory units in the superior olivary complex. II. Locations of unit categories and tonotopic organization. Int J Neurosci. 1972;4:147–166. [Google Scholar]
- Jeffress LA. A place theory of sound localization. J Comp Physiol Psychol. 1948;41:35–39. doi: 10.1037/h0061495. [DOI] [PubMed] [Google Scholar]
- Joris PX. Interaural time sensitivity dominated by cochlea-induced envelope patterns. J Neurosci. 2003;23:6345–6350. doi: 10.1523/JNEUROSCI.23-15-06345.2003. [DOI] [PMC free article] [PubMed] [Google Scholar]
- Joris PX, Yin TC. Envelope coding in the lateral superior olive. I. Sensitivity to interaural time differences. J Neurophysiol. 1995;73:1043–1062. doi: 10.1152/jn.1995.73.3.1043. [DOI] [PubMed] [Google Scholar]
- Kiang NY, Moxon EC. Tails of tuning curves of auditory-nerve fibers. J Acoust Soc Am. 1974;55:620–630. doi: 10.1121/1.1914572. [DOI] [PubMed] [Google Scholar]
- Kiggins J, Ihlefeld A, Shinn-Cunningham BG. How does reverberation affect the accuracy of sound localization?. Paper presented at the Annual Fall Meeting of the Biomedical Engineering Society; September; Baltimore, MD. 2005. [Google Scholar]
- Kuhn GF. Model for the interaural time differences in the azimuthal plane. J Acoust Soc Am. 1977;62:157–167. [Google Scholar]
- Kuwada S, Stanford TR, Batra R. Interaural phase sensitive units in the inferior colliculus of the unanesthetized rabbit. Effects of changing frequency. J Neurophysiol. 1987;57:1338–1360. doi: 10.1152/jn.1987.57.5.1338. [DOI] [PubMed] [Google Scholar]
- Macpherson EA, Middlebrooks JC. Listener weighting of cues for lateral angle: the duplex theory of sound localization revisited. J Acoust Soc Am. 2002;111:2219–2236. doi: 10.1121/1.1471898. [DOI] [PubMed] [Google Scholar]
- McAlpine D, Jiang D, Shackleton TM, Palmer AR. Convergent input from brainstem coincidence detectors onto delay-sensitive neurons in the inferior colliculus. J Neurosci. 1998;18:6026–6039. doi: 10.1523/JNEUROSCI.18-15-06026.1998. [DOI] [PMC free article] [PubMed] [Google Scholar]
- Nelson PC, Carney LH. Neural rate and timing cues for detection and discrimination of amplitude-modulated tones in the awake rabbit inferior colliculus. J Neurophysiol. 2007;97:522–539. doi: 10.1152/jn.00776.2006.. [DOI] [PMC free article] [PubMed] [Google Scholar]
- Nelson PC, Smith ZM, Young ED. Wide-dynamic-range forward suppression in marmoset inferior colliculus neurons is generated centrally and accounts for perceptual masking. J Neurosci. 2009;29:2553–2562. doi: 10.1523/JNEUROSCI.5359-08.2009. [DOI] [PMC free article] [PubMed] [Google Scholar]
- Rakerd B, Hartmann WM. Localization of sound in rooms. II. The effects of a single reflecting surface. J Acoust Soc Am. 1985;78:524–533. doi: 10.1121/1.392474. [DOI] [PubMed] [Google Scholar]
- Rakerd B, Hartmann WM, Pepin E. Localizing noise in rooms via stead state interaural time differences. J Acoust Soc Am. 2006;120:3082–3083. [Google Scholar]
- Rayleigh L. On our perception of sound direction. Philos Mag. 1907;13:214–232. [Google Scholar]
- Sayles M, Winter IM. Reverberation challenges the temporal representation of the pitch of complex sounds. Neuron. 2008;58:789–801. doi: 10.1016/j.neuron.2008.03.029. [DOI] [PubMed] [Google Scholar]
- Schwartz A, Devore S, Delgutte B. Effects of reverberation on directional sensitivity of auditory neurons: peripheral factors. Abstr Assoc Res Otolaryngol. 2009;32:622. [Google Scholar]
- Shackleton TM, McAlpine D, Palmer AR. Modelling convergent input onto interaural-delay-sensitive inferior colliculus neurones. Hear Res. 2000;149:199–215. doi: 10.1016/s0378-5955(00)00187-8. [DOI] [PubMed] [Google Scholar]
- Shinn-Cunningham BG, Desloge JG, Kopco N. Empirical and modeled acoustic transfer functions in a simple room: effects of distance and direction. Presented at the IEEE Workshop on Applications of Signal Processing to Audio and Acoustics; October; New Pfaltz, NY. 2001. [Google Scholar]
- Tollin DJ, Yin TC. Interaural phase and level difference sensitivity in low-frequency neurons in the lateral superior olive. J Neurosci. 2005;25:10648–10657. doi: 10.1523/JNEUROSCI.1609-05.2005. [DOI] [PMC free article] [PubMed] [Google Scholar]
- Wightman FL, Kistler DJ. The dominant role of low-frequency interaural time differences in sound localization. J Acoust Soc Am. 1992;91:1648–1661. doi: 10.1121/1.402445. [DOI] [PubMed] [Google Scholar]
- Xie R, Gittelman JX, Pollak GD. Rethinking tuning: in vivo whole-cell recordings of the inferior colliculus in awake bats. J Neurosci. 2007;27:9469–9481. doi: 10.1523/JNEUROSCI.2865-07.2007. [DOI] [PMC free article] [PubMed] [Google Scholar]
- Yin TC, Chan JC. Interaural time sensitivity in medial superior olive of cat. J Neurophysiol. 1990;64:465–488. doi: 10.1152/jn.1990.64.2.465. [DOI] [PubMed] [Google Scholar]
- Yin TC, Kuwada S. Binaural interaction in low-frequency neurons in inferior colliculus of the cat. III. Effects of changing frequency. J Neurophysiol. 1983;50:1020–1042. doi: 10.1152/jn.1983.50.4.1020. [DOI] [PubMed] [Google Scholar]
- Yin TC, Kuwada S, Sujaku Y. Interaural time sensitivity of high-frequency neurons in the inferior colliculus. J Acoust Soc Am. 1984;76:1401–1410. doi: 10.1121/1.391457. [DOI] [PubMed] [Google Scholar]
- Yin TC, Chan JC, Irvine DR. Effects of interaural time delays of noise stimuli on low-frequency cells in the cat's inferior colliculus. I. Responses to wideband noise. J Neurophysiol. 1986;55:280–300. doi: 10.1152/jn.1986.55.2.280. [DOI] [PubMed] [Google Scholar]


