

Abstract
Brain neural activity depends critically on the blood supply to a given structure. The blood supply can differ within and between divisions, which may have functional significance. We analyzed the microvascular organization of the cat inferior colliculus (IC) to determine if the capillary distribution is homogenous throughout. The IC consists of the central nucleus (CN), the dorsal cortex (DC), and the lateral cortex (LC), each with different roles in auditory behavior and perception. Plastic-embedded tissue was studied from adult cats in 1 μm-thick semithin sections stained with toluidine blue; tissue was sampled from the IC in a caudal-rostral series of sections. The architectonic subdivisions were drawn independently based on Golgi impregnations.
We used the nearest neighbor distance (NND) method to quantify capillary density between subdivisions. Overall, the distribution of capillary density was non-homogenous across the IC. We found significant capillary NND differences between the CN and LC (Mann-Whitney test; p • 0.05), CN and DC (Mann-Whitney test; p • 0.05), and LC and DC (Mann-Whitney test; p • 0.05). The CN had the lowest NND values among all three divisions, indicating the highest capillary density. NND values changed gradually as analysis moved from the center of the IC towards the periphery.
The significantly higher microvascular density in the CN may imply that the lemniscal auditory pathway has higher levels of blood flow and metabolic activity than non-lemniscal areas of the IC. The non-homogenous microvascular organization of the IC supports parcellation schemes that delineate three major subdivisions and confirms that the borders between the three regions are not sharp.
Introduction
The inferior colliculus (IC) is a key structure in the central auditory system. The IC is the principal site of convergence for ascending auditory information (Aitkin et al., 1984b), and receives substantial corticofugal input from the auditory cortex and other sensory areas (Aitkin et al., 1981; Aitkin et al., 1978; Winer et al., 1998). Thus, the IC acts as a center of integration between ascending information from brainstem nuclei and descending information from the forebrain (Winer et al., 1998).
The cat IC is divided into three principal subdivisions: the central nucleus (CN), the lateral cortex (LC), and the dorsal cortex (DC) (Ramón y Cajal, 1909; Berman, 1968; Morest and Oliver, 1984; Oliver, 2005). The CN is part of the lemniscal auditory pathway (Winer et al., 2005), tonotopically organized (Rose et al., 1962; Merzenich et al., 1974; Servière et al., 1984; Schreiner et al., 1997; Malmierca et al., 2008), and essential for hearing (Jenkins et al., 1982). The LC receives auditory input from the cochlear nucleus and the superior olive (Shneiderman and Henkel, 1987; Schofield and Cant, 1992; Schofield and Cant, 1996; Oliver et al., 1997; Oliver et al., 1999; Cant and Benson, 2003; Cant and Benson, 2006; Cant and Benson, 2008), and somatosensory input from the dorsal column and trigeminal spinal nuclei (Aitkin et al., 1978; Aitkin et al., 1981; Zhou et al., 2006). LC neurons are responsive to both acoustic and somatosensory stimulation and have been implicated in multisensory integration (Jain and Shore, 2006). Unlike the CN and LC, the DC receives little or no brainstem input (Irvine, 1986). However, the DC receives heavy descending corticofugal input (Diamond et al., 1969; Coleman and Clerici, 1987; Herbert et al., 1991; Winer et al., 1998). DC cells have heterogenous response properties, and the role of the DC in hearing is unclear (Aitkin et al., 1975; Aitkin et al., 1994).
The subdivisions of the IC were initially defined neuroanatomically with Golgi-impregnations (Morest and Oliver, 1984; Faye Lund and Osen, 1985) and Nissl-stains (Berman, 1968). However, variations in defining borders that stem from different histological methods have led to different depictions of subdivision boundaries (Paloff et al., 1998; Coote and Rees, 2008). Elucidating the boundaries of IC subdivisions has been a topic of current research (Cant and Benson, 2006; Loftus et al., 2008; Coote and Rees, 2008). Cytochrome oxidase (CO), a metabolic marker, has been recently used to define IC subdivisions in the gerbil (Cant and Benson, 2006), cat (Loftus et al., 2008), and rat (Chernock et al., 2004; Loftus et al., 2008). There is high CO activity in the central area compared to the periphery in the IC (Gonzalez-Lima and Jones, 1994; Cant and Benson, 2005; Cant and Benson 2006), but CO activity in the IC is graded and does not show the presence of distinct internal borders (Cant and Benson, 2006). Studies show that CO activity and vascular density are closely but not entirely correlated with each other (Borowsky and Collins, 1989; Fonta and Imbert, 2002; Riddle et al., 1993; Tuor et al., 1994; Weber et al, 2008). Thus, differences in microvascular architecture between IC subdivisions may lend themselves to showing more distinct profiles of IC subdivisions.
Early studies demonstrated that the microvasculature of cortical and subcortical structures in the central nervous system is not homogenous (Craigie, 1920; Craigie, 1921; Dunning and Wolff, 1937). More recent studies have shown that the microvascular architecture reveals stripes and blobs in the primate visual cortex (Zheng et al., 1991), barrels in the rat somatosensory cortex (Cox et al., 1993; Riddle et al., 1993; Woolsey et al., 1996), laminar differences in the cortex (Zheng et al., 1991; Harrison et al., 2002; Grivas et al., 2003; Masamoto, 2003; Tieman et al., 2004; Michaloudi et al., 2005; Weber et al., 2008), and borders of primary and non-primary cortical regions (Zheng et al., 1991; Tieman et al., 2004). Taken together, these findings support the idea that microvascular density profiles may be applied to reveal functionally separate divisions in subcortical structures like the IC. Previous studies showed regional differences in the microvascular architecture in the rat IC (Gross et al., 1986; Gross et al., 1987; Andrew and Paterson, 1989), but these differences were not compared between subdivisions defined by other histological methods. Here, we first examined whether microvascular density in the cat IC differed between subdivisions. Then we investigated whether capillary distribution changed sharply near subdivision boundaries as defined by Golgi impregnations that would indicate the presence of a border.
Material and Methods
2.1. Perfusion and plastic-embedding
All procedures were carried out in accordance with accepted and approved animal care and use guidelines set by the University of California at Berkeley office of laboratory animal care and The National Institutes of Health. Two female cats were anesthetized with sodium pentobarbital (26 mg/kg intravenously), areflexic, and perfused intracranially with fixative containing 4% paraformaldehyde and 0.25% glutaraldehyde, followed by a wash of phosphate buffered saline (PBS). The brain was cut with a Vibratome (TPI, Inc., St. Louis, MO) in the transverse plane into 200 μm-thick slabs containing the right IC and collected in 0.12 M phosphate buffer (PB), pH 7.4. The slabs were osmicated with 1% OsO4 in PB for 50 minutes, dehydrated in a series of ethanol washes followed by propylene oxide (Larue and Winer, 1996), and infiltrated overnight in an airtight chamber in 1:1 propylene oxide and epoxy (Araldite, 6005). The next day, the slabs were transferred to a fresh 100% epoxy mixture for 3 hours and mounted on pre-cast epoxy slides. The slide sandwiches were polymerized at 60°C for 16 hours and cooled. The slabs were removed and each slab was mounted on a plastic dowel. One μm-thick semithin sections were cut on an ultramicrotome with 8 mm-wide glass knives. The sections were stained with 1% toluidine blue solution in PB and coverslipped.
2.2. Data collection for IC microvasculature
Four IC sections spanning the caudal—rostral extent were analyzed in each case. Subdivisions were drawn based on the Golgi parcellation scheme (Morest and Oliver, 1984; Loftus et al., 2008), and the most rostral section of each case was excluded from further analysis because the three subdivisions were not present at this level along the neuraxis. A computer-driven microscope analysis system (Neurolucida; MBF Bioscience, Williston, VT, USA) was used to plot all cross-sectioned blood vessels circular in appearance with a diameter of ≤ 8 μm at 400× final magnification (Fig. 1). Cross-sectioned blood vessels elliptical in appearance were plotted if their minor-axis diameter was ≤ 8 μm. These criteria are consistent with past studies (Bär et al., 1972; Mato et al., 1979; Conradi et al., 1980; Michaloudi et al., 2005). Hereafter, cross-sectioned capillary profiles meeting the above criteria are called “capillaries.”
Fig. 1.
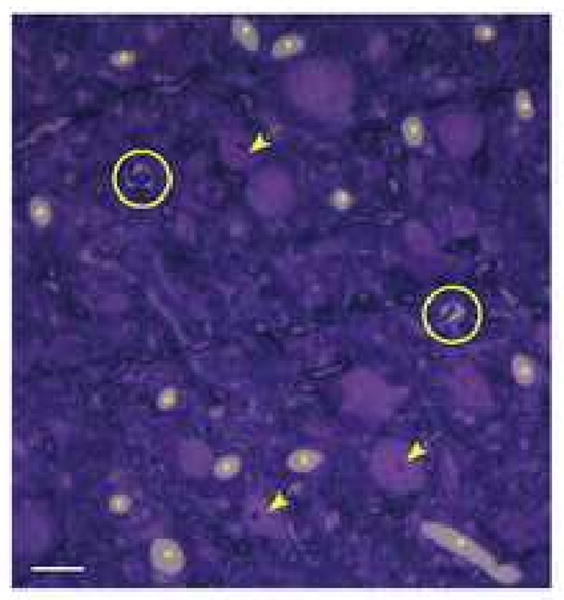
Photomicrograph of a 1 μm-thick semithin section through the IC stained with Toluidine-blue at 400× magnification. Capillary profiles are marked with an asterisk and those with red blood cells fixed inside the lumen are circled. Several cell bodies are indicated by arrows. Scale bar represents 10 μm.
2.3. Data and statistical analysis for IC microvasculature
Each IC section were divided into square bins (200×200 μm). Capillaries within each bin were counted with Canvas × (ACD systems, Victoria BC, Canada) to produce an array of numbers representing counts in each bin. The array was formatted into a matrix, and Matlab (Mathworks, Natick, MA) was used to generate a pseudocolor plot of IC capillaries.
We used the nearest neighbor distance (NND) method for all statistical analyses. NND is defined as the distance from one capillary to its nearest neighbor. With the capillary plots of each section, we calculated the distance between each capillary and its nearest neighbor using R (R Development Core Team 2008, Vienna, Austria). Capillary density was inferred from NNDs; that is, areas with lower NND values signified higher capillary density. We determined statistical differences of NND values between subdivisions using the Mann-Whitney test (Table 1) with significance set at the p ≤ 0.05 level. A non-parametric test was employed because the population of capillary NND values did not fit a normal distribution.
Table 1.
(A) Mean, median, and range of CN, LC, and DC NNDs in μm for case 1575 and case 1231. The numbers on the left column refer to specific sections. The most rostral section in each case was excluded because the three subdivisions were not present at that level. (B) Results for non-parametric Mann-Whitney Test comparing differences in NNDs between subdivisions for case 1575 and 1231. Significant differences (shaded gray) was set at the p ≤ 0.05 level.
| A | Case 1575 | Mean ± SO | Median | Range | |
|---|---|---|---|---|---|
| 0.25 | CN | 31.3 ± 10.7 | 30.8 | Min: 6.1, Max: 134.3 | |
| LC | 36.8 ± 14.1 | 35. 7 | Min: 6.9, Max: 94.9 | ||
| DC | 35.5 ± 12.2 | 34.5 | Min: 5.1, Max: 124.4 | ||
| 0.50 | CN | 30.0 ± 9.4 | 29.4 | Min: 5.4, Max: 83.6 | |
| LC | 36.2 ± 14.2 | 34.5 | Min: 6.3, Max: 93.3 | ||
| DC | 36.9 ± 13.9 | 35.4 | Mln: 6.5, Max: 124.1 | ||
| 0.65 | CN | 30.1 ± 9.5 | 29.6 | Min: 8.9, Max: 96.5 | |
| LC | 38.8 ± 14.0 | 37.3 | Min: 10.9, Max: 98.5 | ||
| DC | 37.5 ± 14.9 | 35.8 | Min: 4.3, Max: 155.9 | ||
| Case 1231 | Mean ± SD | Median | Range | ||
| 0.27 | CN | 28.5 ± 8.7 | 28.1 | Min: 7.2, Max: 83.4 | |
| LC | 36.1 ± 13.6 | 34.7 | Min: 6.6, Max: 81.9 | ||
| DC | 34.9 ± 13.5 | 33.1 | Min: 5.6, Max: 129.7 | ||
| 0.40 | CN | 28.7 ± 8.7 | 28.4 | Min 7.2, Max: 109.5 | |
| LC | 37.9 ± 14.5 | 36.5 | Min: 10.8, Max: 135.3 | ||
| DC | 34.3 ± 12.5 | 32.7 | Min: 7.9, Max: 116.4 | ||
| 0.63 | CN | 26.6 ± 7.9 | 26.1 | Min: 6.3, Max: 68.4 | |
| LC | 29.1 ± 11.8 | 27.5 | Min: 7.1, Max: 136.6 | ||
| DC | 31.9 ± 11.2 | 30.7 | Min: 2.7, Max: 102.3 | ||
| B | Case 1575 | 0.25 | 0.50 | 0.65 | |
| CN/LC | Significant (p = 3.7× 10⁻⁸) |
Significant (p < 2.2 × 10⁻¹⁶ |
Significant (p < 2.2 × 10⁻¹⁶ |
||
| CN/DC | Significant (p < 2.2 × 10⁻¹⁶) |
Significant (p < 2.2 × 10⁻¹⁶) |
Significant (p < 2.2 × 10⁻¹⁶) |
||
| LC/DC | Significant (p = 0.050) |
Not Significant (p = 0.064) |
Significant (p = 0.00060) |
||
| Case 1231 | 0.27 | 0.40 | 0.63 | ||
| CN/LC | Significant (p < 2.2 × 10⁻¹⁶) |
Significant (p < 2.2 × 10⁻¹⁶) |
Significant (p = 9.69 × 10⁻¹¹) |
||
| CN/DC | Significant (p < 2.2 × 10⁻¹⁶) |
Significant (p < 2.2 × 10⁻¹⁶) |
Significant (p < 2.2 × 10⁻¹⁶) |
||
| LC/DC | Significant (p = 0.0091) |
Significant (p =4.19 × 10⁻¹²) |
Significant (p < 2.2 × 10⁻¹⁶) |
||
To determine whether capillary distribution can be used to locate borders, we determined the NNDs of all capillaries falling within a ROI that intersected a Golgi-based border perpendicularly (Fig 4). A scatter plot of NND values was produced, and a locally estimated scatter plot smoothing (LOESS) line was generated. A LOESS line represents the weighted averages of NNDs along the distance of the ROI axis.
Fig. 4.
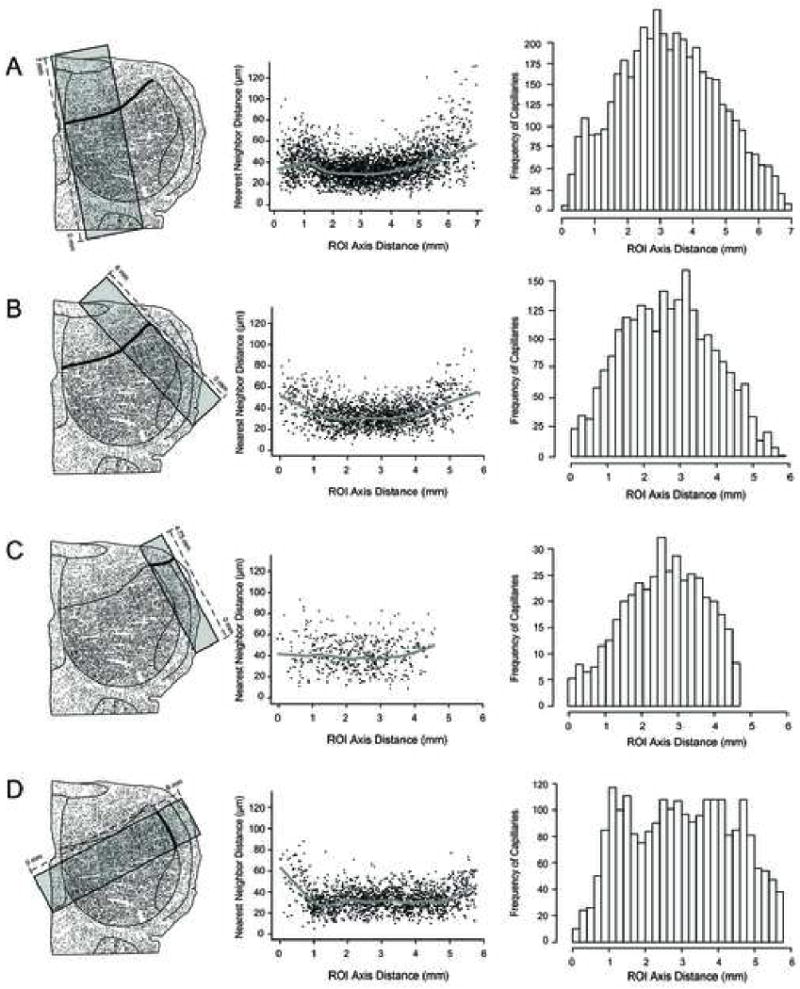
Determination of IC borders using the 0.50 level-section in case 1575. (A) Capillaries in the rectangular ROI were analyzed. The CN to DC border is indicated by a bold line. The NNDs of capillaries within the ROI were calculated and a scatter plot with a LOESS line is shown. The y-axis refers to the NNDs in micrometers of all the capillaries within the ROI and the x-axis refers to the distance in millimeters along the ROI axis. The histogram shows the frequency of capillaries within the ROI in the y-axis and the distance in millimeters along the ROI axis in the x-axis. (B) Capillaries in the rectangular ROI were analyzed. The CN to DC border is bolded. Convention is the same as in (A). (C) Capillaries in the rectangular ROI were analyzed. The LC to DC border is bolded. Convention is the same as in (A). (D) Capillaries in the rectangular ROI were analyzed. The CN to LC border is bolded. Convention is the same as in (A).
3. Results
3.1. Low-power views of vascular architecture
The primary trunks of large vessels enter the IC along its dorsolateral surface (Fig. 2A). Large vessels and brain tissue appear white on the capillary plots (Fig. 2B).
Fig. 2.
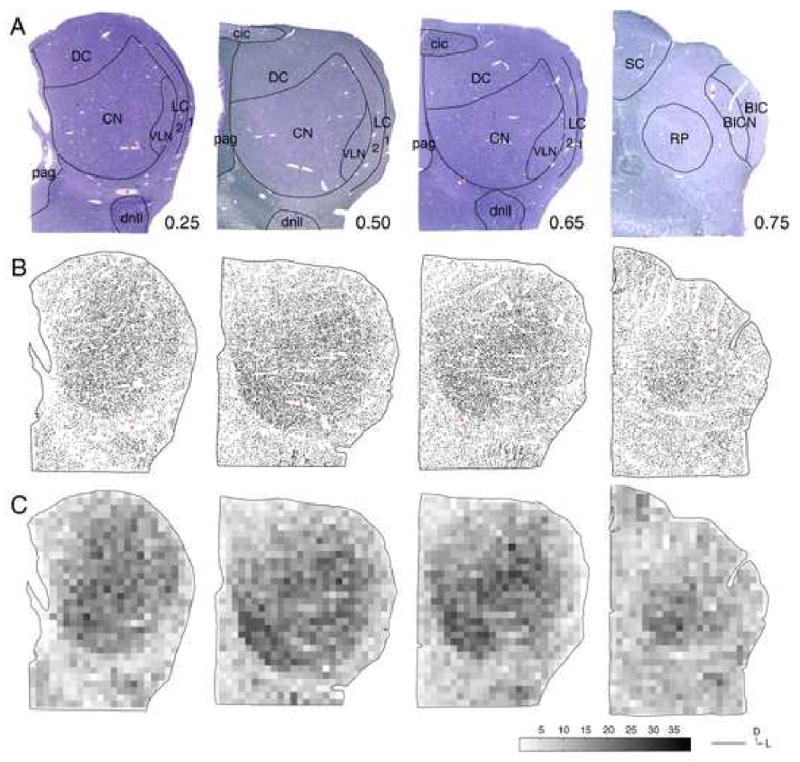
(A) Photomicrographs of case 1575. Four 1 μm-thick IC sections stained with toluidine-blue are shown from caudal to rostral. The number next to each section refers to the percent distance rostral from the caudal tip of the IC. Several primary trunks of large vessels entering the IC are marked with an asterisk. (B) Neurolucida plots of all capillary profiles of sections in (A). Several large blood vessels are marked with an asterisk. (C) Pseudocolor plots of all capillary profiles in (A). Each bin represents the number of capillaries in a 200×200 μm2 area. Scale bar represents 1 mm.
The central region in the IC is markedly denser in capillaries compared to the periphery and this nonhomogeneity is present in each of the four IC sections that were analyzed (Fig. 2B). The pseudocolor plots show bins with darker shades ventrally and lighter shades dorsally that transition in a gradual manner (Fig. 2C). More rostrally along the IC caudorostral axis, the rostral pole (RP) has a capillary density similar to that of the CN (Fig. 2B, C). Extracollicular auditory structures nearby (i.e., the dorsal nucleus of the lateral lemniscus) have low to moderate capillary density (Fig. 2A, B). Nonauditory structures (i.e., the superior colliculus) have comparatively lower capillary density compared to auditory structures (Fig. 2A). There is evidence of CN inhomogeneities. Areas in the CN have patches with higher than average capillary density, particularly near the ventro-medial border (compare Fig. 2B, C).
3.2. Comparison of microvasculature between IC subdivisions
The CN consistently has lower NND values compared to those in the LC and DC (Fig. 3). However, differences between the LC and DC show no consistent pattern. In case 1575, the CN has significantly lower NND values than those of the LC (Mann-Whitney Test, p ≤ 0.05; Table 1B; Fig. 3). Likewise, NND values in the CN are lower than the values in the DC (Mann-Whitney Test, p ≤ 0.05). The NND differences between LC and DC are significant in two sections (Mann-Whitney Test, p ≤ 0.05), but not in one other section (Mann-Whitney Test, p ≥ 0.05). In case 1231, significant differences in NND values are seen between all subdivisions (Mann-Whitney Test, p ≤ 0.05).
Fig. 3.
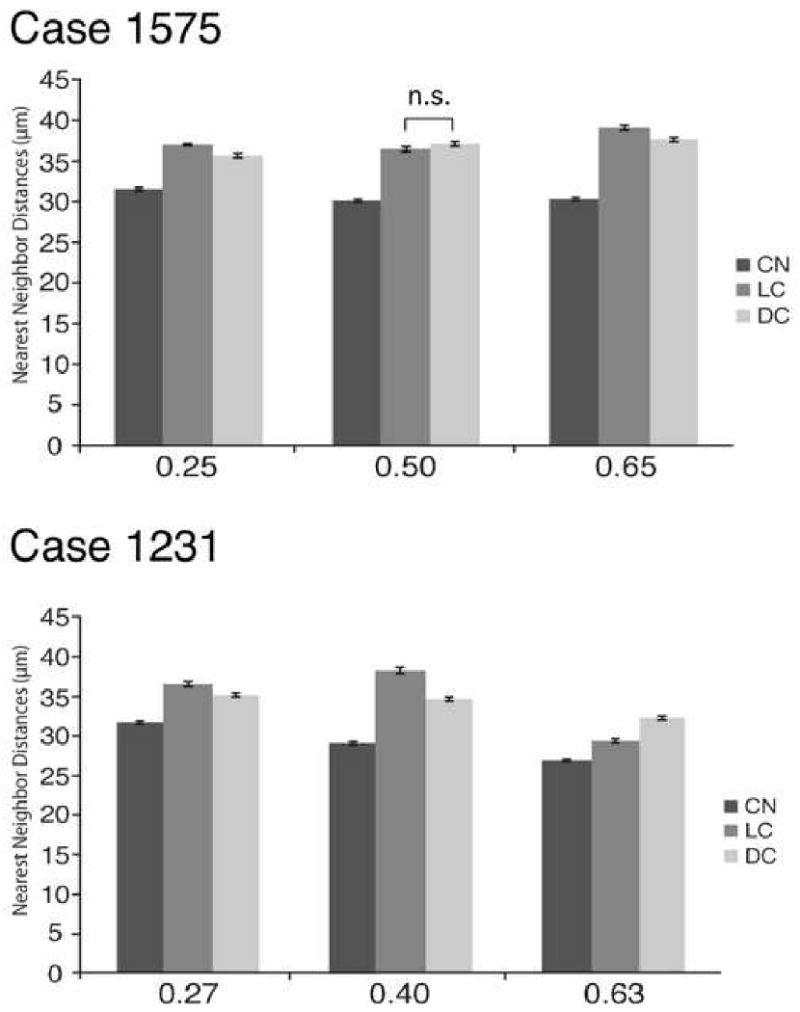
(A) Bar plots of means and standard errors of CN, LC, and DC NNDs for case 1575. The x-axis refers to the 0.25, 0.50 and 0.65 levels through the IC in case 1575 (Fig. 2). The most rostral section was excluded because the three subdivisions were not present at that level. n.s. = not significant. (B) Bar plots of means and standard errors of CN, LC, and DC NNDs for case 1231. The x-axis refers to the 0.27, 0.40 and 0.63 levels through the IC in case 1231. Asterisks denote significant differences.
3.3 Determining the presence of IC borders with NND values
We looked for the presence of a sharp border between the subdivisions using NND values (Fig. 4 A-D). Along the region of interest (ROI) that traverses the CN to DC border, average NND values start from ∼30 μm at the most ventral region of the CN and gradually increase to ∼50 μm at the most dorsal region of the DC (Fig. 4 A, B). The LOESS lines do not show any sharp changes to indicate a border between the CN and DC, and the frequency of capillaries in these ROIs also gradually decrease (Fig. 4 A, B).
Along the ROI that spans the LC to DC border, average NND values start from ∼40 μm in the LC and gradually reach ∼50 μm (Fig. 4C). Again, the LOESS line does not show any sharp changes to indicate a border between the LC and DC, and the gradual decrease in the frequency of capillaries in this ROI also confirms the lack of sharp borders (Fig. 4C).
In the ROI that spans the CN to LC border, the average NND values start from ∼30 μm, and stay constant (slope of about 0) until reaching the LC region, where the NND values increase gradually to ∼45 μm (Fig. 4D). The LOESS line does not show a sharp change to indicate the presence of a border between the CN and LC, although the change that is observed is more drastic than the change between the CN to DC and LC to DC borders (compare Figs. 4A-D).
4. Discussion
4.1 Methodological considerations for measuring microvasculature
Blood vessels can be identified unambiguously against the toluidine-blue stained neuropil (Gross et al., 1986; Gross et al., 1987; Andrew and Paterson, 1989; Black et al., 1991). This method has advantages over intracardial perfusion of viscous substances (i.e., India ink in gelatin; Yu et al., 1994; Michaloudi et al., 2003; Michaloudi et al., 2005; Grivas et al., 2003) because it eliminates the potential problem of incomplete perfusion. Further, obtaining the absolute counts of capillaries within these 1 μm-thick sections avoids the need for unbiased random sampling using stereological methods (Weibel, 1979).
We only classified cross-sectioned vessels with diameters ≤ 8 μm. However, larger-sized vessels (i.e., with diameters greater than 8 μm) were found to constitute less than 4% of the total vessel population in the CN of 24 day-old rat IC (Andrew and Paterson, 1989). In the developing rat, the left and right CN did not have significant differences in capillary numbers, suggesting that the microvascular plan is similar in both IC hemispheres (Andrew and Paterson, 1989). Assuming cat development is similar to the rat vascular development, our results in the right IC likely reflect the microvascular organization of the left IC as well.
A problem faced in quantifying capillary density was the presence of large “holes” in the Neurolucida capillary plots that did not represent brain tissue but large blood vessels. Calculating capillary density strictly as the number of capillaries/brain tissue area led to an underestimation of capillary density in areas with many large blood vessels. Thus, we employed the NND method to attenuate the effects of these gaps in the capillary plots.
4.2 Functional implications for microvascular organization in the IC
Capillary density has been shown to correlate well with metabolic activity (Gross et al., 1987; Borowsky and Collins, 1989; Tuor et al., 1994). Since the CN has the highest capillary density, it is not surprising that the CN also stains most intensely for CO (Loftus et al., 2008). Thus, differences in microvasculature between the IC subdivisions also parallel differences in metabolic activities. The highest microvascular density in the CN implies that the lemniscal or primary auditory pathway presumably is the most metabolically active. Whether this metabolic and vascular organization is conserved in downstream and upstream auditory structures still remains to be known. However, evidence suggests that in the medial geniculate body (MG), a structure one synaptic terminus upstream from the IC, the lemniscal division does not always have the highest microvascular density compared to the non-lemniscal divisions (Song and Winer, 2009).
We showed that the IC microvascular architecture does not show any definite borders of subdivisions. In fact, the microvascular density patterns change gradually between the CN, LC, and DC, which is consistent with the pattern observed in the IC with CO (Cant and Benson, 2006). Qualitatively, microvasculature aligns better with the Golgi-based parcellation scheme (Morest and Oliver, 1984) than the Nissl-based scheme (Berman, 1968) because the border between the CN to DC as seen through microvasculature does not extend as dorsally as the CN to DC border in a Nissl-based parcellation scheme. This is consistent with the finding that capillary density is not correlated with cell density (Baborie and Kuschinsky, 2006).
The RP is a nucleus of the IC that has different ascending projections (Harting and Van Lieshout, 2000) and descending corticofugal connections (Winer et al., 1998) compared to other subdivisions in the IC. In addition, neurons in the RP do not seem to respond to sound stimuli (Oliver, 2005). Although the RP differs connectionally and physiologically from the three main subdivisions in the IC, based on microvasculature, the RP has similar capillary density than that of the CN (Fig. 2).
4.3 Capillary density and implications for functional magnetic resonance imaging (fMRI)
Functional MRI relies on the blood-oxygen-level-dependent (BOLD) signal to indirectly measure neural activity and requires a close coupling between neural activity and the hemodynamic response. The BOLD signal is derived from local changes in cerebral blood flow (CBF), cerebral blood volume, and oxygenation that change in response to neural activity. An increase in CBF in an active area is the major component in determining a positive BOLD response (Buxton and Frank, 1997), and the main factor in determining the specificity of the signal is the brain's microvascular architecture and density (Logothetis, 2008). Currently, the spatial resolution in animal fMRI studies can be as high as 250×250 μm2 with a slice thickness of 2 mm (Goense et al., 2007). While this resolution is useful for studying neural activity in cortical lamina and orientation columns, it is not high enough to study IC subdivision micromodules like the CN fibrodendritic lamina that have each a thickness of 150 to 170 μm (Oliver, 2005). Moreover, spatial resolution in fMRI is unlikely to substantially increase since smaller voxel sizes significantly decrease signal-to-noise and contrast-to-noise ratios (Logothetis, 2008). Thus, fMRI can be useful in studying IC subdivisions as a whole, but its utility may be limited when studying neural activity within subdivisions.
An assumption in BOLD imaging studies is that changes in the BOLD signal are linearly related to neural activity. However, a more recent study showed with combined Laser Doppler Flowmetry and electrophysiological recordings that CBF and neural activity have a nonlinear relationship: large differences in CBF may not necessarily equate to large differences in neural activity (Jones et al., 2004). These findings support studies that found CBF disproportionately “floods” active areas of cortex (Malonek and Grinvald, 1996; Nemoto et al., 1999; Shtoyerman et al., 2000), as if “watering the entire garden for the sake of one thirsty flower” (Malonek and Grinvald, 1996). Interestingly, layer IV in the cortex exhibits the greatest increases in CBF (Gerrits et al., 2000), and contains the highest density of capillaries (Harrison et al., 2002; Weber et al., 2008). These findings suggest that capillary density may play a role in the nonlinear relationship between CBF (by inference the BOLD signal) and neural activity.
We find here that the CN has higher capillary density than the LC and DC. In a situation where each IC subdivision displays similar levels of neural activity, the CN may have a lower threshold for inducing the same BOLD response compared to the LC or DC by virtue of its higher structural capacity to induce more blood flow. Understanding the exact relationship between neural activity and the hemodynamic response is essential for functional brain imaging studies. Further studies need to be done to unveil the role of microvasculature in this intricate interplay.
Acknowledgments
We thank Jason Chung for his help with plotting blood vessels, David Larue and Katie Smith for technical assistance, and Karl Rohe for statistical assistance. We give special thanks to Dr. Nell Cant and Dr. Doug Oliver whose detailed and thoughtful comments refined the presentation of this study. Supported by USPHS grant R01DC02319-29.
Abbreviations
- BIC
brachium of the inferior colliculus
- BICN
brachium of the inferior colliculus, nucleus
- BOLD
blood-oxygen-level-dependent
- CBF
cerebral blood flow
- cic
commissure of the inferior colliculus
- CN
central nucleus
- CO
cytochrome oxidase
- DC
dorsal cortex
- dnll
dorsal nucleus of the lateral lemniscus
- IC
inferior colliculus
- LC
lateral cortex
- LOESS
locally estimated scatterplot smoothing
- MG
medial geniculate body
- NND
nearest neighbor distance
- pag
periaqueductal gray
- RP
rostral pole
- ROI
region of interest
- SC
superior colliculus
- VLN
ventrolateral nucleus of the lateral cortex
Footnotes
Publisher's Disclaimer: This is a PDF file of an unedited manuscript that has been accepted for publication. As a service to our customers we are providing this early version of the manuscript. The manuscript will undergo copyediting, typesetting, and review of the resulting proof before it is published in its final citable form. Please note that during the production process errors may be discovered which could affect the content, and all legal disclaimers that apply to the journal pertain.
References
- Aitkin L, Phillips S. Is the inferior colliculus an obligatory relay in the cat auditory system? Neurosci Lett. 1984b;1:315–319. doi: 10.1016/0304-3940(84)90032-6. [DOI] [PubMed] [Google Scholar]
- Aitkin L, Kenyon C, Philpott P. The representation of the auditory and somatosensory systems in the external nucleus of the cat inferior colliculus. J Comp Neurol. 1981;196:25–40. doi: 10.1002/cne.901960104. [DOI] [PubMed] [Google Scholar]
- Aitkin L, Tran L, Syka J. The responses of neurons in the subdivisions of the inferior colliculus of cats to tonal, noise and vocal stimuli. Exp Brain Res. 1994;98:53–64. doi: 10.1007/BF00229109. [DOI] [PubMed] [Google Scholar]
- Aitkin L, Webster W, Veale J, Crosby D. Inferior colliculus. I. Comparison of response properties of neurons in central, pericentral, and external nuclei of adult cat. J Neurophysiol. 1975;38:1196–1207. doi: 10.1152/jn.1975.38.5.1196. [DOI] [PubMed] [Google Scholar]
- Andrew DLE, Paterson JA. Postnatal development of the vascularity in the inferior colliculus in the young rat. Am J Anat. 1989;186:389–396. doi: 10.1002/aja.1001860408. [DOI] [PubMed] [Google Scholar]
- Baborie A, Kuschinsky W. Lack of relationship between cellular density and either capillary density or metabolic rate in different regions of the brain. Neurosci Lett. 2006;404:20–22. doi: 10.1016/j.neulet.2006.05.008. [DOI] [PubMed] [Google Scholar]
- Bär TH, Wolff JR. The formation of capillary basement during internal vascularization of the rat's cerebral cortex. Z Zellforsch. 1972;133:231–248. doi: 10.1007/BF00307145. [DOI] [PubMed] [Google Scholar]
- Berman AL. A cytoarchitectonic atlas with stereotaxic coordinates. The University of Wisconsin Press; Madison: 1968. [Google Scholar]
- Black JE, Zelanzny AM, Greenough WT. Capillary and mitochondrial support for neural plasticity in adult rat visual cortex. Exp Neurol. 1991;111:204–209. doi: 10.1016/0014-4886(91)90008-z. [DOI] [PubMed] [Google Scholar]
- Borowsky IW, Collins RC. Metabolic anatomy of brain: a comparison of regional capillary density, glucose metabolism, and enzyme activities. J Comp Neurol. 1989;288:401–413. doi: 10.1002/cne.902880304. [DOI] [PubMed] [Google Scholar]
- Cant NB. Projections from the cochlear nuclear complex to the inferior colliculus. In: Winer JA, Schreiner CE, editors. The Inferior Colliculus. Springer; New York, NY: 2005. [Google Scholar]
- Cant NB, Benson CG. Parallel auditory pathways: projection patterns of the different neuronal populations in the dorsal and ventral cochlear nuclei. Brain Res Bull. 2003;60:457–474. doi: 10.1016/s0361-9230(03)00050-9. [DOI] [PubMed] [Google Scholar]
- Cant NB, Benson CG. Organization of the inferior colliculus of the gerbil (Meriones unguiculatus): differences in the distribution of projections from the cochlear nuclei and the superior olivary complex. J Comp Neurol. 2006;495:511–528. doi: 10.1002/cne.20888. [DOI] [PMC free article] [PubMed] [Google Scholar]
- Cant NB, Benson CG. Organization of the inferior colliculus of the gerbil (Meriones unguiculatus): projections from the cochlear nucleus. Neuroscience. 2008;154:206–217. doi: 10.1016/j.neuroscience.2008.02.015. [DOI] [PMC free article] [PubMed] [Google Scholar]
- Chernock ML, Larue DT, Winer JA. A periodic network of neurochemical modules in the inferior colliculus. Hear Res. 2004;188:12–20. doi: 10.1016/S0378-5955(03)00340-X. [DOI] [PubMed] [Google Scholar]
- Coleman JR, Clerici WJ. Sources of projections to the subdivisions of the inferior colliculus in the rat. J Comp Neurol. 1987;262:215–226. doi: 10.1002/cne.902620204. [DOI] [PubMed] [Google Scholar]
- Conradi NC, Engvall J, Wolff JR. Angioarchitectonics of rat cerebellar cortex during pre- and postnatal development. Acta Neuropathol. 1980;50:131–138. doi: 10.1007/BF00692863. [DOI] [PubMed] [Google Scholar]
- Coote EJ, Rees A. The distribution of nitric oxide synthase in the inferior colliculus of guinea pigs. Neuroscience. 2008;154:218–225. doi: 10.1016/j.neuroscience.2008.02.030. [DOI] [PubMed] [Google Scholar]
- Cox SB, Woolsey TA, Rovainen CM. Localized dynamic changes in cortical blood flow with whisker stimulation corresponds to matched vascular and neuronal architecture of rat barrels. J Cereb Blood Flow. 1993;13:899–913. doi: 10.1038/jcbfm.1993.113. [DOI] [PubMed] [Google Scholar]
- Craigie EH. On the relative vascularity of various parts of the central nervous system of the albino rat. J Comp Neurol. 1920;31:429–464. [Google Scholar]
- Craigie EH. The vascularity of the cerebral cortex of the albino rat. J Comp Neurol. 1921;33:193–212. [Google Scholar]
- Diamond IT, Jones EG, Powell TPS. The projection of the auditory cortex upon the diencephalon and brain stem in the cat. Brain Res. 1969;15:305–340. doi: 10.1016/0006-8993(69)90160-7. [DOI] [PubMed] [Google Scholar]
- Dunning HS, Wolff HG. The relative vascularity of various parts of the central and peripheral nervous system of the cat and its relation to function. J Comp Neurol. 1937;67:433–450. [Google Scholar]
- Faye Lund H, Osen KK. Anatomy of the inferior colliculus in rat. Anat Embryol. 1985;171:1–20. doi: 10.1007/BF00319050. [DOI] [PubMed] [Google Scholar]
- Fonta C, Imbert M. Vascularization of the primate visual cortex during development. Cereb Cortex. 2002;12:199–211. doi: 10.1093/cercor/12.2.199. [DOI] [PubMed] [Google Scholar]
- Goense JBM, Zappe A, Logothetis NK. High-resolution fMRI of macaque V1. Magn Reson Imaging. 2007;25:740–747. doi: 10.1016/j.mri.2007.02.013. [DOI] [PubMed] [Google Scholar]
- Gonzalez-Lima F, Jones D. Quantitative mapping of cytochrome oxidase activity in the central auditory system of the gerbil: a study with calibrated activity standards and metal intensified histochemistry. Brain Res. 1994;660:34–49. doi: 10.1016/0006-8993(94)90836-2. [DOI] [PubMed] [Google Scholar]
- Grivas I, Michaloudi H, Batzios C, Chiotelli M, Papatheodoropoulos C, Kostopoulos G, Papadopoulos GC. Vascular network of the rat hippocampus is not homogeneous along the septotemporal axis. Brain Res. 2003;971:245–249. doi: 10.1016/s0006-8993(03)02475-2. [DOI] [PubMed] [Google Scholar]
- Gross PM, Sposito NM, Pettersen SE, Panton DG, Fenstermacher JD. Topography of capillary density, glucose metabolism, and microvascular function within the rat inferior colliculus. J Cereb Blood Flow. 1987;7:154–160. doi: 10.1038/jcbfm.1987.38. [DOI] [PubMed] [Google Scholar]
- Harrison RV, Harel N, Panesar J, Mount RJ. Blood capillary distribution correlates with hemodynamic-based functional imaging of the cerebral cortex. Cereb Cortex. 2002;12:225–233. doi: 10.1093/cercor/12.3.225. [DOI] [PubMed] [Google Scholar]
- Harting JK, Lieshout DP. Projections from the rostral pole of the inferior colliculus to the cat superior colliculus. Brain Res. 2000;881:244–247. doi: 10.1016/s0006-8993(00)02849-3. [DOI] [PubMed] [Google Scholar]
- Herbert H, Aschoff A, Ostwald J. Topography of projections from the auditory cortex to the inferior colliculus in rat. J Comp Neurol. 1991;304:103–122. doi: 10.1002/cne.903040108. [DOI] [PubMed] [Google Scholar]
- Irvine DRF. The auditory brainstem. A review of the structure and function of auditory brainstem processing mechanisms. Prog Sens Physiol. 1986;7:1–279. [Google Scholar]
- Jain R, Shore S. External inferior colliculus integrates trigeminal and acoustic information: unit responses to trigeminal nucleus and acoustic stimulation in the guinea pig. Neurosci Lett. 2006;395:71–75. doi: 10.1016/j.neulet.2005.10.077. [DOI] [PubMed] [Google Scholar]
- Jenkins WM, Masterton RB. Sound localization: effects of unilateral lesions in central auditory system. J Neurophysiol. 1982;47:987–1016. doi: 10.1152/jn.1982.47.6.987. [DOI] [PubMed] [Google Scholar]
- Jones M, Hewson-Stoate N, Martindale J, Redgrave P, Mayhew J. Nonlinear coupling of neural activity and CBF in rodent barrel cortex. Neuroimage. 2004;22:956–965. doi: 10.1016/j.neuroimage.2004.02.007. [DOI] [PubMed] [Google Scholar]
- Larue DT, Winer JA. Postembedding immunocytochemistry of large sections of brain tissue: an improved flat-embedding technique. J Neurosci Methods. 1996;64:69–74. doi: 10.1016/0165-0270(95)00111-5. [DOI] [PubMed] [Google Scholar]
- Loftus WC, Malmierca MS, Bishop DC, Oliver DL. The cytoarchitecture of the inferior colliculus revisited: a common organization of the lateral cortex in rat and cat. Neuroscience. 2008;154:196–205. doi: 10.1016/j.neuroscience.2008.01.019. [DOI] [PMC free article] [PubMed] [Google Scholar]
- Logothetis NK. What we can do and what we cannot do with fMRI. Nature. 2008;453:869–878. doi: 10.1038/nature06976. [DOI] [PubMed] [Google Scholar]
- Malmierca MS, Izquierdo MA, Cristaudo S, Hernández O, Peréz-González D. A discontinuous tonotopic organization in the inferior colliculus of the rat. J Neurosci. 2008;28:4767–4776. doi: 10.1523/JNEUROSCI.0238-08.2008. [DOI] [PMC free article] [PubMed] [Google Scholar]
- Malonek D, Grinvald A. Interactions between electrical activity and cortical microcirculation revealed by imaging spectroscopy: implications for functional brain mapping. Proc Natl Acad Sci U S A. 1996;272:551–554. doi: 10.1126/science.272.5261.551. [DOI] [PubMed] [Google Scholar]
- Masamoto K, Krauchi T, Takizawa N, Kobayashi H, Tanishita K. Successive depth variations in microvascular distribution of rat somatosensory cortex. Brain Res. 2003;2003:66–75. doi: 10.1016/j.brainres.2003.09.055. [DOI] [PubMed] [Google Scholar]
- Mato M, Ookawara S. A simple method for observations of the capillary nets in rat brain cortex. Experientia. 1979;55:501–503. doi: 10.1007/BF01922731. [DOI] [PubMed] [Google Scholar]
- Merzenich MM, Reid MD. Representation of the cochlea within the inferior colliculus of the cat. Brain Res. 1974;77:397–415. doi: 10.1016/0006-8993(74)90630-1. [DOI] [PubMed] [Google Scholar]
- Michaloudi H, Grivas I, Batzios C, Chiotelli M, Papadopoulos GC. Parallel development of blood vessels and mast cells in the lateral geniculate nuclei. Dev Brain Res. 2003;140:269–276. doi: 10.1016/s0165-3806(02)00613-2. [DOI] [PubMed] [Google Scholar]
- Michaloudi H, Grivas I, Batzios C, Chiotelli M, Papadopoulos GC. Areal and laminar variations in the vascularity of the visual, auditory, and entorhinal cortices of the developing rat brain. Dev Brain Res. 2005;155:60–70. doi: 10.1016/j.devbrainres.2004.11.007. [DOI] [PubMed] [Google Scholar]
- Morest DK, Oliver DL. The neuronal architecture of the inferior colliculus in the cat: defining the functional anatomy of the auditory midbrain. J Comp Neurol. 1984;222:209–236. doi: 10.1002/cne.902220206. [DOI] [PubMed] [Google Scholar]
- Nemoto M, Nomura Y, Tamura M, Sato C, Houkin K, Abe H. Optical imaging and measuring of local haemoglobin concentration and oxygenation changes during somatosensory stimulation in rat cerebral cortex. Adv Exp Med Biol. 1997;428:521–531. doi: 10.1007/978-1-4615-5399-1_74. [DOI] [PubMed] [Google Scholar]
- Oliver DL. Neuronal organization in the inferior colliculus. In: Winer JA, Schreiner CE, editors. The Inferior Colliculus. Springer; New York: 2005. [Google Scholar]
- Oliver DL, Morest DK. The central nucleus of the inferior colliculus in the cat. J Comp Neurol. 1984;222:237–264. doi: 10.1002/cne.902220207. [DOI] [PubMed] [Google Scholar]
- Oliver DL, Ostapoff EM, Beckius GE. Direct innervation of identified tectothalamic neurons in the inferior colliculus by axons from the cochlear nucleus. Neuroscience. 1999;93:643–658. doi: 10.1016/s0306-4522(99)00143-8. [DOI] [PubMed] [Google Scholar]
- Oliver DL, Beckius GE, Bishop DC, Kuwada S. Simultaneous anterograde labeling of axonal layers from lateral superior olive and dorsal cochlear nucleus in the inferior colliculus of cat. J Comp Neurol. 1997;23:7438–7449. doi: 10.1002/(sici)1096-9861(19970602)382:2<215::aid-cne6>3.0.co;2-6. [DOI] [PubMed] [Google Scholar]
- Oliver DL, Kuwada S, Yin TCT, Haberly LB, Henkel CK. Dendritic and axonal morphology of HRP-injected neurons in the inferior colliculus of the cat. J Comp Neurol. 1991;303:75–100. doi: 10.1002/cne.903030108. [DOI] [PubMed] [Google Scholar]
- Paloff AM, Hinova-Palova DV. Topographical distribution of NADPH- diaphorase positive neurons in the cat's inferior colliculus. J Hirnforsch. 1998;39:231–243. [PubMed] [Google Scholar]
- Ramón y Cajal S. Nerf acoustique: Sa branche cochleene ou nerf cochléaire. Instituto Ramón y Cajal; Madrid: 1909. 1972 reprint. [Google Scholar]
- Riddle DR, Gutierrez G, Zheng D, White LE, Richards A, Purves D. Differential metabolic and electrical activity in the somatic sensory cortex of juvenile and adult rats. J Neurosci. 1993;13:4193–4213. doi: 10.1523/JNEUROSCI.13-10-04193.1993. [DOI] [PMC free article] [PubMed] [Google Scholar]
- Rose JE, Greenwood DD, Goldberg JM, Hind JE. Some discharge characteristics of single neurons in the inferior colliculus of the cat. I. Tonotopical organization, relation of spike-counts to tone intensity, and firing patterns of single elements. J Neurophysiol. 1962;26:294–320. doi: 10.1152/jn.1963.26.2.321. [DOI] [PubMed] [Google Scholar]
- Schneiderman A, Henkel CK. Banding of lateral superior olivary nucleus afferents in the inferior colliculus: a possible substrate for sensory integration. J Comp Neurol. 1987;266:519–534. doi: 10.1002/cne.902660406. [DOI] [PubMed] [Google Scholar]
- Schofield BR, Cant NB. Organization of the superior olivary complex of the guinea pig: II. Patterns of projections from the periolivary nuclei to the inferior colliculus. J Comp Neurol. 1992;317:438–455. doi: 10.1002/cne.903170409. [DOI] [PubMed] [Google Scholar]
- Schofield BR, Cant NB. Projections from the ventral cochlear nucleus to the inferior colliculus and the contralateral cochlear nucleus in guinea pigs. Hear Res. 1996;102:1–14. doi: 10.1016/s0378-5955(96)00121-9. [DOI] [PubMed] [Google Scholar]
- Schreiner CE, Langner G. Laminar fine structure of the frequency organization of the auditory midbrain. Nature. 1997;388:383–386. doi: 10.1038/41106. [DOI] [PubMed] [Google Scholar]
- Servière J, Webster WR, Calford MB. Isofrequency labelling revealed by a combined [14C]-2-deoxyglucose, electrophysiological, and horseradish peroxidase study of the inferior colliculus of the cat. J Comp Neurol. 1984;228:463–477. doi: 10.1002/cne.902280403. [DOI] [PubMed] [Google Scholar]
- Shtoyerman E, Arieli A, Slovin H, Vanzetta I, Grinvald A. Long-term optical imaging and spectroscopy reveal mechanisms underlying the intrinsic signal and stability of cortical maps in V1 of behaving monkeys. J Neurosci. 2000;20:8111–8121. doi: 10.1523/JNEUROSCI.20-21-08111.2000. [DOI] [PMC free article] [PubMed] [Google Scholar]
- Song Y, Winer JA. Assoc Res Otolaryngol. Baltimore, Maryland: 2009. Vascular differences between the cat medial geniculate body and inferior colliculus. [Google Scholar]
- Tieman SB, Möllers S, Tieman DG, White J. The blood supply of the cat's visual cortex and its postnatal development. Brain Res. 2004;998:100–112. doi: 10.1016/j.brainres.2003.11.023. [DOI] [PubMed] [Google Scholar]
- Tuor UI, Kurpita G, Simone C. Correlation of local changes in cerebral blood flow, capillary density, and cytochrome oxidase during development. J Comp Neurol. 1994;342:439–448. doi: 10.1002/cne.903420310. [DOI] [PubMed] [Google Scholar]
- Weber B, Keller AL, Reichold J, Logothetis NK. The microvascular system of the striate and extrastriate visual cortex of the macaque. Cereb Cortex. 2008;18:2318–2330. doi: 10.1093/cercor/bhm259. [DOI] [PubMed] [Google Scholar]
- Weibel ER. Stereological Methods. Vol 1: Practical Methods for Biological Morphometry. Academic Press; London: 1979. [Google Scholar]
- Winer JA. Descending Input to the Midbrain. In: Winer JA, Schreiner CE, editors. The Inferior Colliculus. Springer; New York, NY: 2005. [Google Scholar]
- Winer JA, Larue DT, Diehl JJ, Hefti BJ. Auditory cortical projections to the cat inferior colliculus. J Comp Neurol. 1998;400:147–174. [PubMed] [Google Scholar]
- Woolsey TA, Rovainen CM, Cox MH, Henegar MH, Liang GE, Liu D, Moskalenko YE, Sui J, Wei L. Neuronal units linked to microvascular modules in cerebral cortex: response elements for imaging the brain. Cereb Cortex. 1996;6:647–660. doi: 10.1093/cercor/6.5.647. [DOI] [PubMed] [Google Scholar]
- Yu BP, Yu CC, Robertson RT. Patterns of capillaries in developing cerebral and cerebellar cortices of rats. Acta Anat. 1994;149:128–133. doi: 10.1159/000147567. [DOI] [PubMed] [Google Scholar]
- Zheng D, LaMantia A, Purves D. Specialized vascularization of the primate visual cortex. J Neurosci. 1991;11:2622–2629. doi: 10.1523/JNEUROSCI.11-08-02622.1991. [DOI] [PMC free article] [PubMed] [Google Scholar]
- Zhou J, Shore S. Convergence of spinal trigeminal and cochlear nucleus projections in the inferior colliculus of the guinea pig. J Comp Neurol. 2006;495:100–112. doi: 10.1002/cne.20863. [DOI] [PubMed] [Google Scholar]