

Abstract
Neuropsychological assessment aids in the diagnosis of Alzheimer’s disease (AD) by objectively establishing cognitive impairment from standardized tests. We present new criteria for diagnosis that use weighted combined scores from multiple tests. Our method employs two multivariate analyses: Principal Components Analysis (PCA) and discriminant analysis. PCA (N = 216 subjects) created more interpretable cognitive dimensions by resolving 49 test measures in our neuropsychological battery to 13 component scores for each subject. The component scores were used to build discriminant functions that classified each participant as either an early-stage AD (N = 55) or normal elderly (N = 78). Our discriminant function performed with high accuracy, sensitivity, and specificity (nearly all >90%) in the development, a cross-validation, and a new subjects validation. When contrasted to two different traditional empirical methods for diagnosis (using cutscores and defining AD as falling below 5% on two or more test domains), our results suggested that the multivariate method was superior in classification (approximately 20% more accurate).
Keywords: Discriminant analysis, neuropsychological tests, diagnosis, Alzheimer’s disease (AD), Principal Components Analysis (PCA), multivariate analyses, NINCDS-ADRDA criteria, posterior probability
Alzheimer’s disease (AD) is an age-related neurological illness with early cognitive and behavioral disruption, particularly in the domain of memory. Neuropsychological test batteries are commonly used as an aid in diagnosing AD (Bäckman, Jones, Berger, Laukka, & Small, 2005), and this is traditionally done by relating the patient’s score on each individual test to an arbitrary criterion that is indicative of impairment below the mean score of a normative reference group (McKhann et al., 1984). Evidence-based criteria for diagnosing AD that systematically build a weighted combined score from all the tests in a battery might better discriminate impaired cognition from normal cognitive functioning.
Multivariate methods for analyzing neuropsychological test batteries have been explored by others (Carroll, 1993). Loewenstein et al. (2001) examined the NINCDS-ADRDA criteria through a series of neuropsychological tests administered to only AD patients to determine how many factors best represent AD. They concluded that a six-factor model, including factors for general memory, executive function, visuospatial skills, and verbal abilities, fit the AD participants’ test results better than a single factor model. Despite some problems in coping with separate factor analyses on each group, Siedlecki et al. (2008) suggested that there was a fair amount of similarity in the factor structures among AD, questionable dementia, and normal older adult groups. Here we carry factor analysis of a neuropsychological battery further by looking beyond group differences to build a multivariate diagnostic method that classifies individuals as either early-stage AD or normal. We selected AD patients that were considered early in the course of the disease because they are more important and more difficult to discriminate from normal elderly. Early detection of AD is critical in applying timely pharmacologic and therapeutic interventions. Our multivariate method could improve traditional neuropsychological assessment of AD by formalizing how the neuropsychological test measures are combined.
We employ sequential multivariate analyses: Principal Components Analysis (PCA) and discriminant analysis. PCA allows the extraction of components from the neuropsychological tests that more parsimoniously represent the patient’s performance. (We will use the term “component” instead of “factor”, though they are nearly analogous, because we performed PCA rather than common factor analysis). PCA provides both (1) component loadings (which relate test measures to the components) and (2) component scores (which pertain to an individual’s performance on those components). The patient’s scores on the multitude of tests are remapped to fewer scores, one for each of the underlying components. While previous work has utilized the factor loadings to measure group differences and similarities in factor structures (Siedlecki et al., 2008), here we add another important step by combining the component (factor) scores in a reasoned, formal way through discriminant analysis to develop a global measure that is aimed at better differentiating individuals with AD from normal elderly. The relative weights assigned to each component by the discriminant analysis can improve the discriminatory power of the neuropsychological tests. The methodology presented in this article produced a highly accurate classification of each individual as either AD or normal, and we further tested its strength in two validation analyses and by comparison with the traditional method.
Methods
Study Sample
To more parsimoniously represent each subject’s neuropsychological test performance in terms of underlying component scores, we performed PCA on a group of 216 elderly participants. This included 55 AD individuals and 78 elderly without impaired cognitive function (Control) (Table 1). We also included 78 patients diagnosed with Mild Cognitive Impairment (MCI, a diagnosable condition of cognitive impairment that is thought to lie between normal cognitive functioning and AD) (Petersen et al., 2001) and 5 patients diagnosed with Age Associated Memory Impairment (AAMI) (Crook et al., 1986) in the PCA to generate a component solution with greater generalizability to the population (John, Easton, Prichep, & Friedman, 1993). The MCI group contained 34 females (mean age in years(SD) = 72.9(8.5)) and 44 males (mean age in years(SD) = 73.9(8.4)), whose demographics were similar to those of the AD and Control groups. We used 133 elderly subjects in our discriminant analyses: 55 diagnosed with early-stage AD and 78 Controls (Table 1). These 133 subjects were divided into two sets for the discriminant analyses: a development set (including 40 ADs and 40 Controls, totaling 80 subjects) and a new subjects validation set (including 15 ADs and 38 Controls, totaling 53 subjects). The subjects selected for the development set were those that were demographically well-matched for age and education and approximately half female and half male. We included more participants in the development set to produce a more reliable discriminant function while leaving a reasonable number of subjects in the validation set. All 216 participants spoke fluent English.
Table 1.
Subject demographics for discriminant analysis
| Group | Size | Age | Education | MMSE |
|---|---|---|---|---|
| Development Set (n=80) | ||||
| AD | ||||
| Female | 18 | 75.2 (7.5) | 14.0 (2.5) | 24.4 (3.7) |
| Male | 22 | 77.1 (4.5) | 15.0 (2.7) | 23.8 (3.6) |
| Control | ||||
| Female | 20 | 72.3 (6.1) | 14.9 (2.5) | 28.9 (1.3) |
| Male | 20 | 75.6 (6.0) | 16.9 (3.1) | 28.1 (1.6) |
| New Subjects Set (n=53) | ||||
| AD | ||||
| Female | 6 | 75.1 (12.6) | 11.7 (4.2) | 24.0 (2.1) |
| Male | 9 | 74.5 (9.4) | 15.2 (3.4) | 26.3 (4.1) |
| Control | ||||
| Female | 27 | 64.3 (10.6) | 15.8 (2.3) | 29.2 (1.1) |
| Male | 11 | 71.6 (13.1) | 16.0 (2.2) | 27.8 (1.9) |
Note. Values appear as mean (SD). The age and education are number of years. The maximum score on the Mini Mental State Examination (MMSE) (Folstein et al., 1975) is 30. The AD and Control groups have significantly different mean education levels (p<.05), but the difference between their mean ages was not significant. The effects of age and education were removed from our data before the PCA in all the cases where age and education corrected normative data were available. The MMSE scores are significantly different between the AD and Control groups (p<.001) as expected. While the individuals in the new subject validation set are not as well matched, their demographics played no role in their classification. The discriminant function was created from the development set, which is well matched in gender, age, and education. The classification accuracy remained high in the new subjects validation. This result strengthens the generalizability of the discriminant function.
The AD and MCI subjects were independently diagnosed by memory-disorders physicians from area clinics using standard accepted clinical criteria. Each AD subject met standard criteria for AD (NINCDS-ADRDA) (McKhann et al., 1984) and DSM-4TR criteria for Dementia of the Alzheimer’s Type (American Psychiatric Association, 2000) and was considered early in the course of the disease. All MCI subjects met standard consensus criteria for amnestic MCI (Petersen, 2004; Petersen et al., 1999). The clinical diagnosis of MCI and AD was based on the history, relevant laboratory findings, and imaging studies routinely performed as part of the clinical assessment of dementia (Petersen et al., 2001). Limited cognitive testing was performed by the memory-disorders physicians to assist with their diagnosis. With the exception of the Mini Mental State Examination (MMSE) (Folstein, Folstein, & McHugh, 1975), a clock face drawing, and a category fluency task (animal naming), no cognitive test used in clinical decision making was repeated as part of our experimental cognitive test battery described below. Control subjects were elderly volunteers from the community, many of whom were deemed to have normal cognitive functioning by the same memory-disorders physicians. At the time of testing, 48 of the 55 AD subjects (28 males, 20 females) were taking cholinesterase inhibitors and/or memantine. Exclusion criteria for all subjects included Parkinson’s disease, HIV/AIDS, clinical (or imaging) evidence of stroke, reversible dementias, and treatment with benzodiazepines, antipsychotic, or antiepileptic medications. Informed consent approved by Research Subjects Review Board at the University of Rochester was obtained prior to testing. The neuropsychological test data collected in our study and used in the multivariate methodology presented here did not contribute to the clinical diagnoses of the subjects.
Neuropsychological Assessment
The experimental neuropsychological battery administered to each subject contained 15 common tests (Table 2) that target different cognitive domains, particularly memory. We designed the battery to produce a comprehensive sample of cognitive processes and their degeneration in AD. Among others, the tests included measures of memory retrieval and retention, generative fluency, executive function, visuospatial abilities, and attributes of mood and daily living. The subscores of the neuropsychological tests were used to produce a more detailed assessment of the subject’s cognitive performance, including content accuracy and timing (Carroll, 1993). For the MMSE, the total score was used in all analyses.
Table 2.
Neuropsychological test battery administered to the participants
| Test | Cognitive Domains |
|---|---|
| Rey-Osterrieth Complex Figure: Copy and Recall (immediate and delayed) [Rey] (Osterrieth, 1944; Rey, 1941) | Memory Praxis (copy task) |
| Mini-Mental State Examination [MMSE] (Folstein et al., 1975) | Brief test of general cognitive abilities |
| WMS-III Digit Span and Letter Number Sequencing Tests (Wechsler, 1997) | Working memory, attention |
| Geriatric Depression Scale [GDS] (Yesevage et al., 1983) | Mood, daily functioning |
| WMS-R Logical Memory I and II [LM-R I and LM- R II] (Wechsler, 1945, 1987) | Memory |
| Clock Face Drawing (Tuokko, Hadjistavropoulos, Miller, & Beattie, 1992) | Perception, problem- solving |
| North American National Adult Reading Test [AMNART] (Grober & Sliwinski, 1991) | Premorbid verbal intelligence |
| Stroop Test (Golden, 1978) | Attention |
| Brief Visuospatial Memory Test-Revised [BVMT-R] (Benedict & Groninger, 1995) | Memory, visuospatial abilities |
| Controlled Oral Word Association Test [COWAT] and Category Fluency (Benton & Hamsher, 1976) | Language |
| Blessed Dementia Scale [BDS] (Blessed, Tomlinson, & Roth, 1968; Morris et al., 1989; Stern, Hesdorffer, Sano, & Mayeux, 1990; Zillmer, Fowler, Gutnick, & Becker, 1990) | Daily functioning |
| Hopkins Verbal Learning Test [HVLT] (Brandt, 1991) | Memory, language |
| Boston Naming Test [BNT] 15 item CERAD version (Kaplan, Goodglass, & Weintraub, 1978; Mack, Freed, Williams, & Henderson, 1992) | Language |
| Standardized Road-Map Test of Direction [Road- Map] (Money, 1976) | Visuospatial orientation |
| Trail Making Test [TMT] A and B (Reitan, 1958) | Trail A – attention Trail B – problem- solving |
Note. Battery of tests was administered in the order shown. The cognitive domains relate to grouping the tests for the traditional methods as suggested by the NINCDS-ADRDA criteria (McKhann et al., 1984) and as used in this paper.
All neuropsychological measures were standardized to have zero mean and unit variance using established age/education corrected normative data when possible and laboratory-derived data (normal elderly) when published norms were not available. This is acceptable because normal subjects are often used as a baseline with which other subject groups are contrasted. Standard z scores are easier to compare than raw test measures, which lie in different metrics. Prior to standardization, the raw time scores were transformed to speed scores by computing their reciprocal in order to reduce skewness. Because age is an important risk factor for developing AD, it is possible the normative data for the neuropsychological tests (which take age into account) may include misdiagnosed “normal” individuals who have developed or were developing memory impairments. However, because we performed this standardization before entering the same data into both the traditional and multivariate diagnostic methods, differences in classification success of these two methods would not disparately be affected by any flaws in the normative data.
Measurements of Diagnostic Power
How well a diagnostic test performs was determined through three measures: accuracy, sensitivity, and specificity. Accuracy refers to the total number of individuals correctly classified (ADs classified as ADs, or true positives, and Controls classified as Controls, or true negatives) as a percent of the total individuals classified. The sensitivity of a test measures its power of detecting the disease among those that have the disease. The specificity of a test measures its ability to not find the disease in those that do not have it. A desirable diagnostic test has high accuracy, sensitivity, and specificity.
Multivariate Assessment
Our multivariate methodology is summarized in a flow diagram (Figure 1). Principal Components Analysis (PCA) was used to develop the component structure from the battery of neuropsychological tests. The 216 participants (observations) and 49 test measures (variables) were submitted to a PCA with Varimax rotation (Kaiser, 1958). Although discriminant analyses could be performed on the raw test measures, PCA (Carroll, 1993; Chapman & McCrary, 1995; Harman, 1976) added several distinct advantages to our methodology. First, PCA resolved the 49 test measures to a smaller number of component scores for each subject, which reduced the amount of data and organized the information along more interpretable dimensions. This also limited the possibility of chance influencing the discrimination results by decreasing the number of variables used in the discriminant analysis (Ahlgren, 1986). Second, every test contributed to the component solution through its loadings on each component. The component loadings were used to interpret what cognitive processes each component represented. The names of the components in Figure 1 were chosen by consideration of the particular test measures that had higher loadings on each component. Third, it is difficult, if not impossible, to strictly determine what mental processes any particular test involves. PCA empirically derived underlying cognitive components that represent separate cognitive domains, such as episodic memory or generative fluency, and the subject’s component scores place his or her performance on those components. This relates the subject’s performance on a test more directly to particular aspects of cognitive functioning.
Figure 1.
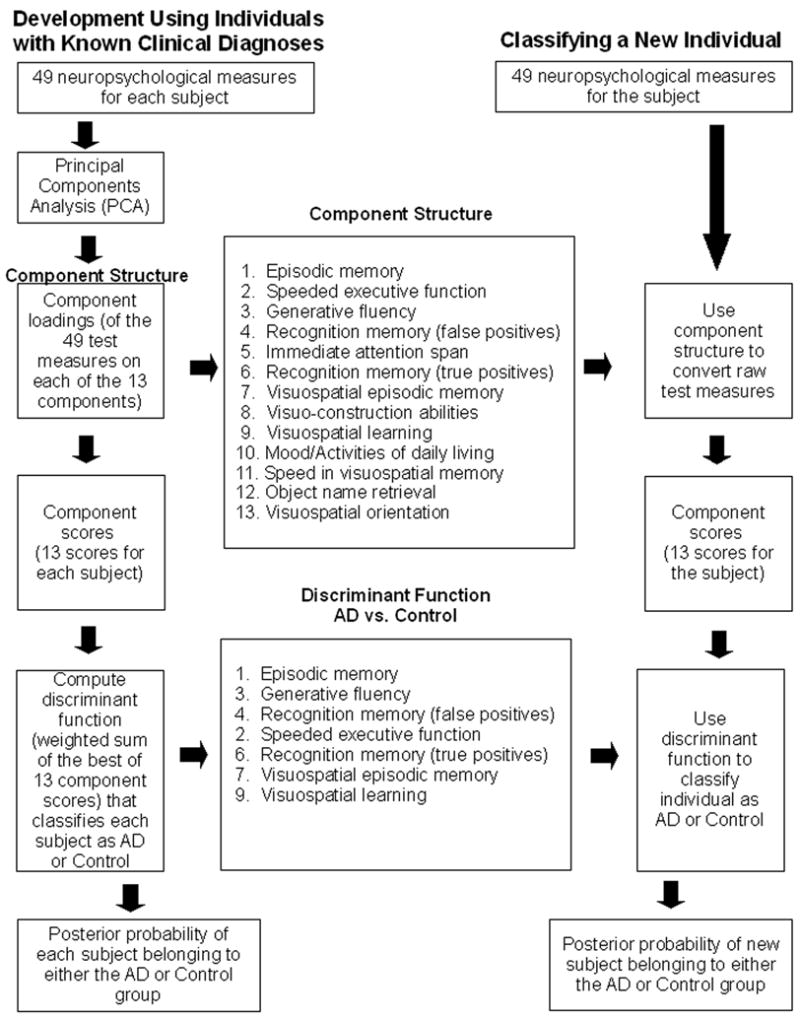
Developing and using a component structure of neuropsychological test measures to discriminate AD from Control. The Component Structure was derived from Principal Components Analysis (PCA) of 49 neuropsychological test measures from 216 AD, MCI, Control, and AAMI individuals. The component numbers in the Component Structure reflect the order of the components in the PCA solution. The order of the seven components used in the Discriminant Function represents relative weights that best discriminate AD from Control individuals. The right column depicts the application of this method to diagnose a new individual.
203×269mm (300 × 300 DPI)
Though there are multiple mathematical methods that both achieve data reduction and measure latent constructs in a dataset, PCA operates with relatively few prior assumptions. Additionally, it allows easy computation of component scores. While we could have reduced the number of variables in our PCA by using composite neuropsychological test measures (such as total scores rather than trial scores) or by removing variables that we thought would not strongly contribute to one or more components, we believed it was a better choice to include as much information in the analysis as feasible. Additionally, performing the PCA with fewer variables (a 33% reduction) that only included composite measures on the same set of subjects produced essentially the same components (although the order and loading patterns varied slightly). Finally, the choice of how to measure the latent constructs generally does not greatly affect the results (Velicer & Jackson, 1990) and sample size as a function of the number of variables is not an important factor for stability (Guadagnoli & Velicer, 1988).
In discriminant analysis (lower Figure 1), the component scores of the AD and Control individuals were used to build a discriminant function that classifies participants as belonging to either the AD or Control group. The linear discriminant function is comprised of the sum of the selected component scores, each weighted by their best contribution in differentiating the subject groups. In SAS’ STEPDISC procedure, the stepwise variable selection begins, like forward selection, with no variables in the model. At each step, the model is examined. If the variable in the model that contributes least to the discriminatory power of the model as measured by Wilks’ lambda fails to meet the criterion to stay, then that variable is removed. Otherwise, the variable not in the model that contributes most to the discriminatory power of the model is entered. When all variables in the model meet the criterion to stay and none of the other variables meet the criterion to enter, the stepwise selection process stops.
Using the components selected by the stepwise procedure, discriminant functions were built to classify each individual as either a member of the AD or Control group with associated posterior probability of group membership based on Bayesian posterior distributions (Ingelfinger, Mosteller, Thibodeau, & Ware, 1983). We validated the accuracy of these classifications against clinical assessment.
All multivariate analyses were computed with SAS 9.1.3 (SAS Institute Inc., 2002). The primary procedures were the FACTOR, STEPDISC, and DISCRIM procedures. These have also been applied to brain Event-Related Potentials used to study AD (Chapman et al., 2007).
Traditional Methods of Neuropsychological Assessment
To provide further validation of the novel value found in our PCA and discriminant function, we compared our multivariate results to classification outcomes derived from a traditional method. We arranged our tests (Table 2) into the eight cognitive domains suggested by the NINCDS-ADRDA criteria (McKhann et al., 1984): memory, language, perception, attention, praxis, visuospatial orientation, problem-solving, and daily functioning. We evaluated the traditional method in two ways. First for the Traditional-Many method, we arranged as many of our tests as possible into the eight domains to increase the likelihood of obtaining true positives. We did this as follows: memory = WMS-R Logical Memory I, Logical Memory II, Hopkins Verbal Learning Test (HVLT) Delayed Recall Score; language = Boston Naming Test, Controlled Oral Word Association; perception = Rey-Osterrieth Complex Figure Copy Task, Clock Face Drawing Test; attention = WMS-III Digit Span, Stroop Test, or Trail Making Test – Trail A; praxis = Rey-Osterrieth Complex Figure Copy Task; visuospatial orientation = Standardized Road-Map Test of Direction; problem-solving = Clock Face Drawing Test, Trail Making Test – Trail B; daily functioning = Blessed Dementia Scale. Although our battery contained many measures of memory, only the Logical Memory I and II and the HVLT Delayed Recall scores were chosen for the memory domain. These tests had the greatest discriminability in a stepwise discriminant procedure performed on the raw test measures, and including just these provided the Traditional-Many method the best chance to differentiate between the AD and Control groups without vastly increasing the number of false positives. Another reason for their inclusion in the traditional method is that delayed recall episodic memory and list tests are commonly used in the clinical assessment of AD. Impairment (<5th percentile) on any one of the tests in each domain equated to impairment in that domain, and impairment in two or more domains (Loewenstein et al., 2001; McKhann et al., 1984) was classified as AD in this traditional method.
Our second method, the Traditional-Single method, allowed only one test to contribute to each domain, which would increase the likelihood of obtaining true negatives to boost specificity. We arranged the tests in the following manner: memory = WMS-R Logical Memory II; language = Controlled Oral Word Association; perception = Rey-Osterrieth Complex Figure Copy Task; attention = WMS-III Digit Span; praxis = Rey-Osterrieth Complex Figure Copy Task; visuospatial orientation = Standardized Road-Map Test of Direction; problem-solving = Trail Making Test – Trail B; daily functioning = Blessed Dementia Scale. Again, impairment in two or more domains was classified as AD.
Our use of the traditional methodology was limited to neuropsychological testing, whereas clinical evaluations include more information (such as imaging, medical history, etc.) and subjective observations. The same set of neuropsychological test data on the same subjects was used in our comparison of the traditional and multivariate methods for analyzing neuropsychological test results in AD. The subjects used in this comparison combined the development and new subjects validation sets, resulting in 133 total subjects (55 AD individuals and 78 Control individuals).
Results
Group Means of Test Measures
The neuropsychological test score mean and standard deviation for each of the test measures are presented for the AD and Control groups in Table 3 (the raw scores and standard z scores are both presented). The standard z scores for each test measure were used in all statistical analyses. For nearly all of the 49 measures, a one-way analysis of variance (ANOVA) produced a significant group effect, and every significant effect was at p<.001 (df 1, 132) except for the WMS-III Digit Span Forward Score, which was p<.05). Five measures were not significant (the Geriatric Depression Scale, the Blessed Dementia Scale, the Standardized Road-Map Test of Direction, and the Rey-Osterrieth Complex Figure Immediate Recall and Delayed Recall Speeds). The differences between the groups are more likely attributed to disease effects than demographic dissimilarities since the AD and Control groups were well-matched in age, gender, and education (Table 1). Between the groups the age differences were approximately two years (AD mean (SD) age 76.4 (6.0); Control mean age 74.0 (6.2)) and the education differences were roughly two years with comparable deviations (AD mean (SD) education 14.4 (2.5); Control mean education 15.9 (3.0)). These small average differences are unlikely to exert much influence on the results. While education was significantly different between the AD and Control groups (p<.05), the ages of the AD and Control groups were not significantly different. Additionally, the effects of age and education were removed from our data before the PCA in all the cases where age and education corrected normative data were available.
Table 3.
AD and Control group means (SDs) for each of the 49 neuropsychological test measures
| Group | ||||
|---|---|---|---|---|
| Raw | Standard (z Scores) | |||
| Test Measure | AD | CONTROL | AD | CONTROL |
| Rey-Osterrieth Complex Figure (Rey) | ||||
| Copy Score | 24.9(10.6) | 31.9(4.0) | −1.8(2.8) | −0.2(1.1) |
| Copy Speed† | 0.3(0.2)* | 0.5(0.2)* | −0.7(0.6) | −0.1(0.8) |
| Immediate Recall Score | 5.1(4.6) | 15.4(6.8) | −1.5(1.2) | 0.7(1.4) |
| Immediate Recall Speed† | 1.3(1.4)* | 0.8(0.8)* | 0.6(2.1) | −0.1(1.1) |
| Delayed Recall Score | 3.6(4.5) | 14.6(6.3) | −1.8(1.3) | 0.6(1.3) |
| Delayed Recall Speed† | 2.9(1.4)* | 1.2(1.1)* | 1.9(6.1) | 0.1(1.3) |
| Mini-Mental State Examination (MMSE) | ||||
| Total Score | 24.1(4.5) | 28.5(1.5) | −2.4(3.3) | 0.4(1.2) |
| WMS-III Digit Span | ||||
| Forward Score | 5.7(1.0) | 6.5(1.4) | −0.2(0.8) | 0.3(1.1) |
| Backward Score | 3.9(1.1) | 5.5(1.4) | −0.3(1.0) | 0.9(1.1) |
| Letter-Number Score | 3.4(1.2) | 5.3(1.3) | −1.6(0.6) | −1.1(0.6) |
| Geriatric Depression Scale (GDS) | ||||
| Score | 5.8(4.9) | 4.9(4.4) | −0.9(1.7) | −0.7(1.4) |
| WMS-R Logical Memory I (LM-R I) | ||||
| A Recall Score† | 6.3(3.6) | 13.9(4.0) | −2.2(0.9) | −0.3(1.0) |
| B1 Recall Score† | 5.0(3.3) | 11.8(3.9) | −2.1(1.0) | −0.2(1.1) |
| B2 Recall Score† | 7.2(3.5) | 15.7(4.1) | −2.5(0.9) | −0.3(1.1) |
| WMS-R Logical Memory II (LMR II) | ||||
| A Recall Score† | 2.5(3.5) | 12.2(4.1) | −2.4(0.8) | −0.2(0.9) |
| B Recall Score† | 3.4(3.7) | 13.8(3.6) | −2.8(0.9) | −0.3(0.9) |
| Recognition Score† | 18.0(5.9) | 26.8(1.9) | −4.3(2.8) | −0.3(0.9) |
| Percent Retention† | 36.1(36.6) | 88.9(11.6) | −3.9(2.8) | 0.0(0.9) |
| Clock Face Drawing | ||||
| Score | 17.5(2.8) | 19.5(0.8) | −0.4(1.5) | 0.6(0.4) |
| North American National Adult Reading Test (AMNART) | ||||
| Score | 34.2(7.7) | 39.9(8.2) | −1.3(1.0) | −0.6(1.0) |
| Stroop Test | ||||
| Word Score | 76.4(18.0) | 94.6(15.7) | −1.7(1.2) | −0.6(1.2) |
| Color Score | 47.4(13.7) | 63.7(11.4) | −2.1(1.2) | −0.9(1.0) |
| Color-Word Score | 19.4(9.3) | 32.5(8.3) | −1.4(0.9) | −0.4(0.9) |
| Brief Visuospatial Memory Test-Revised (BVMT-R) | ||||
| Trial 1 Score | 1.5(1.0) | 3.2(2.3) | −1.6(0.5) | −0.8(1.1) |
| Trial 2 Score | 1.9(1.4) | 6.0(2.6) | −0.7(1.2) | 0.7(1.5) |
| Trial 3 Score | 2.3(1.9) | 7.7(3.0) | −2.7(0.9) | −0.4(1.3) |
| Learning Slope | 1.0(1.3) | 4.6(2.2) | −1.5(0.7) | 0.4(1.2) |
| Delayed Recall | 1.6(2.0) | 7.9(3.1) | −2.6(0.9) | 0.0(1.3) |
| Percent Retention | 47.8(54.1) | 100.0(17.8) | −3.0(4.0) | 0.9(1.2) |
| Hits | 5.0(1.1) | 5.9(0.4) | −1.1(1.8) | 0.2(0.9) |
| False Alarms | 1.5(1.4) | 0.2(0.5) | 3.7(4.0) | 0.1(1.5) |
| Discrimination Index | 3.4(1.7) | 5.7(0.7) | −2.9(2.4) | 0.1(1.0) |
| Controlled Oral Word Association Test (COWAT) | ||||
| F Score† | 9.4(4.2) | 12.7(4.5) | −1.0(0.9) | −0.3(1.0) |
| A Score† | 8.2(3.7) | 12.3(4.3) | −1.1(0.8) | −0.1(1.0) |
| S Score† | 9.9(4.0) | 14.6(4.9) | −1.1(0.8) | −0.2(1.0) |
| Category Fluency | ||||
| Animal-Naming Score | 11.7(4.6) | 19.2(5.5) | −1.3(1.1) | 0.4(1.3) |
| Blessed Dementia Scale (BDS) | ||||
| Score† | 1.2(1.3) | 0.7(1.2) | −0.6(1.2) | −0.1(1.1) |
| Hopkins Verbal Learning Test (HVLT) | ||||
| Trial 1 Score | 4.3(2.4) | 7.2(1.9) | −0.9(1.3) | 0.6(1.0) |
| Trial 2 Score | 5.5(2.2) | 9.7(1.7) | −1.3(1.1) | 0.6(0.8) |
| Trial 3 Score | 5.7(1.9) | 10.7(1.6) | −1.8(1.0) | 0.7(0.8) |
| Delayed Recall Score | 1.1(2.4) | 9.7(2.5) | −2.7(1.0) | 0.5(0.9) |
| True Positives | 9.6(2.2) | 11.8(0.5) | −1.4(1.8) | 0.4(0.4) |
| Related False Positives | 2.9(1.4) | 0.6(0.8) | 2.0(1.4) | −0.2(0.8) |
| Unrelated False Positives | 1.6(1.5) | 0.0(0.2) | 4.9(5.1) | −0.2(0.6) |
| Discrimination Index | 5.2(3.1) | 11.0(1.3) | −3.1(1.9) | 0.4(0.7) |
| Boston Naming Test (BNT) | ||||
| Score | 13.5(1.9) | 14.8(0.5) | −1.6(2.6) | 0.3(0.7) |
| Standardized Road-Map Test of Direction (Road-Map) | ||||
| Score | 25.8(4.9) | 27.5(6.3) | −0.9(1.4) | −0.5(1.8) |
| Trail Making Test (TMT) | ||||
| A Speed† | 2.0(1.0)* | 3.0(1.0)* | −1.0(0.8) | −0.2(0.7) |
| B Speed† | 0.6(0.3)* | 1.3(0.5)* | −1.3(0.5) | −0.2(0.7) |
Note. Values shown as mean raw or mean z scores (SD). The standardized neuropsychological scores for each subject for these 49 variables were used in the PCA analyses. For a main group (55 AD, 78 Control) effect, the F value in an ANOVA reached the .05 significance level for all measures except the Rey-Osterrieth Complex Figure Immediate Recall and Delayed Recall Speed scores, the Geriatric Depression Scale score, the Blessed Dementia Scale score, and Standardized Road-Map Test of Direction score. The correlated variables (e.g., total scores) were not used in our analyses.
z scores (mean = 0, SD = 1) for these test measures were generated from laboratory data (normal elderly) since published corrected normative data were not available.
Mean speed score and SD are sec−1 multiplied by 100.
Unsurprisingly, the Control group performed better on each test and its parts than the AD group did. The Control group’s test scores generally hovered around 0, the mean for a standard z distribution, while the AD group consistently performed at levels below the mean. Further, the AD group scored higher on measures where they would be expected to do so, such as failure to discern items not previously presented in a recognition task (recognition false positives and false alarms). The mean MMSE scores were appropriate for each diagnostic group.
There is some debate about the North American National Adult Reading Test (AMNART) and its utility in determining premorbid verbal IQ. Schlosser and Ivison (1989) reported that the test shows some sensitivity to early language impairment in AD. In our results, removing the AMNART from the PCA only adjusted the order the components appeared in the solution but left the components themselves untouched. Therefore, the test was included in the final component solution.
Neuropsychological Components Measured by PCA
The group of 216 AD, MCI, AAMI, and Control individuals, each with 49 test measures, was submitted to PCA with Varimax rotation. Using mainly Kaiser’s (Eigenvalue > 1) criterion (Kaiser, 1960) as a guideline, we retained 13 distinct, orthogonal, and interpretable components in the component structure. These 13 components accounted for 77% of the total variance of the data. PCA produced both component loadings and component scores. The component loadings (the general underlying structure of the neuropsychological test results) are shown in Table 4. The component scores for the AD and Control individuals were retained for discriminant analysis.
Table 4.
Component loadings for the 216-subject, 13-component PCA solution
| Neuropsychological Component | |||||||||||||
|---|---|---|---|---|---|---|---|---|---|---|---|---|---|
| Test Measure | 1 | 2 | 3 | 4 | 5 | 6 | 7 | 8 | 9 | 10 | 11 | 12 | 13 |
| Rey-Osterrieth Complex Figure (Rey) | |||||||||||||
| Copy Score | 7 | 16 | −3 | −2 | 29 | 7 | 25 | 72 | −5 | 2 | −11 | 12 | 7 |
| Copy Speed† | 26 | 40 | 11 | −5 | −4 | 3 | 36 | 9 | 24 | 7 | 35 | −6 | −12 |
| Immediate Recall Score | 43 | 9 | 11 | −12 | 12 | 15 | 75 | 18 | 12 | 4 | −14 | 5 | 10 |
| Immediate Recall Speed† | −17 | 14 | −6 | 4 | −3 | −17 | −10 | 2 | 6 | 3 | 75 | −13 | −13 |
| Delayed Recall Score | 45 | 8 | 9 | −10 | 8 | 17 | 76 | 19 | 6 | 1 | −13 | 6 | 9 |
| Delayed Recall Speed† | −16 | −4 | −2 | 1 | −1 | 7 | −4 | −8 | −10 | 2 | 76 | 13 | 15 |
| Mini-Mental State Examination (MMSE) | |||||||||||||
| Total Score | 44 | 7 | 14 | −29 | 24 | −2 | 12 | 33 | 7 | 8 | −19 | −11 | 1 |
| WMS-III Digit Span | |||||||||||||
| Forward Score | 10 | 36 | 24 | −3 | 68 | 15 | −2 | 0 | 8 | −4 | −7 | −1 | −6 |
| Backward Score | 22 | 30 | 19 | −24 | 57 | 5 | −4 | 11 | 11 | 6 | −4 | −17 | 11 |
| Letter-Number Score | 20 | 3 | 25 | −5 | 75 | 5 | 24 | 17 | −10 | 12 | 6 | 7 | 0 |
| Geriatric Depression Scale (GDS) | |||||||||||||
| Score | −8 | 1 | 1 | −7 | 11 | 14 | 8 | −5 | 17 | 77 | 8 | −9 | 15 |
| WMS-R Logical Memory I (LM-R I) | |||||||||||||
| A Recall Score† | 77 | 22 | 18 | −16 | 12 | 2 | 3 | 7 | 21 | −3 | −8 | 12 | 1 |
| B1 Recall Score† | 77 | 18 | 17 | −9 | 13 | 1 | 9 | 1 | 19 | −4 | −4 | 18 | 3 |
| B2 Recall Score† | 80 | 24 | 20 | −9 | 11 | 7 | 9 | 9 | 18 | −2 | −4 | 13 | 6 |
| WMS-R Logical Memory II (LM-R II) | |||||||||||||
| A Recall Score† | 82 | 15 | 15 | −12 | 9 | 10 | 17 | −1 | 25 | −5 | −6 | 4 | −1 |
| B Recall Score† | 83 | 18 | 20 | −12 | 7 | 15 | 18 | 1 | 18 | −11 | −5 | 3 | 3 |
| Recognition Score† | 80 | 5 | 7 | −23 | 5 | 14 | 4 | 12 | 15 | 4 | 5 | 16 | −8 |
| Percent Retention† | 74 | 0 | 9 | −16 | 4 | 29 | 22 | 0 | 9 | −13 | −12 | −10 | −3 |
| Clock Face Drawing | |||||||||||||
| Score | 24 | 20 | 9 | −10 | 0 | 4 | 5 | 77 | 11 | −5 | 6 | 4 | 5 |
| North American National Adult Reading Test (AMNART) | |||||||||||||
| Score | 31 | −2 | 52 | 4 | 39 | −13 | −20 | 5 | 28 | −2 | −6 | 10 | 8 |
| Stroop Test | |||||||||||||
| Word Score | 15 | 75 | 17 | −9 | 34 | 8 | −16 | 8 | −4 | 6 | −1 | 1 | 0 |
| Color Score | 20 | 85 | 15 | −9 | 14 | 15 | −1 | 10 | 1 | 1 | 1 | 8 | −2 |
| Color-Word Score | 28 | 72 | 13 | −9 | 18 | 11 | 16 | 13 | −6 | 4 | 5 | 16 | 12 |
| Brief Visuospatial Memory Test-Revised (BVMT-R) | |||||||||||||
| Trial 1 Score | 40 | 40 | −5 | −13 | 8 | 1 | 18 | 1 | 58 | 16 | −7 | 0 | 6 |
| Trial 2 Score | 30 | 9 | −9 | −8 | 40 | 24 | 34 | 13 | 39 | 26 | −4 | 17 | 6 |
| Trial 3 Score | 60 | 32 | 11 | −12 | 3 | 32 | 18 | 16 | 37 | 6 | −9 | 28 | 8 |
| Learning Slope | 52 | 12 | 20 | −6 | −3 | 39 | 6 | 20 | 6 | −4 | −6 | 40 | 5 |
| Delayed Recall | 65 | 31 | 12 | −13 | −2 | 35 | 18 | 17 | 35 | 11 | −9 | 15 | 6 |
| Percent Retention | 54 | 14 | 7 | −8 | −7 | 35 | 7 | 36 | 4 | 16 | −9 | −13 | 2 |
| Hits | 29 | 14 | −11 | 4 | 10 | 80 | 13 | 1 | −3 | 5 | −3 | −7 | −3 |
| False Alarms | −25 | −19 | −14 | 74 | −6 | −10 | 7 | −12 | −22 | −4 | −7 | −19 | −6 |
| Discrimination Index | 29 | 11 | 4 | −34 | 14 | 74 | 9 | 10 | 8 | 8 | −4 | 2 | −6 |
| Controlled Oral Word Association Test (COWAT) | |||||||||||||
| F Score† | 19 | 24 | 82 | −5 | 12 | 1 | 5 | −2 | −2 | 7 | −10 | 0 | 1 |
| A Score† | 15 | 13 | 84 | −14 | 16 | 3 | 5 | 5 | 4 | 4 | −7 | 3 | 2 |
| S Score† | 19 | 14 | 85 | −13 | 13 | −1 | 9 | 5 | −7 | 5 | 1 | 1 | 0 |
| Category Fluency | |||||||||||||
| Animal-Naming Score | 44 | 42 | 42 | −14 | −5 | −4 | 11 | 5 | 7 | 17 | 6 | 14 | −5 |
| Blessed Dementia Scale (BDS) | |||||||||||||
| Score† | 17 | 16 | 18 | 5 | 0 | −3 | −4 | 6 | −7 | 77 | −1 | 17 | −16 |
| Hopkins Verbal Learning Test (HVLT) | |||||||||||||
| Trial 1 Score | 69 | 27 | 12 | −4 | 26 | −1 | 7 | 2 | −22 | 10 | −2 | 12 | 16 |
| Trial 2 Score | 69 | 29 | 12 | −19 | 25 | 11 | 17 | 7 | −14 | 10 | −3 | 17 | 8 |
| Trial 3 Score | 75 | 33 | 17 | −17 | 11 | 4 | 12 | 15 | −12 | 9 | −7 | 14 | 8 |
| Delayed Recall Score | 74 | 21 | 13 | −22 | 15 | 19 | 18 | 5 | −13 | 13 | −7 | 3 | 3 |
| True Positives | 70 | 1 | −6 | 9 | 3 | 8 | −5 | 37 | −10 | 23 | −5 | −17 | 3 |
| Related False Positives | −49 | −15 | −13 | 65 | −7 | −10 | −18 | 7 | 3 | −3 | 10 | 4 | 1 |
| Unrelated False Positives | −37 | −8 | −16 | 74 | −10 | −8 | −14 | −7 | 4 | 6 | 3 | −17 | 0 |
| Discrimination Index | 75 | 9 | 6 | −46 | 7 | 9 | 9 | 19 | −5 | 14 | −10 | −9 | −2 |
| Boston Naming Test (BNT) | |||||||||||||
| Score | 32 | 15 | 4 | −25 | −1 | −9 | 6 | 7 | 3 | 9 | 3 | 66 | −8 |
| Standardized Road-Map Test of Direction (Road-Map) | |||||||||||||
| Score | 11 | 2 | 2 | −3 | 2 | −5 | 8 | 9 | 3 | 1 | 2 | −4 | 94 |
| Trail Making Test (TMT) | |||||||||||||
| A Speed† | 31 | 68 | 10 | −11 | −9 | 3 | 17 | 16 | 34 | 6 | 8 | −4 | −5 |
| B Speed† | 40 | 60 | 25 | −8 | 10 | 2 | 20 | 12 | 35 | 6 | 6 | 2 | 0 |
Note. Loadings are multiplied by 100. Red indicates values above an arbitrary threshold of 43 that was selected to highlight more salient loadings. This analysis included 55 early-stage AD, 78 MCI, 78 Controls, and 5 AAMI. The table reflects the PCA Varimax rotated component pattern. The 13 components explained 77% of the total variance.
z scores for these test measures were generated from laboratory data (normal elderly) since published age/education corrected normative data were not available.
Discriminant Analyses
The discrimination group (consisting of 133 ADs and Controls) was divided into development and validation groups. The development group contained 40 ADs and 40 Controls. The validation group contained 15 ADs and 38 Controls, and these subjects did not contribute to the creation of the discriminant function. This was done to produce a rigorous test of the generalizability of the function.
The discriminant function (Table 5) was created with the seven neuropsychological components chosen by the stepwise discriminant procedure and was used to classify each of the 80 AD and Control individuals as either an AD or a Control. It was applied to the data used to develop it with excellent results: 77 of the 80 individuals (96%) were correctly classified, and this result was statistically significant (Fisher’s Exact Test, χ2 (1, N = 80) = 68.83, p<.001).
Table 5.
Linear discriminant function coefficients for determining the probability of AD and Control group membership
| Variable | AD | CONTROL |
|---|---|---|
| Constant | −2.42 | −1.05 |
| Episodic memory (Component 1) | −3.63 | 2.37 |
| Generative fluency (Component 3) | −1.47 | 0.67 |
| Recognition memory – false positives (Component 4) | 1.28 | −0.72 |
| Speeded executive function (Component 2) | −1.30 | 0.64 |
| Recognition memory – true positives (Component 6) | −0.80 | 0.92 |
| Visuospatial episodic memory (Component 7) | −0.55 | 0.58 |
| Visuospatial learning (Component 9) | −0.50 | 0.33 |
Note. The discriminant coefficients shown are for the seven neuropsychological components selected by the stepwise discriminant procedure. The components are shown in the order they were selected.
In addition to the classification of each subject, a quantitative estimate of the posterior probability of that classification was also given by the discriminant function. The posterior probability of AD group membership is conditioned on the subject’s performance on the neuropsychological tests as expressed in the component scores. If this probability was more than 0.5, the individual was classified as an AD, whereas if the probability was less than 0.5, the individual was classified as a Control. The posterior probabilities in Figure 2A are from the cross-validation analysis described next (those from the other discriminant analyses are not shown).
Figure 2.

Discrimination results for the cross-validation and new subjects validation. A. Subjects are ordered according to their posterior probabilities of group membership by our discriminant function in the cross-validation. Clinically diagnosed AD subjects appear with decreasing probability of belonging to the AD group; those who lie above the 0.5 probability line are correctly classified by our test diagnosis as AD. ADs are misclassified as Controls if they fall below this line. Controls lying below the line are correctly classified by the test diagnosis as members of the Control group, and Controls lying above the line are incorrectly classified as AD. Control subjects are ordered by increasing probability of AD group membership.
B–C. A positive test diagnosis (T+) reflects AD group classification. A negative test diagnosis (T−) reflects Control group classification. Sensitivities are calculated as the number of true positives (T+ and AD) divided by the sum of true positives and false negatives (T− and AD). Specificities are calculated as the number of true negatives (T− and Control) divided by the sum of true negatives and false positives (T+ and Control). 203×198mm (300 × 300 DPI)
The accuracy of classifications in the development set is quite high. However, given enough variables for a sample size, it is possible that chance can positively influence results. Discriminant analyses may be left at the development stage, but to confirm the strength of our findings two validation procedures were completed: a cross-validation and the new subjects validation.
A cross-validation (commonly called one-left-out) builds a unique discriminant function for each individual without using his or her data. This function is then applied to that subject, and this procedure is done for each subject in the set. Because the subject being classified does not contribute to the function, this method achieves a “nearly unbiased estimate” (Lachenbruch, 1975). Of the 80 individuals, 76 were correctly classified by their test diagnosis in the cross-validation as either AD or Control (Figure 2B). This is a 95% rate of success (statistically significant by Fisher’s Exact Test, χ2 (1, N = 80) = 64.96, p<.001).
Additionally, we performed a new subjects validation where the discriminant function from the development data was applied to entirely novel individuals. Again, the discriminant function performed very well, showing 50 out of 53 individuals correctly classified by their test diagnoses. This is a 94% rate of success (statistically significant by Fisher’s Exact Test, χ2 (1, N = 53) = 39.07, p<.001) (Figure 2C).
Diagnostic Results with the Traditional Method Compared with our Multivariate Method
We applied the traditional method of neuropsychological assessment (specified in the Methods) to every subject in our discriminant analyses (both the development and new subjects validation sets). The traditional methodology using multiple tests per domain (Traditional-Many) produced only 74% accuracy (99 of 133 individuals correctly classified, which was statistically significant by Fisher’s Exact Test, χ2 (1, N = 133) = 34.49, p<.001)). The traditional methodology using a single test per domain (Traditional-Single) produced a slightly better 78% accuracy (104 of 133 individuals correctly classified, which was statistically significant by Fisher’s Exact Test, χ2 (1, N = 133) = 40.91, p<.001)). Since the MMSE is so often used in the diagnosis of AD, we also computed a discriminant analysis that used only the MMSE score and obtained an overall accuracy of 75% (100 of 133 individuals correctly classified). In contrast, our multivariate method (based on the combination of the cross-validation and new subjects validation results) obtained 95% accuracy (126 of 133 individuals correctly classified, which was statistically significant by Fisher’s Exact Test, χ2 (1, N = 133) = 105.72, p<.001)) (Figure 3). The multivariate method produced significantly higher accuracy than the Traditional-Single method (Fisher’s Exact Test, χ2 (1, N = 266) = 15.55, p<.001) and the Traditional-Many method (Fisher’s Exact Test, χ2 (1, N = 266) = 21.02, p<.001).
Figure 3.

Comparison of the diagnostic power of traditional methods of neuropsychological assessment with a multivariate method. The traditional method was based upon the NINCDSADRDA criteria (McKhann et al., 1984). The same subjects (55 ADs and 78 Controls) and neuropsychological test results were used in this comparison. The multivariate method produced a 17% and 21% increase in accuracy, a 7% and 15% increase in sensitivity, and an 18% and 29% increase in specificity over the Traditional-Single and Traditional-Many methods, respectively.
203×153mm (300 × 300 DPI)
Discussion
The multivariate diagnostic method described here achieved excellent accuracy, sensitivity, and specificity by combining neuropsychological test results in a weighted manner that was dictated by the data rather than an arbitrary combination. This weighting was done through two sequential multivariate methods: (1) PCA, which combined the neuropsychological test measures into component scores that represented a person’s performance more parsimoniously and with greater interpretability, and then (2) discriminant analysis, which selected and weighted the component scores with the greatest power to differentiate AD from normal aging (Figure 1). We have confirmed that the neuropsychological tests are sensitive to group differences between early-stage AD and normal aging (Table 3). Here we have proceeded to formalize their diagnostic use at the individual level through our multivariate methodology and to improve traditional methods of clinical AD assessment through neuropsychological testing. First, the multivariate methodology and its outcomes will be discussed. Then, we will compare our multivariate results with the diagnostic results reached by traditional methodology.
Multivariate Method of Neuropsychological Assessment of AD
The discriminant function was developed from 80 AD and Control individuals, and it performed extremely well at classifying the participants whose neuropsychological component scores measured by PCA were used in its creation. However, it is the two validations that are of special interest. In the cross-validation, a single individual was omitted from the development of the discriminant function. The function was then applied to classify that individual, and this procedure was done for every participant. This analysis yielded high classification accuracy (95%). Additionally, the discriminant analysis provided the posterior probability of group membership for each individual. These are plotted in Figure 2A. This shows that not only were the vast majority of AD subjects correctly classified by their test diagnoses, they also had extremely high probabilities of belonging to the correct group. Likewise, most of the Control subjects had extremely low probabilities of belonging to the AD group and hence high probabilities of Control group membership. No subject lay in a neutral range near the 0.5 probability line.
The one Control subject misclassified as AD in the cross-validation is of particular interest, since this person was diagnosed with MCI approximately three months after completing this research protocol. In this case, our test diagnosis correctly detected that this subject was exhibiting impaired cognition.
Our diagnostic test method produced extremely good results with high accuracy in the development (96%), the cross-validation (95%), and the new subjects validation (94%). Additionally, both the cross-validation and new subjects validation had strong sensitivities (.93 and .87). The specificities for both analyses were also very good (.98 for the cross-validation and .97 for the new subjects validation). This suggests our multivariate method performed very well at both detecting the disease and differentiating between affected and unaffected individuals.
The new subjects validation tested the discriminant function with entirely novel individuals and again yielded excellent results. These 53 AD and Control subjects were not used to create the discriminant function. Although they did participate in the PCA that created the component solution, this was not a necessity. We included as many subjects as possible in the PCA to produce a stable and generalizable component structure. We computed the PCA using a relatively diverse set of individuals, including normal controls, MCI, and AD. All were entered into this PCA as a single set that we would not characterize as a relatively homogenous diagnostic group. A single component structure was produced for the entire set. Thus, we would expect these results to hold for subjects not part of the original PCA and who have different etiological conditions, at least within the range of conditions used (controls to AD). The raw neuropsychological test results of a new individual can be transformed into component scores using the previously developed component structure. Once developed, the component structure and discriminant function can be used repeatedly to diagnose any number of new patients. This methodology is depicted in the right column of Figure 1. Neuropsychologists and physicians could transform a new patient’s raw scores to component scores using the component structure. Having the patient’s scores in terms of the component metric will allow the examiner to judge performance on the interpretable component and thus more directly relate a test measure to its constituent cognitive processes. Equally important is the ability to apply the previously developed discriminant function to this new individual and determine the likelihood of group membership, either as an AD or a Control. Should the patient lie between these two groups, they may possibly be showing symptoms of MCI (as seen in the one Control misclassified as AD in the cross-validation), and an examination of where the patient’s component scores lie on each of the components could help elucidate his or her specific deficits.
This report sequentially combined both PCA and discriminant analyses in a methodology that used ubiquitous neuropsychological tests to diagnose AD. Our diagnostic method benefited from several advantages. First, the use of PCA reorganizes a large amount of data into a more parsimonious set of component scores. Because each PCA component “groups” together correlated test measures (and thus those test measures most likely to represent the same cognitive functions), the component scores more directly gauge a person’s performance with regard to those cognitive functions. Second, because the component structure was created from the data of AD, MCI, and Control subjects, it contains the influences of both individual and group differences. The component structure then reflects the cognitive disparities between the AD and Control group as well as the differences among the individuals within the groups. The components become a common language, creating fewer measures that more succinctly and sharply represent individual and group differences. Third, the discriminant function weights the components in terms of their contributions to discriminating AD from Control and then classifies each individual with high accuracy, sensitivity, and specificity. Finally, the posterior probabilities add a quantitative context to each diagnosis that might prove extremely useful. In addition to the binary diagnosis, a measurement of how similar or dissimilar a patient is to the AD group might influence the nature of treatment.
There are some issues with our methods as presented here. First, factor structures have often been created from single groups and then compared (e.g., (Siedlecki et al., 2008)). We developed a common metric for all the clinical groups of interest by using all of their data in the PCA, believing it would be a stronger measurement tool because it reflected both individual and, more importantly for discrimination, group differences. Also, including impaired and normal individuals in the PCA ensures that components best able to differentiate between the groups will appear in the component structure (Chapman et al., 2009). Methodologically, using a variety of groups in the development of the underlying structure would tend to avoid the one-group risk of restricting the range in the test measures and thereby attenuating correlations among variables that can result in falsely low estimates of component loadings (Fabrigar, MacCullum, Wegener, & Stahan, 1999). Another point of interest is that this methodology is only as strong as the test battery used to develop it. The battery should be sufficiently broad and varied in the cognitive domains it measures to produce a strong component structure.
By examining the components selected (Table 5) and the neuropsychological test measure loadings on those components (Table 4), we can determine which neuropsychological tests are particularly potent at discriminating AD from normal aging. Clearly, measures of memory (Component 1), in particular the retrieval and retention of episodic memory (as with the Logical Memory tests), are important. Selected second, generative fluency, but not directly categorical fluency, also showed strong discriminatory power (shown through the salient loadings the Controlled Oral Word Association Test had on Component 3). This suggests the AD patient’s inability to readily access a mental lexicon is a stark impairment when compared to normal elderly. Interestingly, recognition memory (both the ability to discriminate between items previously presented and those that were not (Component 4) and the ability to recognize items encountered earlier (Component 6)) were also selected by the stepwise discriminant procedure. The appearance of Components 4 and 6, with salient loadings on both verbal (HVLT) and visuospatial (BVMT) recognition tests, in the discriminant function suggest that examinations of recognition memory can also be a useful diagnostic tool for AD. Speeded executive function, examined in our battery through the Trail-Making and Stroop Tests (Component 2), was the fourth component selected for discriminating AD and Controls. Finally, measures of visuospatial memory and learning (Components 7 and 9), represented in this battery by the Rey-Osterrieth Complex Figure and Brief Visuospatial Memory Test, aided in identifying AD. These tests (remapped along these simpler and interpretable components) symbolized the batch most able to differentiate between AD and Control in our battery.
The approach to classifying individuals as AD or normal controls that worked well here was based on PCA followed by discriminant analysis. Once acceptable parameters have been developed, it is not necessary to do complete PCA and discriminant analysis (Figure 1, left column) for each new patient. One can simply apply these developed parameters to the neuropsychological measures (Figure 1, middle and right columns) of a novel patient. This would involve using the component loadings developed in the prior PCA to compute the component scores for that individual and then using the coefficients in the developed discriminant functions to compute the posterior probabilities of group membership (Figure 1).
This method would be easiest to do for a new subject if the tests administered are the same as those used in the development of the component structure. However, it might be possible to use different tests if their loadings on the same components could be reasonably estimated. This is an important point, considering different clinics and research centers might wish to employ their own battery of tests. An aid to doing this might be to calibrate the new measures in combination with marker variables that belong to some of the tests we used in this study that have strong loadings. The particular neuropsychological tests at the input of this multivariate method might not alter the discriminant functions, provided those test measures can be appropriately loaded onto the components used in the functions (though the new tests must be somewhat similar in order to represent each component in the structure). This is a possible advantage to having principal components scores used as the input to the discriminant analysis. These ideas require further study.
Additionally, after the component structure has been developed, it may be possible to reduce the number of tests administered and achieve essentially the same results. Not all of the neuropsychological components were selected by the stepwise discriminant procedure. For example, 6 of the 13 components (Components 5, 8, 10, 11, 12, and 13) were not selected by the stepwise discriminant analysis as having as strong contributions to differentiating between AD and Control subjects as the others that were selected. It is possible the tests that are highly associated with these unneeded components (e.g., the Boston Naming Test had a high loading on only Component 12 as shown in Table 4) may not need to be administered as part of the battery during diagnosis of AD given the other tests in this battery. Although these tests may not have contributed to the discrimination of AD from normal elderly, they may hold discriminatory power for differentiating AD from other dementias or disorders. This warrants further research to determine if these tests may be applicable to other diagnostic procedures.
It is interesting to note that the most commonly used measure of global cognitive ability, the MMSE, did not have any loadings above .44 on any component in this analysis (it has a weakly salient loading on Component 1, as compared to loadings on this component for the Logical Memory Tests, for example, which were generally above .80). This may be considered surprising as this measure is commonly used for assessment of cognition in the elderly population and is often considered the lingua franca of clinical assessment of dementia. However, this measure has some limitations including a relatively low ceiling with demented patients often scoring in the normal range. Using only the total MMSE score in a discriminant analysis to classify AD versus Control individuals, we obtained a sensitivity of 0.56, a specificity of 0.88, and an overall accuracy of 75%. In other work, depending on the criterion used to classify a particular score as abnormal, the sensitivities and specificities of the MMSE for dementia ranged from about 56 to 96% (Costa et al., 1996; Heun, Papassotiropoulos, & Jennssen, 1988; McDowell, Kristjansson, Hill, & Hebert, 1997). In addition, the MMSE was designed as a global measure of cognitive function tapping multiple cognitive domains. As such, the composite total score derived from the MMSE may obscure select impairments in specific cognitive domains. This is seen in the MMSE’s scattered, weaker loadings across many of the components.
There may appear to be some circularity in using neuropsychological tests to develop a new multivariate method of diagnosis and then validating that method’s accuracy against clinical assessment which may also use neuropsychological assessment. However, clinical assessment is aided by additional information about the patient, such as family history, imaging and anatomical studies, and clinical impressions which were not included in our multivariate approach. Clinical diagnosis often, but not always, includes formal cognitive testing. In most cases simple screening measures, such as the MMSE, category fluency, or clock face drawing, are the main cognitive tests administered. Our experimental method goes beyond screening measures by providing a comprehensive assessment of multiple cognitive domains in order to fully explore the discrete cognitive dimensions that are associated with less objectively obtained clinical measures. The diagnosis of AD and MCI was made in a specialized clinical setting using standard diagnostic criteria. The tests typically used by the memory-disorders physicians (the MMSE, the category naming test, and the Clock Drawing Test) either did not load strongly on our components (<.45) or belonged to components that were not selected by our stepwise discriminant procedure. This suggests the clinical diagnosis derived from neuropsychological testing and use of family history, other medical information, and clinical impressions is separable from the formal neuropsychological results reported here.
Whatever concerns there may be about possibilities of overlap of neuropsychological data in the clinical diagnoses, the clinical diagnoses we used for comparison for our multivariate method were the same as were used in analyzing the success of the traditional methods. The circularity would thus impact the accuracy of the methodologies equally, and our multivariate method still showed approximately 20% higher success rates than the traditional methods.
While the results shown here are an important first step to improving AD diagnostic procedures through neuropsychological testing, it is limited at this stage to differentiating AD from normal elderly. Further study is necessary to determine if neuropsychological tests combined through this multivariate methodology can discriminate AD from other dementias, memory disorders, and mood disorders. Additionally, examination of individuals of different ethnicities, cultures, and other demographic considerations should be performed using this multivariate methodology; the effects of these variables were not studied in our present analyses. In this paper, we wanted to only focus on early AD because it is the clinical “gold standard” that likely reflects underlying pathology (based on post-mortem studies). Therefore, we wanted to develop discriminant functions to differentiate individuals with early AD from normal elderly with greater success than what may be achieved with traditional combinatory methods. We recognize that extensions of this paper utilizing the component scores of MCI individuals to predict progression to AD may be of greater clinical interest, and we are actively pursuing this work based upon the component structure described and validated herein.
Comparison with Traditional Methodology
Traditional methods of AD assessment with neuropsychological testing typically compare the patient’s scores on each of the tests to normative data. Performances below the 5th percentile (approximately 1.7 standard deviations below the mean of normal performance) are generally accepted as indicating impairment. The NINCDS-ADRDA criteria for cognitive assessment in AD diagnosis (McKhann et al., 1984) state that there must be impairment in two of eight cognitive domains to confirm dementia.
Using individuals in both the cross-validation and new subjects validation sets for assessing the traditional methods, scores that were below the 5th percentile were marked as impaired, and impairment in two domains was considered indicative of AD. We arranged our neuropsychological test battery into the eight cognitive domains in two ways: first, the Traditional-Many method grouped all the tests applicable to each domain, and second, the Traditional-Single method used only one test for each of the eight domains.
The Traditional-Many method produced 74% accuracy (99 of 133 individuals correctly classified), a sensitivity of .84, and a specificity of .68. The Traditional-Single method performed better overall with a 78% accuracy (104 of 133 individuals correctly classified), a sensitivity of .76, and a specificity of .79. Comparing those results of the traditional methods with the new multivariate results reported here that show an overall accuracy of 95%, a sensitivity of .91, and a specificity of .97 (Figure 3), the relative weights applied by the PCA and the discriminant function clearly improved the classification results. The multivariate accuracy was 21% better than the Traditional-Many method and 17% better than the Traditional-Single method. The sensitivity was moderately increased (7% and 15%) and the specificity was greatly increased (18% and 29%) through weighted, quantitative consideration of which components (and thus which tests) better discriminated AD from Control. The weak specificity of the NINCDS-ADRDA criteria has been discussed before (Dubois et al., 2007). However, the issue of how to combine the existing neuropsychological tests in a weighted manner to produce the best diagnostic method was not addressed.
There are inherent statistical difficulties in quantitatively determining “impairment” through measurement of performance on separate tests, and these problems may lead to more false positives and false negatives in diagnosis. The Traditional-Many and Traditional-Single methods provide examples of this issue. In the Traditional-Many method, more tests were used to represent each domain, and while that produced a higher sensitivity, far more Control individuals were incorrectly classified as AD. Conversely, the Traditional-Single method allowed only one test to measure each domain, and this resulted in a better specificity at the expense of misdiagnosing more AD individuals. Performance below the 5th percentile as a marker of impairment is an arbitrary criterion that is applied to each test measure used, whereas the discriminant analysis seeks a criterion that best discriminates between groups and is obtained from multivariate considerations, especially when component scores are its input variables. Once selected, that multivariate criterion is held for all individual subjects, and this produces a considerable increase in diagnostic accuracy, sensitivity, and specificity (Figure 3). Clearly the arrangement and combination of the test measures can greatly impact the diagnostic results.
Therefore, it may be helpful to consider how these neuropsychological measures could be combined in a formal, empirical way. We have shown the sequential partnering of PCA and discriminant analysis produces weighted measures derived from the data that help ameliorate this issue. In conjunction with biomarkers from imaging, genetic, ERP (Chapman et al., 2007), or other promising areas of research, the multivariate method of neuropsychological assessment presented here may both help to improve the definition of AD and increase diagnostic accuracy, sensitivity, and specificity.
Acknowledgments
We thank: the Geriatric Neurology and Psychiatry Clinic, University of Rochester Medical Center, Monroe Community Hospital, the Alzheimer’s Disease Center, especially Paul Coleman, Charles Duffy, and Roger Kurlan, for their strong support of our research; Robert Emerson and William Vaughn for their technical contributions; Rafael Klorman for critical discussions; Susan E. Chapman for help in writing; Courtney Vargas, Dustina Holt, Jonathan DeRight, Cendrine Robinson, Kristen Morie, Anna Fagan, Michael Garber-Barron, Leon Tsao, and Brittany Huber for technical help; and the many voluntary participants in this research. This research was supported by the National Institute of Health grants P30-AG08665, R01-AG018880, and P30-EY01319.
References
- Ahlgren A. Multivariate analysis. Science. 1986;234:530–531. doi: 10.1126/science.234.4776.530. [DOI] [PubMed] [Google Scholar]
- American Psychiatric Association. Diagnostic and Statistical Manual of the Mental Disorders. 4. Washington, DC: Author; 2000. text rev. [Google Scholar]
- Bäckman L, Jones S, Berger AK, Laukka EJ, Small BJ. Cognitive impairment in preclinical Alzheimer’s disease: a meta-analysis. Neuropsychology. 2005;19:520–531. doi: 10.1037/0894-4105.19.4.520. [DOI] [PubMed] [Google Scholar]
- Benedict RHB, Groninger L. Preliminary standardization of a new visuospatial memory tests with six alternate forms. The Clinical Neuropsychologist. 1995;9:11–16. [Google Scholar]
- Benton AL, Hamsher KS. Multilingual Aphasia Examination. Iowa City: University of Iowa; 1976. [Google Scholar]
- Blessed G, Tomlinson BE, Roth M. The association between quantitative measures of dementia and of senile change in cerebral grey matter of elderly subjects. British Journal of Psychiatry. 1968;114:797–811. doi: 10.1192/bjp.114.512.797. [DOI] [PubMed] [Google Scholar]
- Brandt J. The Hopkins Verbal Learning Test: development of a memory test with six equivalent forms. The Clinical Neuropsychologist. 1991;5:125–142. [Google Scholar]
- Carroll JB. Human cognitive abilities: a survey of factor-analytic studies. New York: Cambridge University Press; 1993. [Google Scholar]
- Chapman RM, Mapstone M, McCrary JW, Gardner MN, Bachus LE, DeGrush E, et al. Cognitive Dimensions in Alzheimer’s Disease, Mild Cognitive Impairment, and Normal Elderly. Developing a Common Metric. 2009 doi: 10.2174/1874827901003010001. Manuscript submitted for publication. [DOI] [PMC free article] [PubMed] [Google Scholar]
- Chapman RM, McCrary JW. EP component identification and measurement by principal components analysis. Brain and Cognition. 1995;27:288–310. doi: 10.1006/brcg.1995.1024. [DOI] [PubMed] [Google Scholar]
- Chapman RM, Nowlis GH, McCrary JW, Chapman JA, Sandoval TC, Guillily MD, et al. Brain event-related potentials: Diagnosing early-stage Alzheimer’s disease. Neurobiology of Aging. 2007;28:194–201. doi: 10.1016/j.neurobiolaging.2005.12.008. [DOI] [PMC free article] [PubMed] [Google Scholar]
- Costa PT, Albert MS, Butters NM, Folstein MF, Gilman S, Gurland BJ, et al. Publication No. 97–0703. Rockville, MD: AHCPR; 1996. Early identification of Alzheimer’s disease and related dementias. Clinical Practice Guideline, Quick Reference Guide for Clinicians, No. 19. [PubMed] [Google Scholar]
- Crook TH, Bartus RT, Ferris SH, Whitehouse P, Cohen GD, Gershon S. Age-associated memory impairment: Proposed diagnostic criteria and measures of clinical change - Report of a National Institute of Mental Health work group. Developmental Neuropsychology. 1986;2:261–276. [Google Scholar]
- Dubois B, Feldman HH, Jacova C, DeKosky S, Barberger-Gateau P, Cummings J, et al. Research criteria for the diagnosis of Alzheimer’s disease: revising the NINCDS-ADRDA criteria. Neurology. 2007;6:734–746. doi: 10.1016/S1474-4422(07)70178-3. [DOI] [PubMed] [Google Scholar]
- Fabrigar LR, MacCullum RC, Wegener DT, Stahan EJ. Evaluating the use of exploratory factor analysis in psychological research. Psychological Methods. 1999;4:272–299. [Google Scholar]
- Folstein MF, Folstein SE, McHugh PR. “Mini-mental state”. A practical method for grading the cognitive state of patients for the clinician. Journal of Psychiatric Research. 1975;12(3):189–198. doi: 10.1016/0022-3956(75)90026-6. [DOI] [PubMed] [Google Scholar]
- Golden CJ. Stroop Color and Word Test: a manual for clinical and experimental uses. Chicago: Stoelting; 1978. [Google Scholar]
- Grober E, Sliwinski M. Development and validation of a model for estimating premorbid verbal intelligence in the elderly. Journal of Clinical and Experimental Neuropsychology. 1991;13:933–949. doi: 10.1080/01688639108405109. [DOI] [PubMed] [Google Scholar]
- Guadagnoli E, Velicer WF. Relation of sample size to the stability of component patterns. Psychological Bulletin. 1988;103:265–275. doi: 10.1037/0033-2909.103.2.265. [DOI] [PubMed] [Google Scholar]
- Harman HH. Modern Factor Analysis. Chicago: University of Chicago Press; 1976. [Google Scholar]
- Heun R, Papassotiropoulos A, Jennssen F. The validity of psychometric instruments for detection of dementia in the elderly general population. International Journal of Geriatric Psychiatry. 1988;13(6):368–380. doi: 10.1002/(sici)1099-1166(199806)13:6<368::aid-gps775>3.0.co;2-9. [DOI] [PubMed] [Google Scholar]
- Ingelfinger JA, Mosteller F, Thibodeau LA, Ware JH. Biostatistics in Clinical Medicine. New York: Macmillan Publishing Company; 1983. [Google Scholar]
- John ER, Easton P, Prichep LS, Friedman J. Standardized varimax descriptors of event-related potentials: basic considerations. Brain Topography. 1993;6:143–162. doi: 10.1007/BF01191080. [DOI] [PubMed] [Google Scholar]
- Kaiser HF. The varimax criterion for analytic rotation in factor analysis. Psychometrika. 1958;23(3):187–200. [Google Scholar]
- Kaiser HF. The application of electronic computers to factor analysis. Educational and Psychological Measurement. 1960;20:141–151. [Google Scholar]
- Kaplan EF, Goodglass H, Weintraub S. The Boston Naming Test. Philadelphia: Lea & Febiger; 1978. [Google Scholar]
- Lachenbruch PA. Discriminant Analysis. New York: Hafner Press; 1975. [Google Scholar]
- Loewenstein DA, Ownby RM, Schram L, Acevedo A, Rubert M, Argelles T. An evaluation of the NINCDS-ADRDA Neuropsychological Criteria for the assessment of Alzheimer’s disease: a confirmatory factor analysis of single versus multi-factor models. Journal of Clinical and Experimental Neuropsychology. 2001;23(3):274–284. doi: 10.1076/jcen.23.3.274.1191. [DOI] [PubMed] [Google Scholar]
- Mack WJ, Freed DM, Williams BW, Henderson VW. Boston Naming Test: Shortened versions for use in Alzheimer’s disease. Journal of Gerontology: Psychological Sciences. 1992;47:154–158. doi: 10.1093/geronj/47.3.p154. [DOI] [PubMed] [Google Scholar]
- McDowell I, Kristjansson B, Hill GB, Hebert R. Community screening for dementia: the Mini Mental State Exam (MMSE) and Modified Mini-Mental State Exam (3MS) compared. Journal of Clinical Epidemiology. 1997;50(4):377–383. doi: 10.1016/s0895-4356(97)00060-7. [DOI] [PubMed] [Google Scholar]
- McKhann G, Drachman D, Folstein MF, Katzman R, Price D, Stadlan EM. Clinical diagnosis of Alzheimer’s disease: report of the NINCDS-ADRDA Work Group under the auspices of Department of Health and Human Services Task Force on Alzheimer’s disease. Neurology. 1984;34:939–944. doi: 10.1212/wnl.34.7.939. [DOI] [PubMed] [Google Scholar]
- Money JA. A Standardized Road Map of Directional Sense, Manual. San Rafael: Academic Therapy Publications; 1976. [Google Scholar]
- Morris JC, Heyman A, Mohs RC, Hughes JP, van Belle G, Fillenbaum G, et al. The Consortium to Establish a Registry for Alzheimer’s Disease (CERAD). Part I. Clinical and neuropsychological assessment of Alzheimer’s disease. Neurology. 1989;39(9):1159–1165. doi: 10.1212/wnl.39.9.1159. [DOI] [PubMed] [Google Scholar]
- Osterrieth PA. Le test de copie d’une figure complexe. Archives de Psychologie. 1944;30:206–356. [Google Scholar]
- Petersen RC. Mild cognitive impairment as a diagnostic entity. Journal of Internal Medicine. 2004;256:183–194. doi: 10.1111/j.1365-2796.2004.01388.x. [DOI] [PubMed] [Google Scholar]
- Petersen RC, Smith GE, Waring SC, Ivnik RJ, Tangalos EG, Kokmen E. Mild Cognitive Impairment: Clinical Characterization and Outcome. Archives of Neurology. 1999;56:303–308. doi: 10.1001/archneur.56.3.303. [DOI] [PubMed] [Google Scholar]
- Petersen RC, Stevens JC, Ganguli M, Tangalos EG, Cummings JL, DeKosky ST. Practice parameters: Early detection of dementia: Mild cognitive impairment (an evidence-based review). Report on the Quality Standards Subcommittee of the American Academy of Neurology. Neurology. 2001;56:1133–1142. doi: 10.1212/wnl.56.9.1133. [DOI] [PubMed] [Google Scholar]
- Reitan RM. Validity of the Trail Making test as an indicator of organic brain damage. Perceptual and Motor Skills. 1958;8:271–276. [Google Scholar]
- Rey A. L’examen psychologique dans les cas d’escephalopathie traumatique. Archives de Psychologie. 1941;28:286–340. [Google Scholar]
- SAS Institute Inc. SAS OnlineDoc 9.1.3 2007. 2002 from http://support.sas.com/onlinedoc/913/docMainpage.jsp.
- Schlosser D, Ivison D. Assessing memory deterioration with the Wechsler Memory Scale, the National Adult Reading Test, and Shonell Graded Word Reading Test. Journal of Clinical and Experimental Neuropsychology. 1989;11:785–792. doi: 10.1080/01688638908400935. [DOI] [PubMed] [Google Scholar]
- Siedlecki KL, Honig LS, Stern Y. Exploring the structure of a neuropsychological battery across healthy elders and those with questionable dementia and Alzheimer’s disease. Neuropsychology. 2008;22(3):400–411. doi: 10.1037/0894-4105.22.3.400. [DOI] [PMC free article] [PubMed] [Google Scholar]
- Stern Y, Hesdorffer D, Sano M, Mayeux R. Measurement and prediction of functional capacity in Alzheimer’s disease. Neurology. 1990;40:8–14. doi: 10.1212/wnl.40.1.8. [DOI] [PubMed] [Google Scholar]
- Tuokko H, Hadjistavropoulos T, Miller JA, Beattie BL. The clock test: a sensitive measure to differentiate normal elderly from those with Alzheimer’s disease. Journal of the American Geriatrics Society. 1992;40(579–584) doi: 10.1111/j.1532-5415.1992.tb02106.x. [DOI] [PubMed] [Google Scholar]
- Velicer WF, Jackson DN. Component analysis versus common factor analysis: some issues in selecting an appropriate procedure. Multivariate Behavioral Research. 1990;25(1):1–28. doi: 10.1207/s15327906mbr2501_1. [DOI] [PubMed] [Google Scholar]
- Wechsler D. A standardized memory scale for clinical use. The Journal of Psychology. 1945;19:87–95. [Google Scholar]
- Wechsler D. Wechsler Memory Scale-Revised. San Antonio: The Psychological Corporation; 1987. [Google Scholar]
- Wechsler D. Wechsler Adult Intelligence Scale-III (WAIS-III) manual. New York: The Psychological Corporation; 1997. [Google Scholar]
- Yesevage JA, Brink TL, Rose TL, Lum O, Huang V, Adey M, et al. Development and Validation of a geriatric depression screening scale: A preliminary report. Journal of Psychiatric Research. 1983;17(1):37–49. doi: 10.1016/0022-3956(82)90033-4. [DOI] [PubMed] [Google Scholar]
- Zillmer EA, Fowler PC, Gutnick HN, Becker E. Comparison of two cognitive bedside screening instruments in nursing home residents: a factor analytic study. Journal of Gerontology. 1990;45:69–74. doi: 10.1093/geronj/45.2.p69. [DOI] [PubMed] [Google Scholar]