

Abstract
The pathogenesis of nonalcoholic steatohepatitis (NASH) is not well understood; however, the progression of fatty liver to NASH has been linked to oxidative stress and lipid peroxidation in the liver, leading to inflammation. Although the adiponectin receptor 2 (AdipoR2) has been identified as a modulator of oxidative stress and inflammation in the liver, it remains unclear whether the receptor has hepatic antioxidant and anti-inflammatory effects in NASH. In this study, we used an animal model of NASH to examine hepatic AdipoR2. Obese fa/fa Zucker rats fed a high-fat and high-cholesterol (HFC) diet spontaneously developed fatty liver with inflammation and fibrosis, characteristic of NASH, after 4, 8, or 12 weeks of HFC diet consumption. AdipoR2 expression was significantly decreased, whereas the expression of genes related to NADPH oxidase complex were increased. As a result of the decrease in AdipoR2 expression, the mRNA expression of genes located downstream of AdipoR2, i.e., Cu-Zn superoxide dismutase (Cu-Zn SOD) and Mn-SOD, also decreased. Furthermore, the expression of genes related to inflammation was increased. Increased oxidative stress and inflammation by down-regulation of AdipoR2 may contribute to the progression of NASH. Thus, the AdipoR2 might be a crucially important regulator of hepatic oxidative stress and inflammation in NASH.
Keywords: Nonalcoholic steatohepatitis, adiponectin receptor 2, inflammation, oxidative stress, Zucker rats
Introduction
Nonalcoholic fatty liver disease (NAFLD) is defined as a constellation of clinical conditions characterized predominantly by macrovesicular steatosis of the liver [1]. The histologic spectrum of NAFLD includes fatty liver alone or nonalcoholic steatohepatitis (NASH) [2, 3]. NASH can be associated with progressive hepatic fibrosis and is an important cause of cirrhosis of the liver [4]. The pathogenesis of NASH is not well understood; however, the progression of hepatic steatosis to NASH is attributed to a “second hit” that leads to the development of liver inflammation and fibrosis [5]. Progression of fatty liver to NASH has been linked to oxidative stress and lipid peroxidation in the liver, leading to inflammation [6-8].
Adiponectin, a hormone secreted by adipocytes, acts as an antidiabetic and anti-atherogenic adipocytokine [9]. It can improve hepatic insulin sensitivity, decrease lipid accumulation in liver and skeletal muscle, and has anti-inflammatory effects via NFkB activation [10-12]. Adiponectin has been shown to improve steatosis and inflammation in patients and mice with NAFLD [13, 14]. Musso et al. reported that adiponectin has a hepatoprotective action [15]. The two types of adiponectin receptors (AdipoR1/R2) clearly differ in their signaling pathways. Adi-poR1 is more tightly linked to the activation of the AMP-activated protein kinase (AMPK) pathway and regulates the inhibition of hepatic glucose production (HGP) together with increased fatty acid oxidation, while AdipoR2 is mainly liferator-activated receptor α (PPARα) pathway, which stimulates energy dissipation by increasing fatty acid oxidation, and inhibits inflammation and oxidative stress [16]. Moreover, in mice over-expressing AdipoR2, decreased expression of tumour necrosis factor α (TNFα), monocyte chemoattractant protein-1 (MCP-1), and reduced formation reactive oxidative species (ROS) is observed [12]. However, the role of AdipoR2 in mediating hepatic anti-inflammatory and antioxidants effects in NASH remains unclear.
Little is known about the hepatic expression of genes related to inflammatory and oxidative stress factors in obese animals with NASH. To reveal the role of AdipoR2 in the pathogenesis of NASH, we examined the hepatic expression of inflammatory and oxidative stress factors in animals fed a diet to induce NASH and obese animals fed a control diet.
Materials and methods
Animals and experimental design
Male obese fa/fa Zucker rats were purchased from Japan SLC Inc (Shizuoka, Japan) at 7 weeks of age. After a 1-week acclimation period, all animals were subdivided into groups fed standard chow or a high-fat and -cholesterol (HFC) diet. The standard chow diet, containing 5.9% fat (in the form of soy oil) by weight (control, n = 6), and the HFC diet, containing 25% fat (in the form of lard and beef tallow) and 5% cholesterol by weight (NASH, n = 6) were fed to rats for 4, 8, and 12 weeks. Both diets were purchased from Oriental Yeast (Tokyo, Japan). All rats were housed in an animal facility with controlled temperature and a 12-hour light/dark cycle (light on at 7:00 am and off at 7:00 pm). In addition, the rats fed the control diet had free access to water, and those fed the HFC diet had free access to sodium chloride solution (1%) ad libitum at all times. All experimental procedures were implemented in accordance with the Institutional Guidelines for Animal Experiments at the College of Bioresource Sciences, Nihon University under the permission of the Committee of Experimental Animal in our college.
Tissue preparation, blood sampling, and analysis
Blood sampling was performed at 4, 8, and 12 weeks in rats fasted overnight. Blood samples were collected from the inferior vena cava immediately prior to sacrifice of rats under ether anesthesia. Blood samples were centrifuged at 3000 rpm for 5 min, and then the plasma was collected and stored at -80°C until analysis. After sacrifice, liver weight and intra-abdominal fat (epididymal fat pad, mesenteric fat, and perinephric fat) weight were measured. In addition, liver samples were collected in liquid nitrogen for analysis of antioxidant enzymes, lipid peroxidation, and hepatic triglyceride content, and stored at -80°C until analysis. Additional, liver samples were collected in RNAlater solution (Qiagen, Hilden, Germany) for molecular biologic studies, and stored at-80°C until analysis.
Biochemical analysis
Fasting plasma glucose, total cholesterol, and triglyceride concentrations were measured using commercially available enzyme-linked colorimetric diagnostic kits (DRI-CHEM4000, Fujifilm, Tokyo, Japan), and the plasma free fatty acid (FFA) concentration was measured by an enzyme method using a JCA-BM2250 (JEOL Ltd., Tokyo, Japan). Fasting plasma insulin concentrations were determined using a rat insulin ELISA kit (AKRIN-010H, Shibayagi, Gunma, Japan).
Analysis of antioxidant enzymes, lipid peroxidation, and hepatic triglycerides
Liver homogenates were prepared at a 1:10 (w:v) dilution in 10 mM potassium phosphate buffer, pH 7.4, using a Ultra-Turrax® homogenizer (IKA® Japan, Nara, Japan). Samples were centrifuged at 3000 rpm for 10 min at 4°C, and the supernatants were collected and immediately assayed for enzyme activities. For total glutathione (GSH), ∼50 μg of liver was homogenized in 5% trichloroacetic acid at a ratio of 1:10 (w:v) and centrifuged for 5 min at 8000 rpm and 4°C. Total GSH was measured in the tissues as previously described [17]. Total superoxide dismutase (SOD), catalase, and total GSH peroxidase (Gpx) activities were measured according to the methods of Sun et al. [18], Aebi [19], and Paglia and Valentine [20], respectively. Lipid peroxidation levels were measured by the thiobarbituric acid (TBA) reaction using the method of Ohkawa et al.[21]. For quantification of hepatic triglyceride content, liver tissue was lysed with buffer using a commercially available kit (Wako, Osaka, Japan) and disrupted by sonication. The hepatic triglyceride content of the homogenate were then determined according to the kit manufacturer's instructions.
Liver histopathological examination
Liver tissue samples were fixed overnight in 10% buffered formalin and embedded in paraffin. Sections (5 μm) of liver tissue were stained with hematoxylin and eosin (H&E) and Masson's trichrome. Steatosis, activity (inflammation), and stage (fibrosis) were semiquantitatively evaluated according to the standard criteria for grading and staging NASH, with minor modifications [3]. The degree of steatosis was scored as the percentage of hepatocytes containing lipid droplets. Activity was evaluated as the sum of scores (score 0-6) for acinar inflammation (score 0-3) and portal inflammation (score 0-3). Fibrosis was graded from 0 (absent) to 4 (1, perisinusoidal/pericellular fibrosis; 2, periportal fibrosis; 3, bridging fibrosis; 4, cirrhosis).
RNA extraction and Quantitative Real- time PCR
RNA isolation was performed by homogenization with a Micro Smash-100R™ (Tomy Seiko, Tokyo, Japan) using Isogen (Nippon Gene, Tokyo, Japan) for liver. RNA purification was carried out using RNeasy Mini kits (Qiagen, Hilden, Germany) for all the tissues studied. All samples were treated with DNase I (RNase Free DNase set, Qiagen). The concentrations of total RNA were measured by absorbance at 260 nm using a NanoDrop® ND-1000 (NanoDrop, USA). The purity was estimated by the 260/280 nm absorbance ratio. Total RNA (1 μg) was subjected to reverse transcription using oligo(dT) 12-18 primer and M-MuLV reverse transcriptase (SuperScript™ III First-Strand Synthesis, Invitrogen Life Science, USA) according to the manufacturer's instructions. The transcript levels of specific primers (Table 1) were quantified by real-time PCR (7500 Real Time PCR System, Applied Biosystems, CA, USA). The cDNA was amplified under the following conditions: 95°C for 10 min, followed by 45 cycles of 15 s at 95°Cand 1 min at 59° C, using Power SYBR® Green PCR Master Mix (Applied Biosystems) with each primer at a concentration of 400 nM/L. After PCR, a melting curve analysis was performed to demonstrate the specificity of the PCR product, which was displayed as a single peak (data not shown). All samples were analyzed in triplicate. The relative expression ratio (R) of a target gene was expressed for the sample versus the control in comparison to the 18S rRNA [22]. R was calculated based on the following equation [23]: R = 2-ΔΔCt , where Ct represents the cycle at which the fluorescence signal was significantly from background and ΔΔCt was (Ct, target - Ct, 18s rRNA) treatment - (Ct, target - Ct, 18s rRNA) control.
Table 1.
Primers sequences used for real-time PCR reactions
| Gene | Genebank accession no. | Forward 5' → 3' | Reverse 5' → 3' |
|---|---|---|---|
| AdipoR2 | NM_001037979 | CATGTTTGCCACCCCTCAGTA | ATGCAAGGTAGGGATGATTCCA |
| gp91phox | NM_023965 | CGGAATCTCCTCTCCTTCCT | GCATTCACACACCACTCCAC |
| p22phox | NM_024160 | TGTTGCAGGAGTGCTCATCTGTCT | AGGACAGCCCGGACGTAGTAATTT |
| p47phox | NM_053734 | AGGTTGGGTCCCTGCATCCTATTT | TGGTTACATACGGTTCACCTGCGT |
| Nox4 | NM_053524 | TCATGGATCTTTGCCTGGAGGGTT | AGGTCTGTGGGAAATGAGCTTGGA |
| Cu-Zn SOD | NM_017050 | CTGGACAAACCTCAGCCCTA | TGATGGCTTCCAGCAACTC |
| Mn-SOD | NM_017051 | GACCTGCCTTACGACTATG | TACTTCTCCTCGGTGACG |
| Gpx1 | NM_030826 | GCTGCTCATTGAGAATGTCG | GAATCTCTTCATTCTTGCCATT |
| Catalase | NM_012520 | ATTGCCGTCCGATTCTCC | CCAGTTACCATCTTCAGTGTAG |
| TNF α | NM_012675 | ATACACTGGCCCGAGGCAAC | CCACATCTCGGATCATGCTTTC |
| MCP-1 | NM_031530 | GATCTCTCTTCCTCCACCACTATG | GAATGAGTAGCAGCAGGTGAGT |
| 18s rRNA | M11188 | GTAACCCGTTGAACCCCATT | CCATCCAATCGGTAGTAGCG |
Data analysis
The results are expressed as mean ± standard error of the mean (SEM). Statistical significance was determined by unpaired t-test with a P value of < 0.05.
Results
Effects of high-fat and-cholesterol (HFC) diet on metabolic parameters
The general characteristics of the metabolic profile of the experimental animals are summarized in Table 2. Body weight gain and the final weight of all rats fed the control or HFC diets were measured after 4, 8, and 12 weeks of treatment. The body weight and the weight of daily food intake in the HFC group did not differ from those of the control group at 4, 8, and 12 weeks (Table 2). The liver weight was 2.3-fold higher in HFC rats than in control rats at 4 weeks, 4-fold higher at 8 weeks, and 4.2-fold higher at 12 weeks (Table 2). The fasting plasma glucose, cholesterol, and FFA concentrations were all significantly higher in HFC rats than in control rats, whereas plasma triglyceride concentrations in the HFC rats were significantly lower than those in control rats at 4, 8, and 12 weeks (Table 2). Plasma insulin concentrations did not differ between control and HFC rats at 4, 8, and 12 weeks.
Table 2.
Effects of high-fat and -cholesterol (HFC) treatment on metabolic parameters in HFC diet-induced rats of nonalcoholic steatohepatitis at 4, 8, and 12 weeks of treatment
| Obese (fa/fa) Zucker rats | ||||||
|---|---|---|---|---|---|---|
| 4 weeks | 8 weeks | 12 weeks | ||||
| Diet type | Control | HFC | Control | HFC | Control | HFC |
| Body weight (g) | 398± 8.3 | 397± 4.8 | 566± 17.2 | 525± 25.9 | 622± 11.3 | 648 ± 18.5 |
| Food intake (g/day) | 26.7±5.3 | 24.2 ± 7.3 | 26.3 ±8.8 | 22.8 ±4.8 | 25.4 ± 7.3 | 26.6 ±3.4 |
| Liver weight (g) | 11.8 ± 0.8 | 26.9 ± 1.1* | 12.8 ± 0.3 | 55.2 ± 1.5** | 15.2 ±0.7 | 63.3 ±1.2** |
| Intra-abdominal fat weight (g) | 23.7 ±0.7 | 24.3 ± 1.3 | 40.5 ±3.7 | 38.8 ±4.2 | 45.8 ±2.8 | 44.5 ±3.8 |
| Epididymal fat pad weight (g) | 9.8 ±0.6 | 9.7 ±0.2 | 16.6 ± 1.2 | 16.5 ± 1.4 | 15.4 ± 0.3 | 15.3 ± 0.3 |
| Mesenteric fat weight (g) | 4.7 ±0.8 | 4.8 ±0.7 | 8.2 ±0.4 | 6.1 ±0.2 | 8.6 ±0.2 | 7.1 ± 1.1 |
| Perinephric fat weight (g) | 9.2 ±1.2 | 9.8 ±0.6 | 15.7 ± 1.6 | 16.2 ±3.7 | 21.8 ± 1.7 | 22.1 ±2.7 |
| Plasma glucose (mmol/L) | 6 ±0.3 | 7.7 ±0.1 | 5.6 ±0.3 | 8.2 ±0.5* | 5.8 ±0.2 | 8.3 ±0.4* |
| Plasma insulin (ng/mL) | 11.3 ± 0.2 | 10.4 ± 1.1 | 17.4 ± 0.9 | 15.5 ± 0.5 | 18.3 ± 1.1 | 16.3 ± 0.4 |
| Plasma total cholesterol (mg/dL) | 120 ± 16 | 896 ±52** | 166 ± 15 | 1360 ±74** | 190 ± 10 | 1280 ±103** |
| Plasma triglycerides (mg/dL) | 385 ± 45 | 186 ± 31* | 335 ± 30.3 | 229 ± 13.6 | 587 ± 42 | 254 ±15* |
| Plasma FFAs (mEq/L) | 1.24 ± 0.2 | 3.04 ±0.3* | 1.35 ±0.2 | 1.77 ±0.1** | 1.38 ±0.6 | 1.91 ± 0.2** |
Values are expressed as mean ± SEM (n = 6).
FFAs, free fatty acids.
P < 0.05
**P < 0.01 for HFC diet-induced rats vs control diet-induced rats of same age.
Antioxidant defense activities
The activities of total SOD, catalase, and Gpx were significantly lower in HFC rats than in control rats at 4, 8, and 12 weeks (Table 3). The level of TBARS in HFC rats increased significantly (P < 0.05) compared with control rats at 4, 8, and 12 weeks (Figure 1).
Table 3.
Effects of high-fat and high-cholesterol (HFC) on antioxidant defense enzymes in at 4, 8, and 12 weeks of treatment
| Treatment | GSH | SOD | Catalase | GPx |
|---|---|---|---|---|
| 4 weeks | ||||
| Control | 66 ±12 | 147 ± 23 | 6230 ±524 | 748 ±136 |
| HFC | 50.5 ± 17 | 80 ± 21* | 3793±167* | 497 ± 39* |
| 8 weeks | ||||
| Control | 61 ±5.5 | 96 ±10 | 5956± 278 | 604 ± 52 |
| HFC | 42 ±5 | 54 ± 7.1* | 1381±141** | 356 ±43* |
| 12 weeks | ||||
| Control | 67 ±8 | 116 ± 18 | 6120 ±320 | 670 ± 45 |
| HFC | 38 ±3.8* | 43 ± 4** | 1220± 103** | 330 ±35* |
Values are expressed as mean ± SEM (n = 6).
Levels of glutathione (GSH) was measured and expressed as nmol/mg of protein. The activities of superoxide dismu-tase (SOD), catalase, and glutathione peroxidase (Gpx) are expressed as U/mg of protein.
P < 0.05
P < 0.01 for HFC diet-fed rats vs control diet-fed rats.
Figure 1.

Comparison of lipid peroxidation levels (TBARS) in the liver between rats fed control (control) or high-fat and high-cholesterol (HFC) diet for 4, 8, and 12 weeks. TBAR values (mean ± SEM) are expressed as nmol/mg protein (n = 6). *P < 0.05, **P < 0.01 for HFC vs. group.
Liver histopathology and the hepatic lipid content in HFC rats
Figure 2 depicts the representative time course of histologic changes (Figures 2A and 2B) and scores (Figure 2C) in HFC and control rats at 4, 8, and 12 weeks. The HFC diet caused intense lobular inflammation and perovenular and pericellular fibrosis prominently in zone 3 of the liver at 4, 8, and 12 weeks. Steatosis scores in HFC rats (74.5 ± 8.2 vs. 1.2 ± 0.5 % at 4 weeks, 88.7 ± 3.3 vs. 1.8 ± 1.2 % at 8 weeks, and 92.3 ± 2.2 vs. 3.5 ± 2 % at 12 weeks) and inflammation (3.8 ± 0.75 vs. 0.4 ± 0.12 at 4 weeks, 5.5 ± 0.54 vs. 1.2 ± 0.3 at 8 weeks, and 5.7 ± 0.51 vs. 1.4 ± 0.5 at 12 weeks) were greater than those of control rats (Figures 2A and 2B). In addition, the histological severity of fibrosis was significantly greater in HFC rats at 4, 8, and 12 weeks (Figures 2A and 2B), and the histologic scores for steatosis, inflammation, and fibrosis in HFC rats at 12 weeks were significantly higher than those in HFC rats at 4 and 8 weeks (Figure 2C).
Figure 2.

Liver histopathology in HFC and control rats. Time course of histologic changes in liver samples stained with hematoxylin and eosin (A) and Masson's trichrome (B) at 4 weeks (left column), 8 weeks (middle column), and 12 weeks (right column) in rats fed control diet or high-fat and high-cholesterol (HFC) diet. Original magnification, 100x. Time course of histologic changes in HFC rats are represented by the histologic scores (C) in at 4, 8, and 12 weeks. Criteria for each score are described in Materials and Methods. HFC rats at 4 weeks (white bars, n = 6), at 8 weeks (light gray bars, n = 6), and at 12 weeks (black bars, n = 6). Values are expressed as mean ± SEM. *P < 0.05, **P < 0.01 at 8 and 12 weeks vs 4 weeks.
HFC rats at 4, 8, and 12 weeks showed macrovesicular steatosis in the liver (Figure 2A). The hepatic triglyceride content was measured to evaluate the progression of steatosis quantitatively after 4, 8, and 12 weeks (Figure 3A). Hepatic triglyceride content increased significantly in HFC rats at 4, 8, and 12 weeks (P < 0.05 vs control rats). Plasma ALT levels in HFC rats were higher by about 1.4-fold at 4 weeks, 1.9-fold at 8 weeks, and 3.9-fold at 12 weeks as compared with control rats (Figure 3B). These results reconfirm that the HFC rats met the definitions of NASH. Thus, hereafter, we refer to HFC-fed rats as the NASH group.
Figure 3.
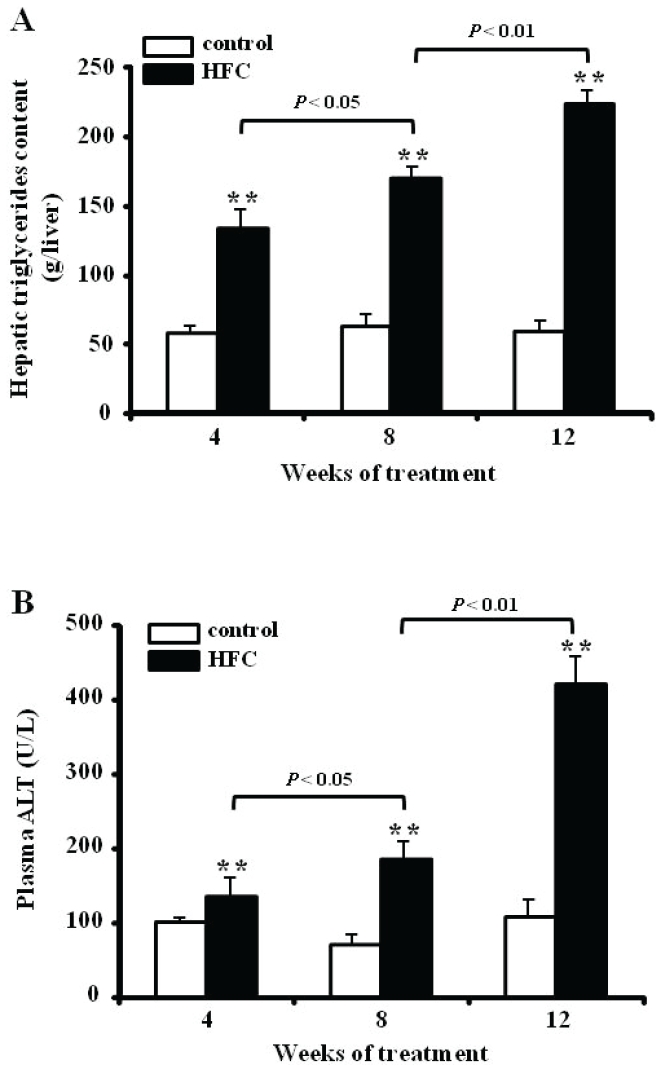
Hepatic triglyceride content (A) and plasma ALT levels (B) in control diet-fed rats (control) and rats fed a high-fat and high-cholesterol (HFC) diet for 4, 8, and 12 weeks. Hepatic triglyceride levels are expressed per gram of liver tissue, and plasma ALT values are expressed in U/L. Data represent mean ± SEM (n = 6). *P < 0.05, **P < 0.01 for HFC vs group.
Expression of adiponectin receptor (AdipoR2)
Hepatic expression of the adiponectin receptor (AdipoR2) gene was significantly down-regulated (0.67-fold at 8 weeks and 0.58-fold at 12 weeks) in NASH as compared with control rats (Figure 4A).
Figure 4.

Real-time PCR analysis of adiponectin and AdipoR2 (A), antioxidant enzyme (B), inflammatory (C), and NADPH oxidase complex (D) gene expression in rats with NASH at 4, 8, and 12 weeks. Values are expressed as mean ± SEM (n = 6). *P < 0.05, **P < 0.01 for NASH vs control group. AdipoR, adiponectin receptor; SOD, superox-ide dismutase; Gpx, glutathione peroxidase; TNFα, tumour necrosis factor α; MCP-1, monocyte chemoattractant protein-1, gp91phox, gp91phox protein; p22phox, p22phox protein; p47phox, p47phox protein; Nox4, NADPH oxidase
Expression of antioxidant enzyme genes (Cu-Zn SOD, Mn-SOD, Catalase, Gpx1)
Oxidative stress is regulated by the balance between ROS production and antioxidant enzyme activity [24]. We determined the mRNA expression levels of the genes for Cu-Zn SOD, Mn-SOD, catalase, and Gpx1, which reduce ROS and lipid peroxides, resulting in decreased oxidative stress. In the present study, the hepatic expression of mRNA for Cu-Zn SOD and Mn-SOD was significantly down-regulated (0.43-, and 0.57-fold, respectively) in NASH as compared with control rats at 12 weeks (Figure 4B).
Expression of genes related to inflammation (TNFα, MCP-1)
In the NASH group, the expression of TNFα and MCP-1 mRNAs was significantly up-regulated (1.56-, and 2.31-fold at 8 weeks, and 2.56-, and 3.33-fold at 12 weeks, respectively) compared with the control group (Figure 4C). Moreover, the hepatic expression of MCP-1 mRNA in NASH rats at 4 weeks was up-regulated (2.01-fold vs the control rats at 4 weeks).
Expression of genes related to NADPH oxidase complex (gp91phox, p22phox, p47phox, Nox4)
ROS are can arise from several biochemical reactions: mitochondrial and peroxisomal fatty acid β-oxidation, microsomal fatty acid ω-oxidation, and reduction of oxygen by the nicoti-namide adenine dinucleotide phosphate (NADPH) oxidase (Nox) complex [25]. We measured the expression of mRNA for NADPH oxidase complex (gp91phox, p22phox, p47phox, and Nox4). In NASH rats, the mRNA expression of genes encoding for key regulators of ROS, including gp91phox (also called Nox2), p22phox, and Nox4, were significantly up-regulated (1.69-, 1.87-, and 2.18-fold at 8 weeks, and 1.77-, 2.08-, and 3.37-fold at 12 weeks, respectively) as compared with control rats (Figure 4D). In addition, the hepatic expression of Nox4 mRNA in NASH rats at 4 weeks was significantly up-regulated (2.03-fold) relative to the control rats).
Discussion
In the present study, we showed that rats fed a HFC diet for 4, 8, and 12 weeks developed obesity, hyperglycemia, insulin resistance, and hyperlipidemia, and also marked hepatic stea-tosis, inflammation, and fibrosis, which are all characteristics of NASH. Moreover, hepatocyte ballooning and Mallory hyaline bodies, essential findings for the diagnosis of NASH in humans, were seen in HFC rats at 4, 8, and 12 weeks. These characteristics of the HFC rats clearly meet the definition of NASH. We have also shown, for the first time, the dynamic panel of mRNA expression of genes related to inflammatory and oxidative stress factors under the control of AdipoR2 in the NASH liver.
In our dietary model of NASH, mRNA down-regulation of the gene for AdipoR2 was observed in the liver. AdipoR2 is mainly involved in the activation of the PPARα pathway, which up-regulates the expression of a suite of genes that includes mitochondrial, peroxisomal, and microsomal fatty acid oxidation enzymes in the liver [16]. Recent studies have reported that the down-regulation of AdipoR2 expression is attributable to decreased PPARα expression in NASH [26]. In the present study, however, we demonstrated mRNA up-regulation of genes involved in ROS production (gp91phox, p22phox, p47phox, and Nox4) and the down-regulation of genes related to antioxidant enzymes (Cu-Zn SOD, Mn-SOD, GPx1, catalase) in liver with NASH. The mRNA up-regulation of Nox complex and the down-regulation of antioxidant enzymes in the liver of NASH suggest that mitochondrial and peroxisomal fatty acid β-oxidation and microsomal fatty acid ω-oxidation are increased in NASH liver. Furthermore, we speculate that the up-regulation of fatty acid oxidation may lead to an increase in ROS production in hepatocytes and the down-regulation of antioxidant enzymes, resulting in induction of hepatic oxidative stress in NASH.
The Nox complex may be a major source of hepatic ROS production in NASH. The hepatic expression of mRNA for gp91phox and its sub-units p22phox were significantly up-regulated in rats with NASH as compared with control rats. gp91phox and/or Nox4 increase TGF-β (transforming growth factor β) production, which promotes fibrosis and the proliferation of stellate cells [27]. We found that TGF-β mRNA was upregulated in the liver of rats with NASH (data not shown), which accompanied the histopathological findings of steatohepatitis, inflammation, and fibrosis. Moreover, the hepatic expression of TNFα and MCP-1 mRNAs was significantly up-regulated in rats with NASH as compared with control rats. Induction of Nox1/2/4 by TNFα promotes hepatocyte apoptosis and inflammation in experimental models of NASH [28]. Thus NADPH oxidases, especially gp91phox and Nox4, might to be involved in pathways leading to insulin resistance and steatosis in the liver, constituting the ‘two hits theory’ for NASH pathogenesis (steatosis, inflammation, and fibrosis) [5]. Thereby, the regulating of expression of Adi-poR2, which negatively regulates the expression of genes related to inflammation and ROS [12], seems to be crucially important.
In conclusion, our NASH animal model indicates various gene expression dynamics and suggests that the mRNA down-regulation of AdipoR2 induces oxidative stress and inflammation, potentially through the up-regulated expression of genes that modulate ROS and inflammation, and the down-regulated expression of antioxidant enzymes in the liver. Thus, we have established a dietary rodent model of steatohepatitis which reflects the human pathophysiology of NASH. Additionally, Tomita et al suggested that the enhancement of the AdipoR2 signaling pathway in the liver may be a promising strategy for the treatment of NASH [26]. The present model can be applied for further studies on the pathology, treatment, and prevention of NASH.
Acknowledgments
This study was partially supported by the Academic Frontier Project “Surveillance and control for zoonoses” and Strategic Research Base Development Program “International research on epidemiology of zoonoses and training for young researchers” from Ministry of Education, Culture, Sports, Science and Technology, Japan.
References
- 1.Ludwig J, Viggiano TR, McGill DB, Oh BJ. Nonalcoholic steatohepatitis: Mayo Clinic experiences with a hitherto unnamed disease. Mayo Clin Proc. 1980;55:434–438. [PubMed] [Google Scholar]
- 2.Ludwig J, McGill DB, Lindor KD. Review: nonalcoholic steatohepatitis. J Gastroenterol Hepatol. 1997;12:398–403. doi: 10.1111/j.1440-1746.1997.tb00450.x. [DOI] [PubMed] [Google Scholar]
- 3.Brunt EM, Janney CG, Di Bisceglie AM, Neuschwander-Tetri BA, Bacon BR. Nonalcoholic steatohepatitis: a proposal for grading and staging the histological lesions. Am J Gastroenterol. 1999;94:2467–2474. doi: 10.1111/j.1572-0241.1999.01377.x. [DOI] [PubMed] [Google Scholar]
- 4.Bacon BR, Farahvash MJ, Janney CG, Neuschwander-Tetri BA. Nonalcoholic steatohepatitis: an expanded clinical entity. Gastroenterology. 1994;107:1103–1109. doi: 10.1016/0016-5085(94)90235-6. [DOI] [PubMed] [Google Scholar]
- 5.James OF, Day CP. Non-alcoholic steatohepatitis (NASH): a disease of emerging identity and importance. J Hepatol. 1998;29:495–501. doi: 10.1016/s0168-8278(98)80073-1. [DOI] [PubMed] [Google Scholar]
- 6.George J. Ascorbic acid concentrations in dimethylnitrosamine-induced hepatic fibrosis in rats. Clin Chim Acta. 2003;335:39–47. doi: 10.1016/s0009-8981(03)00285-7. [DOI] [PubMed] [Google Scholar]
- 7.Browning JD, Horton JD. Molecular mediators of hepatic steatosis and liver injury. J Clin Invest. 2004;114:147–152. doi: 10.1172/JCI22422. [DOI] [PMC free article] [PubMed] [Google Scholar]
- 8.Carmiel-Haggai M, Cederbaum AI, Nieto N. A high-fat diet leads to the progression of nonalcoholic fatty liver disease in obese rats. Faseb J. 2005;19:136–138. doi: 10.1096/fj.04-2291fje. [DOI] [PubMed] [Google Scholar]
- 9.Yamauchi T, Kamon J, Minokoshi Y, Ito Y, Waki H, Uchida S, Yamashita S, Noda M, Kita S, Ueki K, Eto K, Akanuma Y, Froguel P, Foufelle F, Ferre P, Carling D, Kimura S, Nagai R, Kahn BB, Kadowaki T. Adiponectin stimulates glucose utilization and fatty-acid oxidation by activating AMP-activated protein kinase. Nat Med. 2002;8:1288–1295. doi: 10.1038/nm788. [DOI] [PubMed] [Google Scholar]
- 10.Berg AH, Combs TP, Du X, Brownlee M, Scherer PE. The adipocyte-secreted protein Acrp30 enhances hepatic insulin action. Nat Med. 2001;7:947–953. doi: 10.1038/90992. [DOI] [PubMed] [Google Scholar]
- 11.Tsao TS, Murrey HE, Hug C, Lee DH, Lodish HF. Oligomerization state-dependent activation of NF-kappa B signaling pathway by adipocyte complement-related protein of 30 kDa (Acrp30) J Biol Chem. 2002;277:29359–29362. doi: 10.1074/jbc.C200312200. [DOI] [PubMed] [Google Scholar]
- 12.Yamauchi T, Nio Y, Maki T, Takazawa T, Iwabu M, Okada-Iwabu M, Kawamoto S, Kubota N, Kubota T, Ito Y, Kamon J, Tsuchida A, Kumagai K, Kozono H, Hada Y, Ogata H, Tokuyama K, Tsunoda M, Ide T, Murakami K, Awazawa M, Takamoto I, Froguel P, Hara K, Tobe K, Nagai R, Ueki K, Kadowaki T. Targeted disruption of AdipoR1 and AdipoR2 causes abrogation of adiponectin binding and metabolic actions. Nat Med. 2007;13:332–339. doi: 10.1038/nm1557. [DOI] [PubMed] [Google Scholar]
- 13.Xu A, Wang Y, Keshaw H, Xu LY, Lam KS, Cooper GJ. The fat-derived hormone adiponectin alleviates alcoholic and nonalcoholic fatty liver diseases in mice. J Clin Invest. 2003;112:91–100. doi: 10.1172/JCI17797. [DOI] [PMC free article] [PubMed] [Google Scholar]
- 14.Tsochatzis E, Papatheodoridis GV, Archimandritis AJ. The evolving role of leptin and adiponectin in chronic liver diseases. Am J Gastroenterol. 2006;101:2629–2640. doi: 10.1111/j.1572-0241.2006.00848.x. [DOI] [PubMed] [Google Scholar]
- 15.Musso G, Gambino R, De Michieli F, Biroli G, Premoli A, Pagano G, Bo S, Durazzo M, Cassader M. Nitrosative stress predicts the presence and severity of nonalcoholic fatty liver at different stages of the development of insulin resistance and metabolic syndrome: possible role of vitamin A intake. Am J Clin Nutr. 2007;86:661–671. doi: 10.1093/ajcn/86.3.661. [DOI] [PubMed] [Google Scholar]
- 16.Kadowaki T, Yamauchi T. Adiponectin and adiponectin receptors. Endocr Rev. 2005;26:439–451. doi: 10.1210/er.2005-0005. [DOI] [PubMed] [Google Scholar]
- 17.Meister A. Glutathione deficiency produced by inhibition of its synthesis, and its reversal; applications in research and therapy. Pharmacol Ther. 1991;51:155–194. doi: 10.1016/0163-7258(91)90076-x. [DOI] [PubMed] [Google Scholar]
- 18.Sun Y, Oberley LW, Li Y. A simple method for clinical assay of superoxide dismutase. Clin Chem. 1988;34:497–500. [PubMed] [Google Scholar]
- 19.Aebi H. Catalase in vitro. Methods Enzymol. 1984;105:121–126. doi: 10.1016/s0076-6879(84)05016-3. [DOI] [PubMed] [Google Scholar]
- 20.Paglia DE, Valentine WN. Studies on the quantitative and qualitative characterization of erythrocyte glutathione peroxidase. J Lab Clin Med. 1967;70:158–169. [PubMed] [Google Scholar]
- 21.Ohkawa H, Ohishi N, Yagi K. Assay for lipid peroxides in animal tissues by thiobarbituric acid reaction. Anal Biochem. 1979;95:351–358. doi: 10.1016/0003-2697(79)90738-3. [DOI] [PubMed] [Google Scholar]
- 22.Schmittgen TD, Zakrajsek BA. Effect of experimental treatment on housekeeping gene expression: validation by real-time, quantitative RT-PCR. J Biochem Biophys Methods. 2000;46:69–81. doi: 10.1016/s0165-022x(00)00129-9. [DOI] [PubMed] [Google Scholar]
- 23.Pfaffl MW. A new mathematical model for relative quantification in real-time RT-PCR. Nucleic Acids Res. 2001;29:e45. doi: 10.1093/nar/29.9.e45. [DOI] [PMC free article] [PubMed] [Google Scholar]
- 24.Nordberg J, Arnér ES. Reactive oxygen species, antioxidants, and the mammalian thiore-doxin system. Free Radic Biol Med. 2001;31:1287–1312. doi: 10.1016/s0891-5849(01)00724-9. [DOI] [PubMed] [Google Scholar]
- 25.Krieger-Brauer HI, Kather H. Human fat cells possess a plasma membrane-bound H2O2-generating system that is activated by insulin via a mechanism bypassing the receptor kinase. J Clin Invest. 1992;89:1006–1013. doi: 10.1172/JCI115641. [DOI] [PMC free article] [PubMed] [Google Scholar]
- 26.Tomita K, Oike Y, Teratani T, Taguchi T, Noguchi M, Suzuki T, Mizutani A, Yokoyama H, Irie R, Sumimoto H, Takayanagi A, Miyashita K, Akao M, Tabata M, Tamiya G, Ohkura T, Hibi T. Hepatic AdipoR2 signaling plays a protective role against progression of nonalcoholic steatohepatitis in mice. Hepatology. 2008;48:458–473. doi: 10.1002/hep.22365. [DOI] [PubMed] [Google Scholar]
- 27.Proell V, Carmona-Cuenca I, Murillo MM, Huber H, Fabregat I, Mikulits W. TGF-beta dependent regulation of oxygen radicals during transdif-ferentiation of activated hepatic stellate cells to myofibroblastoid cells. Comp Hepatol. 2007;6:1. doi: 10.1186/1476-5926-6-1. [DOI] [PMC free article] [PubMed] [Google Scholar]
- 28.Feldstein AE, Canbay A, Angulo P, Taniai M, Burgart LJ, Lindor KD, Gores GJ. Hepatocyte apoptosis and fas expression are prominent features of human nonalcoholic steatohepatitis. Gastroenterology. 2003;125:437–443. doi: 10.1016/s0016-5085(03)00907-7. [DOI] [PubMed] [Google Scholar]