

Abstract
We investigated HIV-1 vaccine-induced lymphoproliferative responses in healthy volunteers immunized intradermally or intramuscularly (with or without adjuvant granulocyte-macrophage colony-stimulating factor [GM-CSF] protein) with DNA expressing HIV-1 gag, env, rev, and rt at months 0, 1, and 3 using a Biojector and boosted at 9 months with modified vaccinia virus Ankara (MVA) expressing heterologous HIV-1 gag, env, and pol (HIV-MVA). Lymphoproliferative responses to aldrithiol-2 (AT-2)-inactivated-HIV-1 antigen were tested by a [3H]thymidine uptake assay and a flow-cytometric assay of specific cell-mediated immune response in activated whole blood (FASCIA-WB) 2 weeks after the HIV-MVA boost (n = 38). A FASCIA using peripheral blood mononuclear cells (FASCIA-PBMC) was also employed (n = 14). Thirty-five of 38 (92%) vaccinees were reactive by the [3H]thymidine uptake assay. Thirty-two of 38 (84%) vaccinees were reactive by the CD4+ T-cell FASCIA-WB, and 7 of 38 (18%) also exhibited CD8+ T-cell responses. There was strong correlation between the proliferative responses measured by the [3H]thymidine uptake assay and CD4+ T-cell FASCIA-WB (r = 0.68; P < 0.01). Fourteen vaccinees were analyzed using all three assays. Ten of 14 (71%) and 11/14 (79%) demonstrated CD4+ T-cell responses in FASCIA-WB and FASCIA-PBMC, respectively. CD8+ T-cell reactivity was observed in 3/14 (21%) and 7/14 (50%) using the FASCIA-WB and FASCIA-PBMC, respectively. All 14 were reactive by the [3H]thymidine uptake assay. The overall HIV-specific T-cell proliferative response in the vaccinees employing any of the assays was 100% (38/38). A standardized FASCIA-PBMC, which allows simultaneous phenotyping, may be an option to the [3H]thymidine uptake assay for assessment of vaccine-induced T-cell proliferation, especially in isotope-restricted settings.
Human immunodeficiency virus (HIV)/AIDS is a global burden, but predominantly prevalent in sub-Saharan Africa. In 2008 there were an estimated 33.4 million (31.1 to 35.8 million) people globally living with HIV and an estimated 2.7 million (2.4 to 3.0 million) new HIV infections and 2.0 million (1.7 to 2.4 million) HIV-related deaths occurred (UNAIDS: AIDS epidemic update 2009 [www.unaids.org/en/KnowledgeCentre/HIVData/EpiUpdate/EpiUpdArchive/2009/default.asp]). Sixty-seven percent of all people living with HIV are found in sub-Saharan Africa, and 72% of total global AIDS deaths occurred in the region in 2008. Approximately 60% of HIV infections in sub-Saharan Africa occur in women (UNAIDS: AIDS epidemic update 2009 [see the URL listed above]). Development of an effective and well-tolerated HIV vaccine is likely to be the best way to stop further spread of HIV infection. Most current HIV vaccine candidates in clinical trials are designed to induce cell-mediated immune responses, and thus much of vaccine assessment relies on cell-based assays that quantify and characterize the vaccine-induced T-cell responses.
Several studies provide support for a correlation between T-cell function and HIV control (reviewed in reference 1). HIV-specific CD4+ T-cell responses, including vigorous proliferation and production of gamma interferon (IFN-γ) and β chemokines, were shown to be associated with control of virus replication and prevention of disease progression by Rosenberg and colleagues (18). Proliferative capacity has generally been linked to CD4+ T-cell responses. However, Migueles et al. reported that CD8+ T cells from HIV-infected long-term nonprogressors (LTNP) had a greater capacity to proliferate than those from progressors. Proliferation was tightly coupled to increases in perforin expression, indicating enhanced effector function (17). More recently, CD8+ T cells with proliferative capacity have been implicated in the immune control of HIV-1 infection. HLA-B*57- and -B*27-restricted CD8+ T cells from long-term nonprogressors exhibited greater proliferative capacity than those restricted by other alleles (13). In a South African cohort of HIV-infected individuals, proliferation showed a significant inverse correlation with viral load, while cytokine production and degranulation did not (5). Calarota et al. (2) recently also showed that the presence of antigen-specific T-cell precursors with high proliferative capacity was associated with HIV-1 control and preservation of CD4 counts. Additionally, T-cell proliferation has been associated with reduced HIV acquisition in Kenyan female sex workers (12).
There are various assays that are used for monitoring vaccine-induced cell-mediated immune responses, of which detection of proliferative capacity is one. The lymphocyte proliferation assay (LPA) has been used for many years to measure in vitro HIV-specific T-lymphocyte responses (3, 6, 24, 25, 26). LPA results are influenced by antigen processing and presentation, the ability of T cells to proliferate in culture, and the initial frequency of antigen-specific memory T cells (9, 14, 24). The tritiated thymidine ([3H]thymidine) uptake assay is the conventional method that has been used to determine proliferation of T lymphocytes by measurement of incorporation of the radioactive tracer tritiated thymidine in newly synthesized DNA of dividing cells. The assay utilizes purified peripheral blood mononuclear cells (PBMC) and takes 3 to 7 days to complete. The assay does not provide information on the phenotype of proliferating cells and has generally been considered a CD4+ T-cell assay (4). Furthermore, the use of radioactive thymidine is restricted in some developing countries.
Several flow cytometry-based methods to measure proliferative T-cell responses have been described, including the detection of intracellular markers of cell division such as Ki67 (22) and of incorporation of the thymidine analogue bromodeoxyuridine (BrdU) (16) and staining with fluorescent dyes such as carboxyfluorescein diacetate succinimidyl ester (CFSE) and PKH26 (7, 10, 15). CFSE or PKH26 is divided between daughter cells upon cell division whereby the fluorescence intensity of the cells reveals the number of divisions that have occurred. Another LPA called flow cytometric assay of specific cell-mediated immune response in activated whole blood (FASCIA-WB) utilizes whole-blood samples that are cultivated for 6 to 7 days in the presence or absence of stimulators, and results are assessed as the number of antigen-specific lymphoblasts generated (8, 23). The assay can also be run using PBMC (FASCIA-PBMC). Both FASCIA variants can differentiate between CD4+ and CD8+ T-lymphocyte immune responses. In settings where there is restricted use of radioactive thymidine, FASCIA-WB or FASCIA-PBMC may be an option to a conventional [3H]thymidine uptake assay.
A randomized, open-label, phase I HIV safety and immunogenicity study (HIVIS01/02) to assess different modes of administering an HIV DNA vaccine candidate (plasmid DNA with inserted HIV genes env, rev, gag, and RT) boosted with heterologous recombinant modified vaccinia virus Ankara (MVA) expressing analogous HIV-1 genes (HIV-MVA) was completed recently in Stockholm, Sweden. In the HIVIS01/02 trial, 34 of 38 vaccinees had HIV-specific IFN-γ enzyme-linked immunospot (ELISpot) responses and 35 of 38 vaccinees had a positive lymphoproliferative response by the [3H]thymidine uptake assay. An overall total of 37 (97%) were responders. It was also shown that a low dose of HIV-1 DNA administered intradermally i.d. was as effective as a high dose administered intramuscularly (i.m.) in priming for the MVA boosting vaccine (21).
The aim of the current study was to further define the HIV-1-specific lymphoproliferative responses in these volunteers by applying a flow cytometry-based assay employing either whole blood (FASCIA-WB) or PBMC (FASCIA-PBMC) to assess vaccine-induced CD4+ and CD8+ T-cell proliferation. Furthermore, the use of FASCIA, especially suitable in isotope-restricted settings, was explored as an alternative to the conventional [3H]thymidine uptake assay.
MATERIALS AND METHODS
Study samples.
Samples from 38 healthy volunteers participating in the HIVIS01/02 trial were included in the study. The immunization scheme and vaccine components used in the HIVIS01/02 trial have been described previously (21). In brief, volunteers were randomized to 4 different treatment groups and immunized either i.d. or i.m., with or without adjuvant granulocyte-macrophage colony-stimulating factor (GM-CSF) (Table 1), with DNA expressing HIV-1 genes envA, -B, and -C, revB, gagA and -B, and rtB at months 0, 1, and 3 using a Biojector (kindly provided by R. Stout, Bioject, Portland, OR). The volunteers were further rerandomized for boosting at 9 months with MVA expressing HIV-1 envE, gagA, and polA genes, developed by the Laboratory of Viral Diseases, National Institute of Allergy and Infectious Diseases, National Institutes of Health, Bethesda, MD, and produced by Walter Reed Army Institute for Research, Rockville, MD (Table 1).
TABLE 1.
Vaccination groups and vaccinationsa
| Immunization group (n) | HIV DNA priming immunizations (n = 3) |
Immunization subgroup (n) | HIV-MVA boosting immunization (n = 1) |
||
|---|---|---|---|---|---|
| Amt (mg) | Route | Amt (PFU) | Route | ||
| A (10) | 1 | i.d. | A1 (5) | 108 | i.m. |
| A2 (5) | 107 | i.d. | |||
| B (10) | 3.8 | i.m. | B1 (5) | 108 | i.m. |
| B2 (5) | 107 | i.d. | |||
| C (9)b | 1 (+GM-CSF) | i.d. | C1 (5) | 108 | i.m. |
| C2 (4)b | 107 | i.d. | |||
| D (9)b | 2 (+GM-CSF) | i.m. | D1 (4)b | 108 | i.m. |
| D2 (5) | 107 | i.d. | |||
HIV DNA priming immunizations were administered at days 0, 30, and 90. The HIV-MVA boosting immunization was administered at month 9. GM-CSF, granulocyte-macrophage colony-stimulating factor; i.d., intradermal; i.m., intramuscular.
Two vaccinees did not receive all immunizations and were therefore not included in the analyses.
Lymphoproliferative responses to aldrithiol-2 (AT-2)-inactivated-HIV-1 antigen were determined in fresh blood samples collected from 38 vaccinees 2 weeks after the HIV-MVA boost immunization using the [3H]thymidine uptake assay and the FASCIA-WB. FASCIA-PBMC were employed during the later part of the study (14 samples). The 14 samples were selected on the basis of their availability, as all assays were performed using fresh cells.
Twenty-eight healthy blood donors were also included to determine background reactivity levels, 17 for the FASCIA-PBMC and 27 for the conventional [3H]thymidine uptake assay.
Antigens.
AT-2-treated-HIV-1 MN (subtype B) and SUPT1 microvesicles (control), kindly donated by J. Lifson (National Cancer Institute, Frederick, MD), were used at a final concentration of 2.5 μg/ml. Phytohemagglutinin (PHA; 5 μg/ml; Difco Laboratories, Detroit, MI) was used as a positive control.
PBMC preparation.
Whole blood was collected in cell preparation tubes (CPT; Becton Dickinson Vacutainer Systems, Franklin Lakes, NJ) containing sodium heparin as an anticoagulant and a cell separation medium. The CPTs were processed according to the manufacturer's instructions. After blood draw, the CPTs were transported to the laboratory, where the tubes were inverted 8 times before centrifugation at 1,500 × g and room temperature. Cell preparation was performed within 6 h of blood collection. The cell suspension was collected, and the cells were washed twice in phosphate-buffered saline (PBS) and resuspended in complete medium consisting of RPMI 1640 medium with Glutamax (Invitrogen Ltd., Paisley, United Kingdom), supplemented with penicillin (50 IU/ml)-streptomycin (50 μg/ml) and 10 mM HEPES, before counting. PBMC yield and viability were determined using a NucleoCounter (ChemoMetec A/S, Allerod, Denmark). Fresh PBMC were used in the [3H]thymidine uptake assay and FASCIA-PBMC.
[3H]thymidine uptake assay.
The [3H]thymidine uptake proliferation assay was performed as previously described (21). Briefly, fresh PBMC were incubated in triplicate at 200,000 cells/well in 96-well flat-bottom plates (Nunclon, Aarhus, Denmark) in 0.2 ml complete medium supplemented with 10% heat-inactivated human AB+ sera. Cells were cultured at 37°C in a humidified 7.5% CO2 incubator in the absence (complete medium only) or presence of AT-2-treated-HIV-1 MN antigen, SUPT1 microvesicles (control antigen), and PHA. Cell cultures were pulsed for 6 h on day 2 (PHA) and day 6 (specific antigens) with 1 μCi [3H]thymidine per well (GE Healthcare Bio-Sciences AB, Uppsala, Sweden). The cells were harvested onto filters using Harvester 96 Mach III Tomtec (Wallac, Turku, Finland), and [3H]thymidine incorporation was measured using a 1450 MicroBeta liquid scintillation counter (Wallac, Turku, Finland). T-cell proliferation was reported as stimulation index (SI), determined by dividing the mean counts per minute for the antigen-stimulated wells by the mean for the unstimulated control wells. The mean background reactivity in samples from healthy blood donors (n = 27) was an SI of 1.70 ± 2.09. A SI of ≥8 was considered positive (mean SI + 3 standard deviations [SD] = 7.95).
FASCIA-WB.
Blood was collected in Vacutainer tubes (BD) containing sodium heparin as an anticoagulant. Whole blood diluted 1/8 in medium (RPMI 1640 with Glutamax supplemented with 50 IU/ml penicillin and 50 μg/ml streptomycin) was cultured in the absence (medium only, negative control [NC]) or presence (test) of HIV-1 antigen and PHA (positive control [PC]). Four hundred microliters of the diluted blood and 100 μl of antigen or medium only were added to polystyrene round-bottom tubes with caps (BD Biosciences, San Jose, CA) and incubated for 7 days in a humidified atmosphere at 37°C with 7.5% CO2. All samples were run in duplicate. After incubation, the tubes were centrifuged at 300 × g for 5 min and 350 μl of the supernatants was removed. The cells were stained with anti-CD3-fluorescein isothiocyanate (FITC) and anti-CD4-PerCP (BD) for 15 min in the dark at room temperature. One milliliter of lysing solution (Pharm Lyse; BD) was added, and cells were incubated for 10 min at room temperature, followed by centrifugation at 300 × g for 5 min, removal of the supernatants, addition of lysing solution (BD), washing with FACSFlow (BD), and resuspension in 450 μl of CellFIX (BD). The samples were stored in the dark at 4°C until acquisition.
FASCIA-PBMC.
Fresh PBMC were cultured in complete medium supplemented with 10% heat-inactivated human AB+ sera in the absence (complete medium [NC]) or presence (test) of HIV-1 antigen and PHA (PC). Two hundred thousand cells/well (100 μl) and 100 μl of antigen or complete medium were added to 96-well flat-bottom plates (Nunclon, Aarhus, Denmark) and incubated for 7 days in a humidified atmosphere at 37°C with 7.5% CO2 in air. All samples and controls were run in duplicate. After stimulation, the cells were transferred to polystyrene round-bottom tubes (BD) and centrifuged at 300 × g for 5 min and 100 μl of the supernatants was removed. The pellets were stained with anti-CD3-FITC and anti-CD4-PerCP (BD) for 10 min at room temperature, followed by washing with FACSFlow (BD) and resuspension in 450 μl of CellFIX (BD). The samples were stored in the dark at 4°C until acquisition.
Flow cytometric acquisition.
Acquisition was performed using either a FACScan (BD) equipped with one 15-mW air-argon ion (488-nm) laser or a FACSCalibur (BD) equipped with one 15-mW air-argon ion laser and one red iodide laser operating at 488 nm and 635 nm, respectively. The instrument was set for three- or four-color analysis using FACSComp software (BD) in conjunction with Calibrite beads (BD), with a threshold on forward scatter (FSC) to exclude debris. The flow rate was set on “high,” which corresponds to a collection rate of 1 μl/s. Further, the collection criterion was set on “time” instead of “events” in order to collect 1/10 (45 μl) of the sample volume from each tube, which enables determination of the total number of cell subsets in a culture by multiplying the number of acquired cells by a factor of 10. Data were collected in list mode, and analyses were performed using Cell Quest Pro software, version 4.0.1, and FlowJo software, version 8.7.1.
Flow cytometric analysis and calculations.
A detailed description of the sample analysis is found in Fig. 1. All samples were analyzed as duplicates. Proliferative responses were measured by detection of CD3+ CD4+ and CD3+ CD4− (CD8+) lymphoblasts, and results were expressed as mean percentages of stimulation (%S) according to the equation %S = 100 × (test − NC)/(PC − NC). For simplicity, CD3+ CD4+ and CD3+ CD4− T cells are referred to as CD4+ and CD8+ T cells, respectively. A %S value above the mean ± 3 SD of the baseline values for the vaccinees was considered to be a positive reaction for FASCIA-WB. The mean background reactivity levels in the baseline samples from the vaccinees (%S values; n = 38) were 0.23% ± 0.24% for the CD4+ T cells and 0.21% ± 0.28% for the CD8+ T cells. %S values above 1.0% and 1.1%, respectively, were considered to indicate positive responses.
FIG. 1.

Analysis strategy for flow cytometric assessment of lymphoproliferative responses by detection of lymphoblasts in FASCIA-WB or FASCIA-PBMC. Shown are proliferative responses against AT-2-inactivated-HIV-1 antigen assessed by FASCIA-WB in samples from a vaccinee collected at baseline (column A) and 2 weeks after MVA boost (column B) and by FASCIA-PBMC in samples from a blood donor (column C) and from a vaccinee at 2 weeks after MVA boost (column D). CD3+ T cells are identified by region R1 on a side scatter (SSC) versus FL1 (CD3) dot plot (first [top] row). Then, small nongranular resting lymphocytes and granular lymphoblasts are identified by regions R2 and R3, respectively, on a forward scatter (FSC) versus SSC dot plot (second row). Cells within R2 and R3 are displayed on dot plots showing staining with anti-CD3 and anti-CD4 antibodies, where CD4+ CD3+ T cells and CD4− CD3+ T cells are indicated as CD4 and CD8, respectively.
In the absence of baseline values for FASCIA-PBMC, %S values above the mean ± 3 SD for 17 healthy controls were considered positive in this assay. The mean background reactivity levels were 0.26% ± 0.72% for the CD4+ T cells and 0.55% ± 0.75% for the CD8+ T cells. %S values above 2.4% and 2.8%, respectively, were considered to indicate positive responses.
Ethical considerations.
The phase I HIVIS trial protocols were approved by the Regional Ethics Committee, Stockholm, Sweden. Informed consents were obtained from study volunteers prior to their inclusion into the study.
Statistical analysis.
The proportion of vaccinees with HIV-1-specific lymphoproliferative responses was determined for each assay ([3H]thymidine uptake assay, FASCIA-WB, and FASCIA-PBMC), and comparisons were made using Pearson's chi-square test and Fisher's exact test, where applicable. The Mann-Whitney U test was used for comparative analyses of LPA reactivity levels. Correlations between results obtained by the [3H]thymidine uptake assay, FASCIA-WB, and FASCIA-PBMC were estimated by the nonparametric Spearman rank correlation test. A P value of <0.05 was considered statistically significant.
RESULTS
The [3H]thymidine uptake assay displayed strong T-cell proliferative responses.
Lymphoproliferative responses to AT-2-inactivated-HIV-1 antigen were determined in fresh blood samples collected from 38 vaccinees 2 weeks after the HIV-MVA boosting immunization using a [3H]thymidine uptake assay and FASCIA-WB. Thirty-five of 38 vaccinees (92.1%) were reactive by the [3H]thymidine uptake assay (SI ≥ 8), with a mean reactivity (SI) ± SD of 135.63 ± 233.10 (Fig. 2). The mean counts per minute for reactive donors ± SD was 17,987 ± 18,954 cpm (range, 386 to 72,295 cpm).
FIG. 2.

T-cell proliferation against AT-2-inactivated-HIV-1 antigen, as measured by the [3H]thymidine uptake assay (cutoff SI ≥ 8), in 38 HIVIS01/02 volunteers at the time of HIV-MVA vaccination and 2 weeks after vaccination by vaccination group. The vaccination groups are detailed in Table 1.
Both HIV-1-specific CD4+ and CD8+ T-cell proliferative responses were detected by FASCIA-WB.
Thirty-three of 38 vaccinees (86.8%) were reactive by the CD4+ T-cell FASCIA-WB (Fig. 3 A), and 8 (21%) were also reactive by the CD8+ T-cell FASCIA-WB (Fig. 3B). The mean (±SD) HIV-specific CD4+ T-cell proliferative responses (%S) detected by the FASCIA-WB were 0.23% ± 0.24% in the baseline samples and 10.42% ± 16.26% in the HIV-MVA postvaccination samples. The corresponding values for the CD8+ T-cell proliferative responses were 0.21% ± 0.28% and 3.21% ± 10.97%, respectively.
FIG. 3.

CD4+ (cutoff %S > 1.0% reactivity) (A) and CD8+ (cutoff %S > 1.1% reactivity) (B) T-cell proliferation, as assessed by FASCIA-WB, in 38 HIVIS01/02 volunteers following stimulation with AT-2-inactivated-HIV-1 antigen at baseline and 2 weeks after HIV-MVA vaccination. The vaccination groups are detailed in Table 1.
The FASCIA-PBMC (CD4+) correlated with the [3H]thymidine uptake assay.
A slightly higher number of responders (35/38) were detected by the conventional [3H]thymidine uptake assay than by FASCIA-WB (33/38), though the difference did not reach statistical significance. Five vaccinees that were reactive by the [3H]thymidine uptake assay were nonreactive by the CD4+ T-cell FASCIA-WB, and three vaccinees that were reactive by the CD4+ T-cell FASCIA-WB were nonreactive by the [3H]thymidine uptake assay (Fig. 4). Six of the eight samples with discordant results displayed reactivities close to the cutoff in both assays. Nonetheless, there was a significant correlation (r = 0.68; P < 0.01) between the proliferative responses measured by the [3H]thymidine uptake assay and the CD4+ T-cell FASCIA-WB.
FIG. 4.

Correlation of T-cell proliferative responses against AT-2-inactivated-HIV-1 antigen, as measured by the [3H]thymidine uptake assay and the FASCIA-WB (CD4+), in 38 HIVIS01/02 volunteers 2 weeks after the HIV-MVA immunization (r = 0.68; P < 0.01). Samples reactive in both assays (blue rhombs), reactive only in the [3H]thymidine uptake assay (red triangles), and reactive only in FASCIA-WB (CD4+, yellow circles) are indicated.
The FASCIA-PBMC reveals additional T-cell reactivity.
Because of the discrepancy in the number of responders noted using FASCIA-WB compared to the [3H]thymidine uptake assay, a FASCIA using PBMC was added for the testing of the final 14 vaccinees in the trial. All 14 (100%) were reactive using the [3H]thymidine uptake assay, 11 (78.6%) were reactive by the CD4+ T-cell FASCIA-PBMC, and 10 (71.4%) were reactive by the CD4+ T-cell FASCIA-WB (P = 0.78 and 0.59, respectively) (Fig. 5). The mean (±SD) HIV-specific CD4+ T-cell proliferative responses (%S) detected by the FASCIA-PBMC and FASCIA-WB were 32.82% ± 47.64% and 14.44% ± 24.29%, respectively (P = 0.11). There was a significant correlation in CD4+ T-cell proliferative responses (r = 0.90, P < 0.001) between FASCIA-WB and FASCIA-PBMC. Seven samples (50%) were reactive by the CD8+ T-cell FASCIA-PBMC and 4 (28.6%) by the CD8+ T-cell FASCIA-WB (P = 0.13). The mean (±SD) HIV-specific CD8+ T-cell proliferative responses detected by the FASCIA-PBMC and FASCIA-WB were 9.53% ± 13.58% and 7.50% ± 17.57%, respectively (P = 0.49).
FIG. 5.

CD4+ and CD8+ T-cell proliferation against AT-2-inactivated-HIV-1 antigen, as assessed by FASCIA-WB (circles) and FASCIA-PBMC (triangles), in 14 volunteers. %S values above 1.0% and 1.1% for CD4+ and CD8+ T cells, respectively, were considered to indicate positive responses in the FASCIA-WB. %S values above 2.4% and 2.8% for CD4+ and CD8+ T cells, respectively, were considered to indicate positive responses in the FASCIA-PMBC assay.
T-cell proliferative responses by vaccination group.
The overall HIV-specific T-cell proliferative response in the vaccinees employing any of the three assays was 100% (38/38). However, since only four or five volunteers were included in each vaccination subgroup (Table 1), no attempt was made to compare T-cell proliferative responses by HIV DNA immunization and HIV-MVA dose. We compared results for intramuscular (n = 19) and intradermal (n = 19) delivery of the HIV-MVA vaccine regardless of dose and HIV DNA priming. There was a borderline significance in reactivity by route of HIV-MVA immunization observed using the conventional [3H]thymidine uptake assay (P = 0.0597) or the CD4+ T-cell FASCIA-WB (P = 0.0597) (Fig. 6).
FIG. 6.
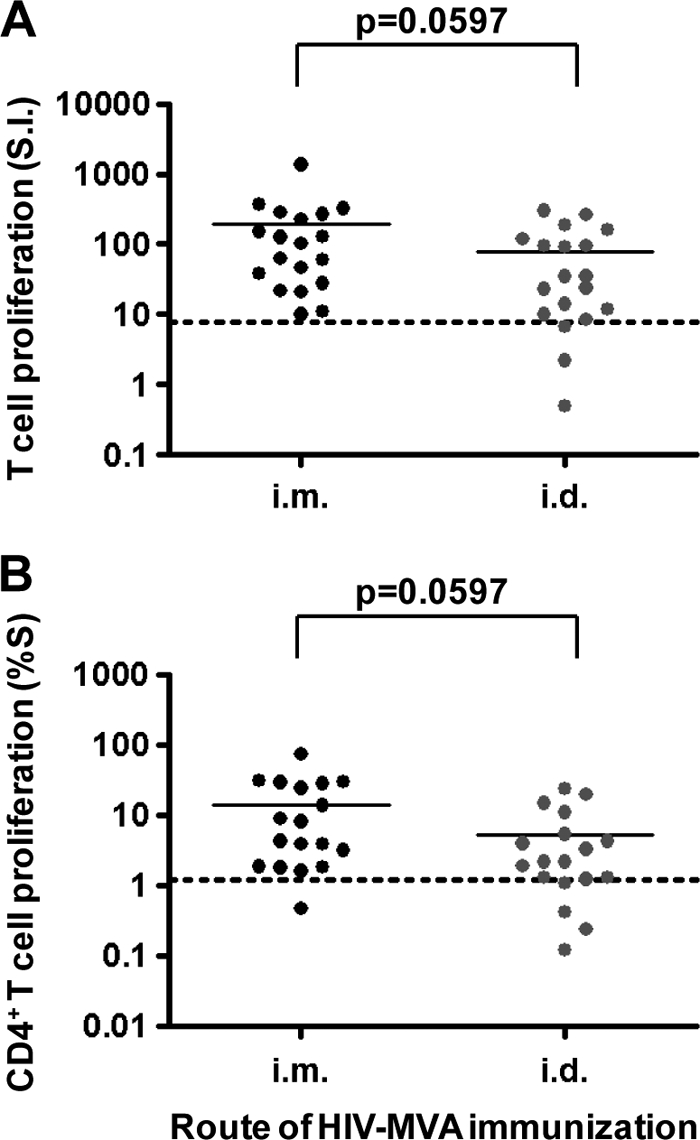
T-cell proliferative responses by route of HIV-MVA immunization as determined by the conventional [3H]thymidine uptake assay (A) and CD4+ T-cell FASCIA-WB (B).
DISCUSSION
While the CD8+ T cells provide the effector arm of the cell-mediated immune response, the CD4+ T cells influence their maturation and function, and an efficacious cell-based HIV vaccine will most likely have to induce both CD4+ and CD8+ T-cell responses. Additionally, HIV-specific CD4+ T cells should be capable of proliferating and expanding after antigen exposure in order to preserve the function of recall HIV-specific CD8+ T cells. In the current study, HIV-1 vaccine-induced lymphoproliferative responses were determined by using a conventional [3H]thymidine uptake assay and two flow-cytometric assays, the FASCIA-WB and the FASCIA-PBMC. The latter two assays allow further characterization of the proliferating cells by immunophenotyping. We found that the [3H]thymidine uptake assay detected a slightly higher number of responders (35/38) than the FASCIA-WB (33/38). We also detected a higher number of responders with HIV-specific CD8+ T-cell proliferative responses by FASCIA-PBMC than by FASCIA-WB (8/14 versus 4/14). Overall, T-cell proliferative responses were frequent and seen in both CD4+ T-cell and CD8+ T-cell compartments.
Our findings extend those reported by others testing DNA prime-poxvirus vector vaccine candidates in clinical trials. Goonetilleke and colleagues reported induction of HIV-1-specific T cells with proliferating capacity using [3H]thymidine incorporation in 5 of 8 volunteers receiving vaccines vectored by plasmid DNA and modified vaccinia virus Ankara expressing HIV-1 24/p17 gag linked to a string of CD8+ T-cell epitopes (10). Using CFSE labeling, an LPA that also allows detection of CD4+ and CD8+ T cells, the induction of CD4+ and CD8+ T-cell proliferation in response to Env- and Gag-specific stimulation was recently shown in three vaccinees receiving a recombinant DNA prime and boosting with the poxvirus vector NYVAC expressing the Env, Gag, Pol, and Nef polypeptide domain from HIV-1 (11).
This is the first report where FASCIA has been used for the assessment of vaccine-induced T-cell proliferative responses. In the current study, AT-2-treated-HIV-1 MN antigen (subtype B) was used in the T-cell proliferation assays and stimulation of both CD4+ and CD8+ T cells was detected, although CD4+ T cells were more frequent. AT-2 treatment results in elimination of infectivity with preservation of conformational and functional integrity of virion surface proteins including both virally encoded determinants and proteins derived from the host cells in which the virus was produced (19). In a recent study of 18 U.S. individuals infected with HIV-1 subtype B and 32 Ugandan individuals infected with subtypes A and D or recombinants AC and AD, both subtype-specific and cross-reactive responses were observed. Furthermore, as also shown here, AT-2-inactivated-HIV-1 antigen was reported to stimulate both CD4+ and CD8+ HIV-1-specific responses (20).
We detected a slightly higher number of responders in the [3H]thymidine uptake assay than in FASCIA-WB (35/38 versus 33/38). These findings suggested that the conventional [3H]thymidine uptake assay might be more sensitive than FASCIA-WB. In a study by Svahn and colleagues, FASCIA-WB displayed a sensitivity of 95% for the detection of varicella-zoster virus (VZV)-specific cell-mediated immune responses in VZV antibody-positive children with a history of chicken pox (23). We found a higher number of responders with HIV-specific CD8+ T-cell proliferative responses when using purified PBMC in the FASCIA, compared to using whole-blood FASCIA (8/14 versus 4/14). The FASCIA-PBMC is similar to the conventional [3H]thymidine uptake assay in that a defined number of cells (200,000/well) are activated. In the whole-blood assay (FASCIA-WB) the number of cells that are activated varies depending on the blood counts. Furthermore, in the FASCIA-WB all blood components, including antibodies, are present. Thus, the proliferating cells might be affected by the 7-day whole-blood culture environment.
The [3H]thymidine uptake assay is based on the incorporation of radioactive tritiated thymidine in newly synthesized DNA of dividing cells, while the FASCIA-WB and FASCIA-PBMC are based on the assessment of the number of antigen-specific lymphoblasts generated during the proliferation procedure. A main limitation of the [3H]thymidine uptake assay is that it measures only the total amount of DNA synthesis in bulk culture and does not allow phenotyping of proliferating cells. FASCIA-WB is less laborious and time-consuming, making it suitable for large-scale studies; it does not require the use of a radioactive substance and is advantageous over the [3H]thymidine uptake assay since it allows simultaneous phenotyping of the responsive T cells, identifying both CD4+ and CD8+ T cells. It can also be combined with characterization of the cytokine profile of responding cells using intracellular staining or examination of culture supernatants. However, formation of a microclot in the sample collection tube or in the culture tube might affect the final result of the assay. This applies for any whole-blood assay.
Utilization of a defined number of peripheral blood mononuclear cells (200,000 cells/well) and standardized culture conditions offers a greater possibility of assay standardization, including a reduced risk of reduced sensitivity due to the use of samples from lymphopenic individuals. In the FASCIA-WB, the number of PBMC used is not standardized and antibodies and other components that might inhibit the proliferation procedure are present in the culture. The FASCIA-PBMC has the combined advantages of the [3H]thymidine uptake assay and the FASCIA-WB: it uses a standardized number of PBMC and culture conditions; it allows further characterization of the responsive T cells by simultaneous phenotyping, intracellular cytokine staining, or analysis of culture supernatant; it does not use a radioactive substance; and it is potentially suitable for large-scale studies. Further evaluations of the FASCIA-PBMC in clinical trial settings are needed, and a comparison of the FASCIA-PBMC and CFSE labeling assay is ongoing in our laboratory.
In conclusion, strong HIV-1-specific CD4+ and CD8+ T-cell lymphoproliferative responses were demonstrated in a high proportion of volunteers in the HIVIS01/02 study following HIV-1 DNA/MVA immunization. A standardized FASCIA-PBMC, which allows simultaneous phenotyping, may be an alternative to the conventional [3H]thymidine uptake assay for assessment of vaccine-induced T-cell proliferation, especially in isotope-restricted settings.
Acknowledgments
We extend special thanks to the study volunteers. We also thank Bo Hejdeman for serving as the responsible study physician for the HIVIS trial; Andreas Bråve for participating in the development of the HIV DNA vaccine; Bernard Moss and Patricia Earl for design, construction, and characterization of the HIV MVA vector; Deborah Birx for the intellectual design, GMP production, and quality assurance (QA)/quality control (QC) of the MVA vaccine; Tom Van Cott for design, construction, cGMP manufacturing, release testing, and safety/toxicity studies as well as preclinical immunogenicity testing of the MVA; Josephine Cox for participation in the study design of the HIVIS trial and standardization of standard operating procedures and peptides; and Nelson Michael and Merlin Robb for MVA vaccine production and HIVIS trial protocol development.
This work was supported by funding from the Swedish International Development Cooperation Agency (Sida), Department for Research Cooperation, SAREC (SWE-2004-120 to C.N., HIV2004-000809 to G.B., and 2004:813 to G.B.), and the European Union (INCO-DEV A4 ICFP501A4PR03 to E.S.).
Footnotes
Published ahead of print on 12 May 2010.
REFERENCES
- 1.Betts, M. R., and A. Harari. 2008. Phenotype and function of protective T cell immune responses in HIV. Curr. Opin. HIV AIDS 3:349-355. [DOI] [PubMed] [Google Scholar]
- 2.Calarota, S. A., A. Foli, R. Maserati, F. Baldanti, S. Paolucci, M. A. Young, C. M. Tsoukas, J. Lisziewicz, and F. Lori. 2008. HIV-1 specific T cell precursors with high proliferative capacity correlate with low viremia and high CD4 counts in untreated individuals. J. Immunol. 180:5907-5915. [DOI] [PubMed] [Google Scholar]
- 3.Clerici, M., C. O. Tacket, C. S. Via, D. R. Lucey, S. C. Muluk, R. A. Zajac, R. N. Boswell, J. A. Berzofsky, and G. M. Shearer. 1991. Immunization with subunit human immunodeficiency virus vaccine generates stronger T helper cell immunity than natural infection. Eur. J. Immunol. 21:1345-1349. [DOI] [PubMed] [Google Scholar]
- 4.Cox, J. H., M. DeSouza, S. Ratto-Kim, G. Ferrari, K. Weinhold, and D. L. Birx. 2006. Cellular immunity assays for evaluation of vaccine efficacy, p. 301-314. In B. Detrick, R. G. Hamilton, and J. D. Folds (ed.), Manual of clinical laboratory immunology, 7th ed. ASM Press, Washington, DC.
- 5.Day, C. L., P. Kiepiela, A. J. Leslie, M. Van de Stok, N. Kriebashne, N. Ismail, I. Honeyborne, H. Crawford, H. M. Coovadia, P. J. Goulder, B. D. Walker, and P. Klenerman. 2007. Proliferative capacity of epitope-specific CD8 T-cell responses is inversely related to viral load in chronic human immunodeficiency virus type 1 infection. J. Virol. 81:434-438. [DOI] [PMC free article] [PubMed] [Google Scholar]
- 6.Di Rienzo, A. M., G. Furlini, R. Olivier, S. Ferris, J. Heeney, and L. Montagnier. 1994. Different proliferative response of human and chimpanzee lymphocytes after contact with human immunodeficiency virus type 1 gp120. Eur. J. Immunol. 24:34-40. [DOI] [PubMed] [Google Scholar]
- 7.Fulcher, D., and S. Wong. 1999. Carboxyfluorescein succinimidyl ester-based proliferative assays for assessment of T cell function in the diagnostic laboratory. Immunol. Cell Biol. 77:559-564. [DOI] [PubMed] [Google Scholar]
- 8.Gaines, H., L. Andersson, and G. Biberfeld. 1996. A new method for measuring lymphoproliferation at the single-cell level in whole blood cultures by flow cytometry. J. Immunol. Methods 195:63-72. [DOI] [PubMed] [Google Scholar]
- 9.Gehrz, R. C., and S. O. Knorr. 1979. Characterization of the role of mononuclear cell subpopulations in the in vitro lymphocyte proliferation assay. Clin. Exp. Immunol. 37:551-557. [PMC free article] [PubMed] [Google Scholar]
- 10.Goonetilleke, N., S. Moore, L. Dally, N. Winstone, I. Cebere, A. Mahmoud, S. Pinheiro, G. Gillespie, D. Brown, V. Loach, J. Roberts, A. Guimaraes-Walker, P. Hayes, K. Loughran, C. Smith, J. De Bont, C. Verlinde, D. Vooijs, C. Schmidt, M. Boaz, J. Gilmour, P. Fast, L. Dorrell, T. Hanke, and A. J. McMichael. 2006. Induction of multifunctional human immunodeficiency virus type 1 (HIV-1)-specific T cells capable of proliferation in healthy subjects by using a prime-boost regimen of DNA- and modified vaccinia virus Ankara-vectored vaccines expressing HIV-1 gag coupled to CD8+ T-cell epitopes. J. Virol. 80:4717-4728. [DOI] [PMC free article] [PubMed] [Google Scholar]
- 11.Harari, A., P. A. Bart, W. Stöhr, G. Tapia, M. Garcia, E. Medjitna-Rais, S. Burnet, C. Cellerai, O. Erlwein, T. Barber, C. Moog, P. Liljestrom, R. Wagner, H. Wolf, J. P. Kraehenbuhl, M. Esteban, J. Heeney, M. J. Frachette, J. Tartagha, S. McCormack, A. Babiker, J. Weber, and G. Pantaleo. 2008. An HIV-1 clade C DNA prime, NYVAC boost vaccine regimen induces reliable polyfunctional and long lasting responses. J. Exp. Med. 205:63-77. [DOI] [PMC free article] [PubMed] [Google Scholar]
- 12.Hirbod, T., R. Kaul, C. Reichard, J. Kimani, J. J. Bwayo, N. Nagelkerke, K. Hasselrot, B. Li, S. Moses, the Kibera study group, K. S. MacDonald, and K. Broliden. 2008. HIV-neutralizing immunoglobulin A and HIV-specific proliferation are independently associated with reduced HIV acquisition in Kenyan sex workers. AIDS 22:727-735. [DOI] [PubMed] [Google Scholar]
- 13.Horton, H., I. Frank, R. Baydo, E. Jalbert, J. Penn, S. Wilson, J. P. McNevin, M. D. McSweyn, D. Lee, Y. Huang, S. C. De Rosa, and M. J. McElrath. 2006. Preservation of T cell proliferation restricted by protective HLA alleles is critical for immune control of HIV-1 infection. J. Immunol. 177:7406-7415. [DOI] [PubMed] [Google Scholar]
- 14.James, S. P. 2001. Measurement of proliferative responses in cultured lymphocytes. Curr. Protoc. Immunol. (Suppl. 11):7.10.1-7.10.10. [DOI] [PubMed]
- 15.Lyons, A. B. 1999. Divided we stand: tracking cell proliferation with carboxyfluorescein diacetate succinimidyl ester. Immunol. Cell Biol. 77:509-515. [DOI] [PubMed] [Google Scholar]
- 16.Mehta, B. A., and V. C. Maino. 1997. Simultaneous detection of DNA synthesis and cytokine production in staphylococcal enterotoxin B activated CD4+ T lymphocytes by flow cytometry. J. Immunol. Methods 208:49-59. [DOI] [PubMed] [Google Scholar]
- 17.Migueles, S. A., A. C. Laborico, W. L. Shupert, M. S. Sabbaghian, R. Rabin, C. W. Hallahan, D. Van Baarle, S. Kostense, F. Miedema, M. McLaughlin, L. J. Ehler Metcalf, S. Liu, and M. Connors. 2002. HIV-specific CD8+ T cell proliferation is coupled to perforin expression and is maintained in nonprogressors. Nat. Immunol. 3:1061-1068. [DOI] [PubMed] [Google Scholar]
- 18.Rosenberg, E. S., J. M. Billingsley, A. M. Caliendo, S. L. Boswell, P. E. Sax, S. A. Kalams, and B. D. Walker. 1997. Vigorous HIV-1 specific CD4+ T cell responses associated with control of viremia. Science 278:1447-1450. [DOI] [PubMed] [Google Scholar]
- 19.Rossio, J. L., M. T. Esser, K. Suryanarayana, D. K. Schneider, J. W. Bess, Jr., G. M. Vasquez, T. A. Wiltrout, E. Chertora, M. K. Grumes, Q. Sattentau, L. O. Arthur, L. E. Henderson, and J. D. Lifson. 1998. Inactivation of human immunodeficiency virus type 1 infectivity with preservation of conformational and functional integrity of virion surface proteins. J. Virol. 72:7992-8001. [DOI] [PMC free article] [PubMed] [Google Scholar]
- 20.Rutebemberwa, A., J. W. Bess, Jr., B. Brown, M. Arroyo, M. Eller, B. Slike, V. Polonis, F. McCutchan, J. R. Currier, D. Birx, M. Robb, M. Marovich, J. D. Lifson, and J. H. Cox. 2007. Evaluation of aldrithiol-2-inactivated preparations of HIV type I subtypes A, B, and D as reagents to monitor T cell responses. AIDS Res. Hum. Retroviruses 23:532-542. [DOI] [PubMed] [Google Scholar]
- 21.Sandström, E., C. Nilsson, B. Hejdeman, A. Bråve, G. Bratt, M. Robb, J. Cox, T. VanCott, M. Marovich, R. Stout, S. Aboud, M. Bakari, K. Pallangyo, B. Moss, P. Earl, N. Michael, D. Birx, F. Mhalu, B. Wahren, and G. Biberfeld. 2008. Broad immunogenicity of a multigene, multiclade HIV-1 DNA vaccine boosted with heterologous HIV-1 recombinant modified vaccinia virus Ankara. J. Infect. Dis. 198:1482-1490. [DOI] [PMC free article] [PubMed] [Google Scholar]
- 22.Sikora, J., G. Dworacki, M. Trybus, H. Batura-Gabryel, and J. Zeromski. 1998. Correlation between DNA content, expression of Ki-67 antigen of tumor cells and immunophenotype of lymphocytes from malignant pleural effusions. Tumour Biol. 19:196-204. [DOI] [PubMed] [Google Scholar]
- 23.Svahn, A., A. Linde, R. Thorstensson, K. Karlén, L. Andersson, and H. Gaines. 2003. Development and evaluation of a flow-cytometric assay of specific cell-mediated immune response in activated whole blood for the detection of cell-mediated immunity against varicella-zoster virus. J. Immunol. Methods 277:17-25. [DOI] [PubMed] [Google Scholar]
- 24.Valentine, F. T., A. Paolino, A. Saito, and R. S. Holzman. 1998. Lymphocyte-proliferative responses to HIV antigens as a potential measure of immunological reconstitution in HIV disease. AIDS Res. Hum. Retroviruses 14(Suppl. 2):S161-S166. [PubMed] [Google Scholar]
- 25.Valentine, F. T., and M. A. Jacobson. 1990. Immunological and virological surrogate markers in the evaluation of therapies for HIV infection. AIDS 4(Suppl. 1):S201-S206. [PubMed] [Google Scholar]
- 26.Wahren, B., L. Morfeldt-Månsson, G. Biberfeld, L. Moberg, A. Sönnerborg, P. Ljungman, A. Werner, R. Kurth, R. Gallo, and D. Bolognesi. 1987. Characteristics of the specific cell-mediated immune respone in human immunodeficiency virus infection. J. Virol. 61:2017-2023. [DOI] [PMC free article] [PubMed] [Google Scholar]