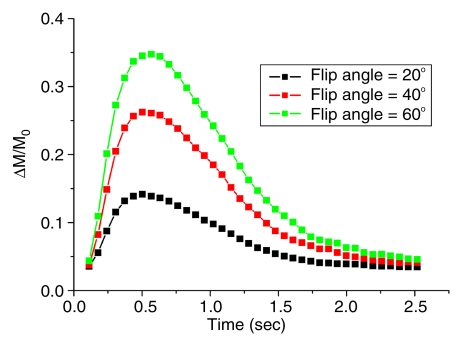
Figure 2b:
Mean dynamic MR angiography time courses from arterial regions of interest acquired with (a) three different inversion band thicknesses and (b, c) three different flip angles normalized to equilibrium blood signal intensity (M0), with data in c further scaled by the sine of the flip angle (a).

