

Abstract
After applauding the recent trend of employing receiver operating characteristic (ROC) analysis to measure diagnostic performance in large clinical studies, we discuss why Breast Imaging Reporting and Data System data should not be used to estimate ROC curves in screening mammography.
Introduction
Recently, a few large studies of clinical mammography (1–3) have used receiver operating characteristic (ROC) curves to quantify diagnostic performance. This is both welcome and encouraging, because the ROC curve is a meaningful measure of diagnostic accuracy (4,5) that has been used extensively in laboratory research (6) and may be expected to improve assessments of clinical performance. However, some of the recent clinical studies (2,3) reported ROC curves computed from data that had been collected by using the Breast Imaging Reporting and Data System (BI-RADS) assessment-category scale. In this article, we argue that BI-RADS data should not be used to estimate ROC curves.
BI-RADS is “a quality assurance tool designed to standardize mammographic reporting, reduce confusion in breast imaging interpretations and facilitate outcome monitoring” (7). The 3rd edition of the BI-RADS manual (7) defined six assessment categories: category 0 indicates need additional imaging evaluation; category 1, negative; category 2, benign finding; category 3, probably benign finding—short-interval follow-up suggested; category 4, suspicious abnormality—biopsy should be considered; and category 5, highly suggestive of malignancy—appropriate action should be taken. The current 4th edition of the manual divides category 4 into subcategories and adds category 6 (proved malignancy) (8). We focus on the 3rd edition of the BI-RADS manual here because it was used in the recent reports (1–3), but the issues that we discuss here also apply to the 4th edition of BI-RADS. Both editions of BI-RADS also state that both category 1 and category 2 indicate a “negative” mammogram with “no mammographic evidence of malignancy”; that category 3 should indicate “a very high probability of being benign”; and that the use of categories 4 and 5 should correspond to “definite” and “high” probabilities of malignancy, respectively (7).
ROC analysis requires fundamentally that diagnostic confidence in one decision class versus the other be reported on an ordinal scale, but the BI-RADS assessment categories do not constitute an ordinal scale. For example, BI-RADS category 2 (benign finding) does not imply greater suspicion of cancer than BI-RADS category 1 (negative), and BI-RADS category 0 (incomplete) does not imply less suspicion than any other BI-RADS category. Note that the pertinent question here is not whether more cancers, however few in number they may be, will eventually be discovered among cases that are given a BI-RADS category 2 assessment than among cases given a BI-RADS category 1 assessment, which may be true; instead, the key question at hand is whether radiologists intentionally use the BI-RADS category 2 assessment to differentiate cases of greater cancer suspicion from cases to which they give a BI-RADS category 1 assessment. We believe that the answer to the latter question is—or at least should be—“no,” because according to our understanding of the American College of Radiology guidelines (7), BI-RADS categories 1 and 2 were established as distinct categories solely for clinical reporting purposes: to distinguish cases with no abnormality to report from cases in which there are benign abnormalities to report but no concern regarding the possibility of cancer. Also, because BI-RADS categories 3, 4, and 5 are not designed for use in screening, radiologists who use only BI-RADS categories 0, 1, and 2 in screening are, in effect, reporting on a three-point scale, whereas radiologists who use all six categories are, in effect, reporting on a different, six-point scale.
Barlow et al (2) proposed the following ordering of the BI-RADS categories to obtain an ordinal scale: 1, 2, 3 (short-interval follow-up), 3+ (immediate follow-up), 0, 4, and 5. They showed that the cancer detection rate associated with this order of the BI-RADS ratings increases monotonically (Table). However, their argument confuses cancer yield with diagnostic confidence: ROC analysis requires that reported confidence in the presence of malignancy—not cancer yield—be ordinal. This distinction is important because the outcomes of cancer yield can, and do, disagree with diagnostic confidence. For example, BI-RADS categories 1 and 2 designate negative and benign findings, respectively, but some BI-RADS 1 and 2 cases will turn out to be cancer if any of the following is true: (a) the cancer is mammographically occult, (b) the cancer is not associated with the abnormality that the radiologist identifies (perceptual error), (c) the radiologist interprets the cancer incorrectly as benign (interpretational error), and/or (d) the radiologist thinks cancer is possible but misuses BI-RADS category 1 or 2. Therefore, the fact that cancer yield in BI-RADS 1 and 2 cases is nonzero does not prove that these BI-RADS categories have been used to designate diagnostic judgments indicative of cancer. BI-RADS categories 1 and 2 should not be separate entries of the confidence scale, because both indicate no suspicion for cancer. (Although BI-RADS categories 1 and 2 differ in their findings relevant to the presence of abnormality and are ordinal in that regard, they represent an identical diagnostic assessment that breast cancer is not present.) Furthermore, although it is plausible to insert BI-RADS category 0 between BI-RADS categories 3 and 4 for cases that require immediate recall rather than short-interval follow-up, this placement of BI-RADS category 0 is not plausible for cases that require only a comparison with prior images. Moreover, insofar as this placement of BI-RADS category 0 is based on post-hoc cancer yield rather than a priori justifications, the data do not add support to the proposed order. Finally, BI-RADS category 0 is often used in diagnostic mammography when the radiologist is not able to render a diagnostic opinion because of the need for additional information. Although the meaning of BI-RADS category 0 is less ambiguous in diagnostic mammography than in screening mammography, the inability of the radiologist to render a diagnosis means that BI-RADS category 0 must be placed aside from BI-RADS categories 1 (and, one might argue, 2), 3, 4, and 5 in terms of diagnostic confidence regarding the presence of cancer, rather than anywhere commensurate with that scale.
Cancer Yield according to BI-RADS Assessment Categories in Women with and Those without Breast Cancer
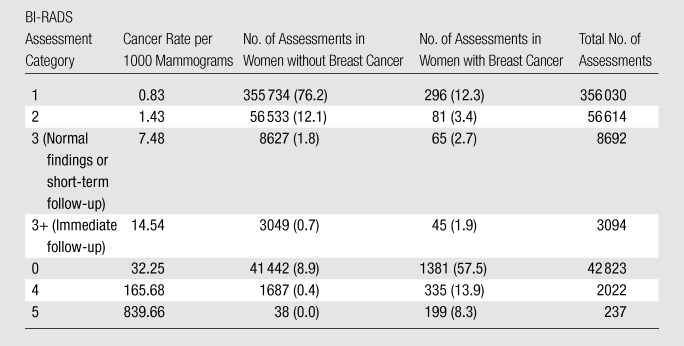
Note.—Adapted and reprinted, with permission, from reference 2. Data in parentheses are percentages.
What problems are caused by estimating ROC curves from BI-RADS data? In the Figure, we plot both an empirical ROC curve reported by Barlow et al (2) and the empirical ROC curve that is obtained from the same data if BI-RADS category 4 and 5 assessments are combined with those in BI-RADS category 0. This is equivalent to requiring that radiologists who use BI-RADS categories 4 and 5 in screening must report those cases instead as BI-RADS category 0 (“need additional imaging evaluation”). Moreover, we plot a third, hypothetical ROC curve that could have been obtained if BI-RADS categories 4 and 5 were used more frequently, rather than less frequently, in screening. A mathematical explanation of these ROC curves is provided in Appendix E1 (online). All three ROC curves depict the same diagnostic performance—that reported by Barlow et al (2)—yet the ROC curves differ substantially because of differences in the frequency with which BI-RADS categories 4 and 5 are used.

Graph shows effect of the frequency of screening use of BI-RADS categories 4 and 5 on the empirical ROC curve, based on data in the Table (2). Appendix E1 (online) describes the calculation of these empirical ROC curves. The trapezoidal areas under the empirical ROC curves (AUCs) ± standard errors of the estimate are 0.906 ± 0.004 (green), 0.885 ± 0.004 (red), and 0.876 ± 0.004 (teal). The maximum-likelihood proper binormal AUCs ± standard errors of the estimate are 0.913 ± 0.004 (green), 0.920 ± 0.003 (red), and 0.917 ± 0.004 (teal) (to improve legibility, the smooth ROC curve estimates are not shown). Monte Carlo simulation showed that, because these AUC estimates were obtained by variations in the analysis of a single data set and so were strongly correlated, the statistical significance of their differences was high. FPF = false-positive fraction, TPF = true-positive fraction (subscripted numbers = BI-RADS categories).
The problem described above also affects the empirical ROC operating point associated with BI-RADS category 3, but with a smaller detrimental effect because the screening use of BI-RADS category 3 is infrequent. Still another problem is that, because BI-RADS categories 1 and 2 both indicate no suspicion for cancer, splitting this single diagnostic confidence into distinct BI-RADS categories adds an artificial operating point to the empirical ROC curve. This artificial operating point potentially influences the task of estimating a smooth ROC curve. Given these problems, how can we modify the BI-RADS categories to make them ordinal? To do that, we must combine BI-RADS categories 0, 3, 4, and 5 together, and then also combine BI-RADS categories 1 and 2 together, thereby reducing the BI-RADS scale to two points, which give rise to a single empirical operating point on the ROC curve. Such an ROC curve would not be informative or reliable, because several decades of experience indicate that ROC curves in medical imaging must be specified by at least two parameters, and so must be estimated from at least two empirical operating points.
If one analyzes only diagnostic mammograms and excludes all screening mammograms, it is easier to modify the BI-RADS categories to make them ordinal. In this particular situation, one would need to combine BI-RADS categories 1 and 2, and then discard all cases assigned to BI-RADS category 0. (Although discarding cases assigned to BI-RADS category 0 may introduce bias that varies across imaging modalities, depending on the frequencies of technically inadequate studies and the amount of effort needed to read difficult cases, we ignore that issue here for simplicity.) The modified BI-RADS categories would then yield a four-point ordinal scale, giving rise to three empirical operating points from which an ROC curve could be estimated.
In summary, we applaud the use of ROC analysis in recent large clinical studies. However, to truly realize the benefit of this assessment method, one must estimate ROC curves appropriately, addressing additional issues that arise as ROC analysis migrates from the laboratory to the clinic. Hypothetical perturbation of results from a recent study indicates that BI-RADS data do not provide a reliable basis for estimating ROC curves in screening mammography. Although we appreciate the potential benefit of—and therefore, the motivation for—estimating ROC curves from existing clinical cases in which BI-RADS assessments are recorded, we must recommend caution until an approach is found that overcomes the problems we have identified here. Any future methodologic innovations in prospective clinical study design that will allow diagnostic confidence to be reported on a true ordinal scale without introducing additional bias are welcome and should be exploited to help address these problems.
Supplementary Material
Received August 13, 2009; revision requested September 23; revision received October 26; accepted December 21; final version accepted January 4, 2010. Y.J. receives research funding from Hologic. C.E.M. receives patent royalties from Abbott Laboratories, GE Medical Systems, MEDIAN Technologies, Hologic, Riverain Medical, Mitsubishi Space Software, and Toshiba.
The content of this article is solely the responsibility of the authors and does not necessarily represent the official views of any of the supporting organizations.
Funding: This research was supported in part by the National Institutes of Health (grants R01 CA092361 and R01 EB000863).
Supplemental material: http://radiology.rsna.org/lookup/suppl/doi:10.1148/radiol.10091394/-/DC1
References
- 1.Pisano ED, Gatsonis C, Hendrick E, et al. Diagnostic performance of digital versus film mammography for breast-cancer screening. N Engl J Med 2005;353(17):1773–1783 [DOI] [PubMed] [Google Scholar]
- 2.Barlow WE, Chi C, Carney PA, et al. Accuracy of screening mammography interpretation by characteristics of radiologists. J Natl Cancer Inst 2004;96(24):1840–1850 [DOI] [PMC free article] [PubMed] [Google Scholar]
- 3.Fenton JJ, Taplin SH, Carney PA, et al. Influence of computer-aided detection on performance of screening mammography. N Engl J Med 2007;356(14):1399–1409 [DOI] [PMC free article] [PubMed] [Google Scholar]
- 4.Fryback DG, Thornbury JR. The efficacy of diagnostic imaging. Med Decis Making 1991;11(2):88–94 [DOI] [PubMed] [Google Scholar]
- 5.The International Commission on Radiation Units and Measurements ICRU Report 79: Receiver operating characteristic analysis in medical imaging. J ICRU 2008;8(1):1–62 [Google Scholar]
- 6.Wagner RF, Metz CE, Campbell G. Assessment of medical imaging systems and computer aids: a tutorial review. Acad Radiol 2007;14(6):723–748 [DOI] [PubMed] [Google Scholar]
- 7.American College of Radiology Breast Imaging Reporting and Data System (BI-RADS) 3rd ed Reston, Va: American College of Radiology, 1998 [Google Scholar]
- 8.D’Orsi CJ, Bassett LW, Berg WA, et al. Breast Imaging Reporting and Data System: ACR BI-RADS-Mammography 4th ed Reston, Va: American College of Radiology, 2003 [Google Scholar]
Associated Data
This section collects any data citations, data availability statements, or supplementary materials included in this article.