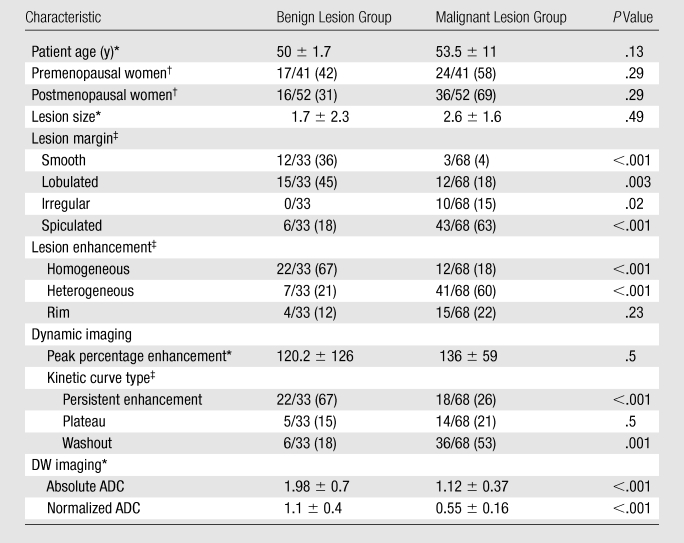
Table 1.
Characteristics of Patients and Breast Masses

Mean values ± standard deviations. P values were calculated by using t test.
Data are numbers of patients (n = 93), with percentages in parentheses. P values were calculated by using χ2 test.
Data are numbers of lesions (n = 101), with percentages in parentheses. P values were calculated by using χ2 test.
