

Noninvasive photoacoustic and US mapping of rat sentinel lymph nodes and lymphatic vessels was successfully demonstrated by using methylene blue dye with a modified clinical US imaging system.
Abstract
Purpose:
To evaluate in vivo sentinel lymph node (SLN) mapping by using photoacoustic and ultrasonographic (US) imaging with a modified clinical US imaging system.
Materials and Methods:
Animal protocols were approved by the Animal Studies Committee. Methylene blue dye accumulation in axillary lymph nodes of seven healthy Sprague-Dawley rats was imaged by using a photoacoustic imaging system adapted from a clinical US imaging system. To investigate clinical translation, the imaging depth was extended up to 2.5 cm by adding chicken or turkey breast on top of the rat skin surface. Three-dimensional photoacoustic images were acquired by mechanically scanning the US transducer and light delivery fiber bundle along the elevational direction.
Results:
Photoacoustic images of rat SLNs clearly help visualization of methylene blue accumulation, whereas coregistered photoacoustic/US images depict lymph node positions relative to surrounding anatomy. Twenty minutes following methylene blue injection, photoacoustic signals from SLN regions increased nearly 33-fold from baseline signals in preinjection images, and mean contrast between SLNs and background tissue was 76.0 ± 23.7 (standard deviation). Methylene blue accumulation in SLNs was confirmed photoacoustically by using the optical absorption spectrum of the dye. Three-dimensional photoacoustic images demonstrate dynamic accumulation of methylene blue in SLNs after traveling through lymph vessels.
Conclusion:
In vivo photoacoustic and US mapping of SLNs was successfully demonstrated with a modified clinical US scanner. These results raise confidence that photoacoustic and US imaging can be used clinically for accurate, noninvasive imaging of SLNs for axillary lymph node staging in breast cancer patients.
© RSNA, 2010
Introduction
Sentinel lymph node (SLN) biopsy (SLNB) has emerged as the preferred method for axillary lymph node staging of breast cancer patients with clinically negative axillary lymph nodes (1–3). The first lymph nodes receiving drainage from the tumor are defined as SLNs and are most likely to be positive for metastases. The general process of SLNB includes the following: (a) identification of SLNs by using radioactive colloids (eg, technetium 99m sulfur colloid) and invasive visual confirmation of SLNs by using blue dyes (eg, isosulfan blue or methylene blue), (b) surgical resection of SLNs, and (c) histologic assessment of excised SLNs. If pathologic results for SLNs are negative, then full axillary lymph node dissection can be avoided. High identification rates (90%–97%) and low false-negative rates (5%–10%) can be achieved with SLNB following injection of radioactive tracers and blue dye (4–6).
Although SLNB aids in the reduction of morbidity and side effects, as compared with axillary lymph node dissection, it still remains an invasive surgical procedure with potential postoperative complications, which include lymphedema, seroma formation, sensory nerve injury, and range-of-motion limitations (7,8). In a clinical trial, researchers found that, in 74.2% (3989 of 5379) of breast cancer patients who underwent SLN resection, findings were pathologically negative (9). For most of the patients who undergo SLNB, a noninvasive or minimally invasive alternative could be used effectively for staging the axillary lymph nodes without requiring surgical intervention. Furthermore, with conventional SLNB, ionizing radiation is used to identify SLNs, so a solution without ionizing radiation would be advantageous.
The capability to noninvasively identify SLNs would allow targeted needle biopsies for definitive diagnosis in breast cancer patients. The combination of ultrasonography (US)-guided fine-needle aspiration biopsy (FNAB) and molecular analysis by using real-time reverse transcription–polymerase chain reaction is emerging as a viable, minimally invasive alternative to SLNB (10–13). Although axillary US imaging can provide morphologic information, such as size and shape of lymph nodes, it cannot be used to specifically identify SLNs, reducing the sensitivity of US-guided FNAB (14). Noninvasive fluorescence imaging has been used to identify SLNs by using indocyanine green dye (15–17). Despite the use of nonionizing radiation, this technique requires surgical isolation of lymph nodes because of its poor depth penetration.
Photoacoustic imaging is a nonionizing and noninvasive hybrid imaging technique that can supply strong optical absorption contrasts with high US spatial resolution (18,19). Photoacoustic imaging relies on the photoacoustic effect for generating pressure waves under thermal and stress confinement conditions. A short pulsed laser is used to irradiate tissue, causing optical absorption, rapid thermoelastic expansion, and acoustic pressure wave generation. For photoacoustic imaging in the diffusive regimen, spatial resolution is determined by the acoustic detector, and both image resolution and depth are highly scalable with the US frequency. Since US scattering is two to three orders of magnitude less than optical scattering on the basis of per-unit path length, photoacoustic imaging can break through the fundamental limitation of existing pure optical imaging (20–23). With the use of intrinsic contrast agents such as hemoglobin or melanin, photoacoustic tomography can be used to image both morphology (eg, vascular structures, angiogenesis, tumors, and internal organs) (24,25) and function (eg, tumor hypoxia and dynamic brain activities) (18,19,26,27). Moreover, exogenous contrast agents, such as organic dyes, nanoparticles, reporter genes, and fluorescent proteins, have enabled photoacoustic molecular imaging (26,28–31). A tabletop photoacoustic imaging system that is based on mechanical raster scanning has been applied to identify rat SLNs in vivo by using methylene blue dye, gold nanoparticles, and single-walled carbon nanotubes (32–35). However, the imaging speed of this system (approximately 8 minutes for a 24 × 24-mm2 field of view) limits its clinical applicability owing to mechanical scanning.
Our purpose was to evaluate in vivo SLN mapping by using photoacoustic and US imaging with a modified clinical US imaging system.
Materials and Methods
Three authors (T.N.E., L.J., M.D.P.) are employees of Philips Research North America (Briarcliff Manor, NY). Authors who are not employees of industry (C.K., L.V.W.) maintained control of the data that could have been a conflict for the industry authors. One author (L.V.W.) has a financial interest in Microphotoacoustics (Ronkonkoma, NY) and Endra (Ann Arbor, Mich), which, however, did not support this work.
Animal and Dye Preparation
Animal protocols were approved by the Animal Studies Committee, and animal handling was performed according to the Guide for the Care and Use of Laboratory Animals. Animal experiments were conducted between March 12, 2009, and May 26, 2009. Seven healthy Sprague-Dawley rats (Harlan Laboratories, Indianapolis, Ind; weight range, 250–390 g) were initially anesthetized by using a mixture of ketamine (Ketaset, Fort Dodge Animal Health, Fort Dodge, Iowa) at a dose of 85 mg/kg and xylazine (AnaSed; Akorn, Decatur, Ill) at a dose of 15 mg/kg. The hair in the left axillary region was gently depilated before imaging. Photoacoustic and US images were collected before and after a 0.1-mL intradermal injection of a 1% (10 mg/mL) solution of methylene blue dye (American Regent, Shirley, NY), at 10 mg/mL, in the left forepaw pad. In the animals, full anesthesia was maintained throughout the experiment by using isoflurane gas, administered with 1 L/min of oxygen and 0.75% of isoflurane (Euthanex, Palmer, Pa). Simultaneously, both heart rate and saturation of peripheral oxygen were monitored by using a pulse oximeter (8600V; Nonin Medical, Plymouth, Minn). After imaging, animals were euthanized with an overdose of pentobarbital (Sleepaway; Fort Dodge Animal Health), and SLNs were dissected.
US Imaging System
A photoacoustic imaging system (Fig 1) was built around a clinical US imaging system (iU22; Philips Healthcare, Andover, Mass) (36). The modified channel-board architecture allowed access to raw per-channel photoacoustic data, while all imaging capabilities of an actual commercial US scanner were retained. Raw photoacoustic and US data were transferred to a custom-built data acquisition system for image display and postprocessing, providing dual-modality imaging capability. Photoacoustic images were reconstructed by using a Fourier beam-forming algorithm (37) implemented in software (Matlab; MathWorks, Natick, Mass), generating a photoacoustic B-mode image from one laser shot. A field-programmable gate array–based electronic board synchronized data acquisition with the laser firing. Photoacoustic data capture at a frame rate of 10 frames per second was limited by the current laser repetition rate (described next) but ultimately can be enhanced to 50 frames per second with a suitable laser source. Beam-formed photoacoustic images can be displayed at a frame rate of approximately 1 frame per second, limited by image reconstruction.
Figure 1:

Experimental setup of photoacoustic imaging system adapted from a modified US imaging system. x = X-axis, y = y-axis, z = z-axis.
The system can use all standard iU22 array transducers for both photoacoustic and US imaging. For this study, three focused US array transducers were used: the phased-array S5-1 probe (80 elements, 1–5 MHz) and two linear-array probes, L8-4 (128 elements, 4–8 MHz) and L15-7io (128 elements, 7–15 MHz).
Photoacoustic Imaging System
Light from a tunable dye laser (ND6000; Continuum, Santa Clara, Calif), pumped by a Q-switched Nd:YAG laser (Brilliant B; Quantel, Les Ulis, France) with a 6.5-nanosecond pulse duration and a 10-Hz pulse repetition rate, was delivered through a high-temperature epoxy, multimode fiber bundle (Schott Fiber Optics, Southbridge, Mass). The optical wavelength was tunable between 606 and 678 nm, which covered the peak optical absorption wavelength of methylene blue (667 nm). Unless otherwise noted, photoacoustic images were acquired by using 658-nm light. On the basis of the laser power spectrum, this wavelength produced the strongest photoacoustic signals from methylene blue. The light fluence on the skin was less than 5 mJ/cm2, well within American National Standards Institute safety limits (38).
The fiber bundle was physically attached to a US probe to enable dual-modality photoacoustic and US imaging. The final optical illumination pattern on the skin surface was rectangle shaped (3 × 1 cm along the x-axis and y-axis, respectively). The imaging plane of the US probe was coaxially aligned with the oblique incidence (approximately 45°) of the rectangle-shaped optical beam on the targeted area. The photoacoustic probe was partially immersed in a water tank, which had an opening at the bottom sealed with a thin, disposable, clear membrane. Rats were placed below the water tank, in contact with the membrane by means of US coupling gel.
Experimental Procedures
Photoacoustic and US images were collected before and after methylene blue injection in seven healthy Sprague-Dawley rats. Photoacoustic monitoring of the SLN following methylene blue injection continued for a mean of 77 minutes ± 30 (standard deviation), with a range of 33–113 minutes. Of the seven rats, three were imaged with the L15-7io probe, two were imaged with the S5-1 probe, and two were imaged with the L8-4 probe.
Spectroscopic photoacoustic imaging can be used to determine the presence of methylene blue dye without the need for a preinjection baseline image. Spectroscopic photoacoustic imaging (n = 7) was performed by using eight optical wavelengths between 607 and 678 nm to confirm that measured photoacoustic spectra of SLNs matched the optical absorption spectrum of methylene blue (39). Thirty photoacoustic images were collected at each optical wavelength to determine the effect of shot-to-shot variations in laser pulse energy.
To investigate clinical translation at deeper imaging depths in humans, 2 cm of biologic tissue (chicken or turkey breast) was added on top of the skin of two rats, one imaged with the S5-1 probe and one imaged with the L8-4 probe. Pre- and postinjection photoacoustic and US images were acquired with the added tissue in place. For spectroscopic photoacoustic imaging, the unknown optical attenuation spectrum of additional biologic tissue can affect the fluence at the lymph node. Measured photoacoustic spectra from SLNs were normalized by the photoacoustic spectrum point by point from a small tube filled with methylene blue placed between the rat skin and the overlying tissue.
Three-dimensional (3D) photoa-coustic images of SLNs and lymph vessels in three rats were acquired by mechanically scanning the photoacoustic probe along the elevational direction (y-axis). Two rats were imaged by using the L15-7io probe, and one was imaged by using the L8-4 probe. The photoacoustic probe was scanned by a motion controller (ILS200PP; Newport, Irvine, Calif) and translation stage (ESP300; Newport) in steps of 0.5 mm over a scanning distance of 2.5 cm, for a total field of view of 2.3 × 2.5 × 5 cm. The total acquisition time for a 3D acquisition was 10 minutes. Photoacoustic maximum amplitude projection (MAP) images were reconstructed by first removing the skin signal and then projecting the remaining maximum signal amplitude along each A-line onto the corresponding x-y plane. Volumetric photoacoustic images also were reconstructed by using software (VolView; Kitware, Clifton Park, NY).
Image Display
Coregistered images displayed photoacoustic signals by using a pseudo-color map ranging from blue to red over gray-scale B-mode US images. Photoacoustic signals below a threshold value were suppressed in coregistered images to aid interpretation. The threshold value was 9% of the peak photoacoustic signal from the SLN for images acquired without additional overlying biologic tissue, whereas a threshold value of 30% was chosen for images with overlying tissue. Suitable threshold values were chosen on the basis of the signal-to-noise ratio of the photoacoustic signal from the SLN, which decreases at increasing depths.
Photoacoustic MAP images in the x-y plane were displayed before and after methylene blue injection. All MAP images were displayed by using the same dynamic range, color map, and magnification. A composite color map consisting of gray-scale and blue portions was chosen to easily visualize the blood vessels, the lymph vessels, and the lymph node in the same image. The blue color map displayed signal amplitudes greater than the maximum signal amplitude observed in the preinjection image to appreciate areas of enhanced signal amplitudes following methylene blue injection.
Statistical Analysis
Photoacoustic images were analyzed by using the nonparametric Wilcoxon signed rank test to compare signal amplitudes from SLN regions before and after methylene blue injection. P values were computed from a one-tailed distribution and were considered to indicate a significant difference if they were less than .05. Photoacoustic signal enhancement was defined as the ratio between post- and preinjection signal amplitudes from SLN regions. Photoacoustic contrast was defined as the ratio between signal amplitudes from SLNs and tissue background. Correlation coefficients were computed between measured photoacoustic spectra from SLNs and the optical absorption spectrum of methylene blue. All statistical analysis was performed by using software (Matlab; MathWorks) with statistical tools (Statistics Toolbox; MathWorks).
Results
Preinjection photoacoustic B-mode images feature photoacoustic signals from superficial blood vessels and skin surfaces. Soon after injection, methylene blue accumulates in SLNs, as detected photoacoustically (Fig 2). Pre- and postinjection images for each probe displayed with the same dynamic range demonstrate strong photoacoustic signal from SLNs following accumulation of methylene blue. Coregistered photoacoustic and US images demonstrate the capability to combine functional (photoacoustic) and structural (US) features for SLN mapping.
Figure 2a:

Noninvasive photoacoustic B-mode images of SLNs show results from each probe from a different rat acquired in vivo with (a–c) S5-1 probe, (d–f) L8-4 probe, and (g–i) L15-7io probe. (a, d, g) Control photoacoustic images acquired before methylene blue injection. (b, e, h) Photoacoustic images acquired 20 minutes following methylene blue injection. (c, f, i) Coregistered photoacoustic and US images acquired 20 minutes following methylene blue injection. X = x-axis, Z = z-axis.
Figure 2b:

Noninvasive photoacoustic B-mode images of SLNs show results from each probe from a different rat acquired in vivo with (a–c) S5-1 probe, (d–f) L8-4 probe, and (g–i) L15-7io probe. (a, d, g) Control photoacoustic images acquired before methylene blue injection. (b, e, h) Photoacoustic images acquired 20 minutes following methylene blue injection. (c, f, i) Coregistered photoacoustic and US images acquired 20 minutes following methylene blue injection. X = x-axis, Z = z-axis.
Figure 2c:

Noninvasive photoacoustic B-mode images of SLNs show results from each probe from a different rat acquired in vivo with (a–c) S5-1 probe, (d–f) L8-4 probe, and (g–i) L15-7io probe. (a, d, g) Control photoacoustic images acquired before methylene blue injection. (b, e, h) Photoacoustic images acquired 20 minutes following methylene blue injection. (c, f, i) Coregistered photoacoustic and US images acquired 20 minutes following methylene blue injection. X = x-axis, Z = z-axis.
Figure 2d:

Noninvasive photoacoustic B-mode images of SLNs show results from each probe from a different rat acquired in vivo with (a–c) S5-1 probe, (d–f) L8-4 probe, and (g–i) L15-7io probe. (a, d, g) Control photoacoustic images acquired before methylene blue injection. (b, e, h) Photoacoustic images acquired 20 minutes following methylene blue injection. (c, f, i) Coregistered photoacoustic and US images acquired 20 minutes following methylene blue injection. X = x-axis, Z = z-axis.
Figure 2e:

Noninvasive photoacoustic B-mode images of SLNs show results from each probe from a different rat acquired in vivo with (a–c) S5-1 probe, (d–f) L8-4 probe, and (g–i) L15-7io probe. (a, d, g) Control photoacoustic images acquired before methylene blue injection. (b, e, h) Photoacoustic images acquired 20 minutes following methylene blue injection. (c, f, i) Coregistered photoacoustic and US images acquired 20 minutes following methylene blue injection. X = x-axis, Z = z-axis.
Figure 2f:

Noninvasive photoacoustic B-mode images of SLNs show results from each probe from a different rat acquired in vivo with (a–c) S5-1 probe, (d–f) L8-4 probe, and (g–i) L15-7io probe. (a, d, g) Control photoacoustic images acquired before methylene blue injection. (b, e, h) Photoacoustic images acquired 20 minutes following methylene blue injection. (c, f, i) Coregistered photoacoustic and US images acquired 20 minutes following methylene blue injection. X = x-axis, Z = z-axis.
Figure 2g:

Noninvasive photoacoustic B-mode images of SLNs show results from each probe from a different rat acquired in vivo with (a–c) S5-1 probe, (d–f) L8-4 probe, and (g–i) L15-7io probe. (a, d, g) Control photoacoustic images acquired before methylene blue injection. (b, e, h) Photoacoustic images acquired 20 minutes following methylene blue injection. (c, f, i) Coregistered photoacoustic and US images acquired 20 minutes following methylene blue injection. X = x-axis, Z = z-axis.
Figure 2h:

Noninvasive photoacoustic B-mode images of SLNs show results from each probe from a different rat acquired in vivo with (a–c) S5-1 probe, (d–f) L8-4 probe, and (g–i) L15-7io probe. (a, d, g) Control photoacoustic images acquired before methylene blue injection. (b, e, h) Photoacoustic images acquired 20 minutes following methylene blue injection. (c, f, i) Coregistered photoacoustic and US images acquired 20 minutes following methylene blue injection. X = x-axis, Z = z-axis.
Figure 2i:

Noninvasive photoacoustic B-mode images of SLNs show results from each probe from a different rat acquired in vivo with (a–c) S5-1 probe, (d–f) L8-4 probe, and (g–i) L15-7io probe. (a, d, g) Control photoacoustic images acquired before methylene blue injection. (b, e, h) Photoacoustic images acquired 20 minutes following methylene blue injection. (c, f, i) Coregistered photoacoustic and US images acquired 20 minutes following methylene blue injection. X = x-axis, Z = z-axis.
A sample postmortem photograph of the rat axillary region imaged during experiments is shown in Figure 3. The methylene blue–dyed SLN was visually identified in the left axilla. Lymph nodes were typically 3 × 2 mm in size.
Figure 3:
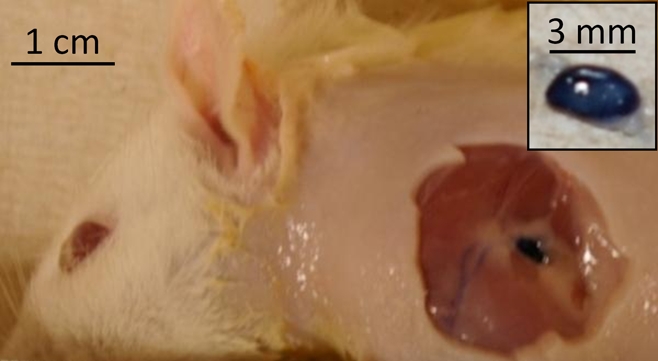
Postmortem photograph of rat acquired after photoacoustic imaging and skin removal. Inset: Dissected SLN stained by using methylene blue. Skin was removed after rat was euthanized and imaging experiments were complete.
When imaging depth was increased by adding biologic tissue (either turkey or chicken breast tissue) on top of the rat skin surface, lymph nodes were imaged 2.4 cm and 2.5 cm below the top surface of the overlying tissue with the S5-1 (Fig 4) and L8-4 probes, respectively. Optical spectra that were based on photoacoustic signals from SLNs closely matched the optical absorption spectrum of methylene blue, confirming the presence of methylene blue in detected lymph nodes (R = 0.995).
Figure 4a:

Coregistered photoacoustic and US B-mode images of rat SLNs acquired in vivo with added biologic tissue for increased imaging depth. (a) SLN image acquired with S5-1 probe through additional 2-cm turkey breast 22 minutes following methylene blue injection. X = x-axis, Z = z-axis. (b) Graph shows confirmation of methylene blue accumulation in SLNs by using spectroscopic photoacoustic imaging. Error bars = standard deviation from 30 photoacoustic images collected at each optical wavelength, MB Abs = methylene blue absorption, PA = photoacoustic.
Figure 4b:

Coregistered photoacoustic and US B-mode images of rat SLNs acquired in vivo with added biologic tissue for increased imaging depth. (a) SLN image acquired with S5-1 probe through additional 2-cm turkey breast 22 minutes following methylene blue injection. X = x-axis, Z = z-axis. (b) Graph shows confirmation of methylene blue accumulation in SLNs by using spectroscopic photoacoustic imaging. Error bars = standard deviation from 30 photoacoustic images collected at each optical wavelength, MB Abs = methylene blue absorption, PA = photoacoustic.
Three-dimensional photoacoustic images illustrate the propagation of methylene blue from lymph vessels to SLNs (Fig 5). Baseline MAP images acquired prior to methylene blue injection show the network of blood vessels in rat axillae. Soon after methylene blue injection, photoacoustic signals from the lymph vessel and SLN increase six and 17 times from preinjection baseline amplitudes, respectively. As methylene blue travels from the lymph vessel to the SLN between 6 and 31 minutes after injection, the mean signal amplitude from the lymph node increases by 30.6%, whereas the mean signal amplitude from the lymph vessel decreases by 48.6%. Signal amplitudes from blood vessels remained largely unchanged after injection.
Figure 5a:

In vivo photoacoustic MAP images of rat axillary region. (a) Control photoacoustic MAP image collected prior to methylene blue injection. BV = blood vessel, X = x-axis, Y = y-axis. (b, c, d) Photoacoustic MAP images collected 6, 20, and 31 minutes following methylene blue injection, respectively. Blue color map is used to display signal intensities above the maximum amplitude from the preinjection image. Color bar pertains to images a–d. LV = lymph vessel. (e) Volumetric photoacoustic image of rat axilla 20 minutes following methylene blue injection. Z = z-axis. (f) Graph shows dynamic changes in photoacoustic signal amplitudes from SLN, lymph vessel, and blood vessel. Following methylene blue injection, signal intensities from SLN and lymph vessel increase strongly, and over time, the SLN signal continues to increase while lymph vessel signal decreases as methylene blue travels from the lymph vessel and accumulates in the lymph node. No substantial changes were observed in blood vessel signal amplitudes. Error bars = standard deviation from multiple pixels in each region of interest.
Figure 5b:

In vivo photoacoustic MAP images of rat axillary region. (a) Control photoacoustic MAP image collected prior to methylene blue injection. BV = blood vessel, X = x-axis, Y = y-axis. (b, c, d) Photoacoustic MAP images collected 6, 20, and 31 minutes following methylene blue injection, respectively. Blue color map is used to display signal intensities above the maximum amplitude from the preinjection image. Color bar pertains to images a–d. LV = lymph vessel. (e) Volumetric photoacoustic image of rat axilla 20 minutes following methylene blue injection. Z = z-axis. (f) Graph shows dynamic changes in photoacoustic signal amplitudes from SLN, lymph vessel, and blood vessel. Following methylene blue injection, signal intensities from SLN and lymph vessel increase strongly, and over time, the SLN signal continues to increase while lymph vessel signal decreases as methylene blue travels from the lymph vessel and accumulates in the lymph node. No substantial changes were observed in blood vessel signal amplitudes. Error bars = standard deviation from multiple pixels in each region of interest.
Figure 5c:

In vivo photoacoustic MAP images of rat axillary region. (a) Control photoacoustic MAP image collected prior to methylene blue injection. BV = blood vessel, X = x-axis, Y = y-axis. (b, c, d) Photoacoustic MAP images collected 6, 20, and 31 minutes following methylene blue injection, respectively. Blue color map is used to display signal intensities above the maximum amplitude from the preinjection image. Color bar pertains to images a–d. LV = lymph vessel. (e) Volumetric photoacoustic image of rat axilla 20 minutes following methylene blue injection. Z = z-axis. (f) Graph shows dynamic changes in photoacoustic signal amplitudes from SLN, lymph vessel, and blood vessel. Following methylene blue injection, signal intensities from SLN and lymph vessel increase strongly, and over time, the SLN signal continues to increase while lymph vessel signal decreases as methylene blue travels from the lymph vessel and accumulates in the lymph node. No substantial changes were observed in blood vessel signal amplitudes. Error bars = standard deviation from multiple pixels in each region of interest.
Figure 5d:

In vivo photoacoustic MAP images of rat axillary region. (a) Control photoacoustic MAP image collected prior to methylene blue injection. BV = blood vessel, X = x-axis, Y = y-axis. (b, c, d) Photoacoustic MAP images collected 6, 20, and 31 minutes following methylene blue injection, respectively. Blue color map is used to display signal intensities above the maximum amplitude from the preinjection image. Color bar pertains to images a–d. LV = lymph vessel. (e) Volumetric photoacoustic image of rat axilla 20 minutes following methylene blue injection. Z = z-axis. (f) Graph shows dynamic changes in photoacoustic signal amplitudes from SLN, lymph vessel, and blood vessel. Following methylene blue injection, signal intensities from SLN and lymph vessel increase strongly, and over time, the SLN signal continues to increase while lymph vessel signal decreases as methylene blue travels from the lymph vessel and accumulates in the lymph node. No substantial changes were observed in blood vessel signal amplitudes. Error bars = standard deviation from multiple pixels in each region of interest.
Figure 5e:

In vivo photoacoustic MAP images of rat axillary region. (a) Control photoacoustic MAP image collected prior to methylene blue injection. BV = blood vessel, X = x-axis, Y = y-axis. (b, c, d) Photoacoustic MAP images collected 6, 20, and 31 minutes following methylene blue injection, respectively. Blue color map is used to display signal intensities above the maximum amplitude from the preinjection image. Color bar pertains to images a–d. LV = lymph vessel. (e) Volumetric photoacoustic image of rat axilla 20 minutes following methylene blue injection. Z = z-axis. (f) Graph shows dynamic changes in photoacoustic signal amplitudes from SLN, lymph vessel, and blood vessel. Following methylene blue injection, signal intensities from SLN and lymph vessel increase strongly, and over time, the SLN signal continues to increase while lymph vessel signal decreases as methylene blue travels from the lymph vessel and accumulates in the lymph node. No substantial changes were observed in blood vessel signal amplitudes. Error bars = standard deviation from multiple pixels in each region of interest.
Figure 5f:

In vivo photoacoustic MAP images of rat axillary region. (a) Control photoacoustic MAP image collected prior to methylene blue injection. BV = blood vessel, X = x-axis, Y = y-axis. (b, c, d) Photoacoustic MAP images collected 6, 20, and 31 minutes following methylene blue injection, respectively. Blue color map is used to display signal intensities above the maximum amplitude from the preinjection image. Color bar pertains to images a–d. LV = lymph vessel. (e) Volumetric photoacoustic image of rat axilla 20 minutes following methylene blue injection. Z = z-axis. (f) Graph shows dynamic changes in photoacoustic signal amplitudes from SLN, lymph vessel, and blood vessel. Following methylene blue injection, signal intensities from SLN and lymph vessel increase strongly, and over time, the SLN signal continues to increase while lymph vessel signal decreases as methylene blue travels from the lymph vessel and accumulates in the lymph node. No substantial changes were observed in blood vessel signal amplitudes. Error bars = standard deviation from multiple pixels in each region of interest.
Photoacoustic signal amplitudes from SLNs increase significantly following methylene blue injection (P < .008). In five rats in which measurements were made without overlying biologic tissue, the mean photoacoustic signal enhancement of SLNs at 20 minutes after injection was 32.7 ± 7.2 (range, 25.3– 41.8) from preinjection baseline signals, and the mean contrast of SLNs relative to tissue background was 76.0 ± 23.7 (range, 46.1–112.2). In two rats in which measurements were made with overlaid biologic tissue, the photoacoustic signal enhancement values were 5.4 (S5-1 probe) and 3.7 (L8-4 probe), and the contrast values were 8.3 (S5-1 probe) and 4.6 (L8-4 probe).
Discussion
Noninvasive photoacoustic and US imaging have been used to map rat SLNs following methylene blue injection. This technique is highly translatable because it demonstrates photoacoustic detection of SLNs by using a modified clinical US imaging system, and methylene blue is used clinically in the United States during SLNB. Three US probes were used to successfully image uptake of methylene blue in SLNs and enable selection according to imaging requirements. As in conventional US, photoacoustic imaging depends on US probe frequency and bandwidth to determine spatial resolution, depth penetration, and sensitivity.
Rat axillary lymph nodes are superficial, in most cases only 1.5–3.0 mm below the skin surface. Human axillary lymph nodes are deeper but larger. Photoacoustic SLN mapping was demonstrated at an imaging depth of 2.5 cm, without any signal averaging, by adding biologic tissue on top of the rat axillary skin. The investigators in a previous study (32) of photoacoustic SLN mapping in rats by using methylene blue reported a similar imaging depth of 2 cm without signal averaging and 3.1 cm with 50 times signal averaging. In the current study, optical fluence on the skin was less than 5 mJ/cm2, which can be increased by a factor of four while still conforming to the maximal permissible exposure allowed by American National Standards Institute limits (20 mJ/cm2) (38). Because photoacoustic signal strength depends on optical fluence and absorption, stronger optical fluence will enable photoacoustic SLN detection at even greater depths. Therefore, photoacoustic imaging should be capable of aiding in the noninvasive detection of axillary SLNs at most depths encountered in humans. Successful noninvasive photoacoustic mapping of rat SLNs through 2.5 cm of tissue motivates further evaluation of this technique and imaging devices in future trials in humans.
Our study had limitations. In current experiments, photoacoustic and US images are acquired in a water tank with the optical fiber bundle positioned close to the US probe, which is mounted on a mechanical translation stage. For clinical translation, freehand US is preferred. In the next phase of development, light delivery will be integrated with the US probe to enable freehand scanning during photoacoustic and US image acquisition. In addition, 3D photoacoustic images were acquired by mechanically scanning the photoacoustic probe, resulting in slow acquisition times (approximately 10 minutes for a 2.3 × 2.5 × 5-cm field of view). Faster 3D images could be obtained by using positional tracking of the transducer position during freehand scanning to accommodate larger fields of view. Finally, turkey and chicken breast tissue used to increase imaging depth may have lower blood content than human breast tissue. The penetration depth for photoacoustic imaging of SLNs will be more accurately assessed in human subjects during upcoming clinical experiments.
In summary, noninvasive photoacoustic and US mapping of rat SLNs and lymphatic vessels has been successfully demonstrated by using methylene blue dye with a modified clinical US imaging system.
Practical application: The results from this study are an important step toward clinical translation of photoacoustic imaging for noninvasive SLN detection. Two key features of this technique are as follows: (a) The multimodality system for photoacoustic imaging is based on a modified clinical US scanner, and (b) it employs a dye that is routinely used in clinical practice. Both features reduce potential barriers that could otherwise hinder its clinical translation. A noninvasive method for accurately mapping axillary SLNs in breast cancer patients could be used to guide FNAB. In some patients, axillary US imaging can help to identify abnormal-appearing lymph nodes on the basis of morphologic features. Needle biopsy can be performed in these instances but only a positive result is informative. Negative results from needle biopsies do not help to rule out the presence of malignancy. The ability to noninvasively identify SLNs would enable proper evaluation of targeted needle biopsy, with molecular analysis by using real-time reverse transcription-polymerase chain reaction for definitive diagnosis, in all patients. Combined photoacoustic and US-guided FNAB of SLNs potentially could eliminate the need for invasive axillary staging procedures.
Advance in Knowledge.
Noninvasive photoacoustic and US imaging can help in mapping rat sentinel lymph nodes (SLNs) and lymph vessels by using methylene blue dye in vivo.
Implication for Patient Care.
The dual-modality photoacoustic and US imaging system can potentially be used clinically to guide fine-needle aspiration biopsies of SLNs for axillary lymph node staging in breast cancer patients.
Acknowledgments
We thank John Dean, MS, Viktor Gornstein, MS, and Adam Schleicher, BS (Philips Research North America, Briarcliff Manor, NY), for modifying the US imaging system used for photoacoustic imaging and Feng Gao, PhD (Washington University School of Medicine, St Louis, Mo), for assistance with statistical analysis.
Received October 2, 2009; revision requested November 9; final revision received December 16; accepted January 11, 2010; final version accepted January 18.
Funding: This research was supported by the National Institutes of Health (grants U54 CA136398, R01 EB000712, R01 NS46214, and R01 EB008085).
See Materials and Methods for pertinent disclosures.
See also Science to Practice in this issue.
Abbreviations:
- FNAB
- fine-needle aspiration biopsy
- MAP
- maximum amplitude projection
- SLN
- sentinel lymph node
- SLNB
- SLN biopsy
- 3D
- three-dimensional
References
- 1.Krag DN, Weaver DL, Alex JC, Fairbank JT. Surgical resection and radiolocalization of the sentinel lymph node in breast cancer using a gamma probe. Surg Oncol 1993;2(6):335–339; discussion 340 [DOI] [PubMed] [Google Scholar]
- 2.Giuliano AE, Kirgan DM, Guenther JM, Morton DL. Lymphatic mapping and sentinel lymphadenectomy for breast cancer. Ann Surg 1994;220(3):391–398; discussion 398–401 [DOI] [PMC free article] [PubMed] [Google Scholar]
- 3.Albertini JJ, Lyman GH, Cox C, et al. Lymphatic mapping and sentinel node biopsy in the patient with breast cancer. JAMA 1996;276(22):1818–1822 [PubMed] [Google Scholar]
- 4.Krag D, Weaver D, Ashikaga T, et al. The sentinel node in breast cancer: a multicenter validation study. N Engl J Med 1998;339(14):941–946 [DOI] [PubMed] [Google Scholar]
- 5.Kim T, Giuliano AE, Lyman GH. Lymphatic mapping and sentinel lymph node biopsy in early-stage breast carcinoma: a metaanalysis. Cancer 2006;106(1):4–16 [DOI] [PubMed] [Google Scholar]
- 6.McMasters KM, Tuttle TM, Carlson DJ, et al. Sentinel lymph node biopsy for breast cancer: a suitable alternative to routine axillary dissection in multi-institutional practice when optimal technique is used. J Clin Oncol 2000;18(13):2560–2566 [DOI] [PubMed] [Google Scholar]
- 7.Swenson KK, Nissen MJ, Ceronsky C, Swenson L, Lee MW, Tuttle TM. Comparison of side effects between sentinel lymph node and axillary lymph node dissection for breast cancer. Ann Surg Oncol 2002;9(8):745–753 [DOI] [PubMed] [Google Scholar]
- 8.Purushotham AD, Upponi S, Klevesath MB, et al. Morbidity after sentinel lymph node biopsy in primary breast cancer: results from a randomized controlled trial. J Clin Oncol 2005;23(19):4312–4321 [DOI] [PubMed] [Google Scholar]
- 9.Krag DN, Anderson SJ, Julian TB, et al. Technical outcomes of sentinel-lymph-node resection and conventional axillary-lymph-node dissection in patients with clinically node-negative breast cancer: results from the NSABP B-32 randomised phase III trial. Lancet Oncol 2007;8(10):881–888 [DOI] [PubMed] [Google Scholar]
- 10.Krishnamurthy S, Sneige N, Bedi DG, et al. Role of ultrasound-guided fine-needle aspiration of indeterminate and suspicious axillary lymph nodes in the initial staging of breast carcinoma. Cancer 2002;95(5):982–988 [DOI] [PubMed] [Google Scholar]
- 11.Holwitt DM, Swatske ME, Gillanders WE, et al. Scientific Presentation Award: The combination of axillary ultrasound and ultrasound-guided biopsy is an accurate predictor of axillary stage in clinically node-negative breast cancer patients. Am J Surg 2008;196(4):477–482 [DOI] [PMC free article] [PubMed] [Google Scholar]
- 12.Schoenfeld A, Luqmani Y, Smith D, et al. Detection of breast cancer micrometastases in axillary lymph nodes by using polymerase chain reaction. Cancer Res 1994;54(11):2986–2990 [PubMed] [Google Scholar]
- 13.Noguchi S, Aihara T, Nakamori S, et al. The detection of breast carcinoma micrometastases in axillary lymph nodes by means of reverse transcriptase-polymerase chain reaction. Cancer 1994;74(5):1595–1600 [DOI] [PubMed] [Google Scholar]
- 14.Koelliker SL, Chung MA, Mainiero MB, Steinhoff MM, Cady B. Axillary lymph nodes: US-guided fine-needle aspiration for initial staging of breast cancer—correlation with primary tumor size. Radiology 2008;246(1):81–89 [DOI] [PubMed] [Google Scholar]
- 15.Kitai T, Inomoto T, Miwa M, Shikayama T. Fluorescence navigation with indocyanine green for detecting sentinel lymph nodes in breast cancer. Breast Cancer 2005;12(3):211–215 [DOI] [PubMed] [Google Scholar]
- 16.Miyashiro I, Miyoshi N, Hiratsuka M, et al. Detection of sentinel node in gastric cancer surgery by indocyanine green fluorescence imaging: comparison with infrared imaging. Ann Surg Oncol 2008;15(6):1640–1643 [DOI] [PubMed] [Google Scholar]
- 17.Sevick-Muraca EM, Sharma R, Rasmussen JC, et al. Imaging of lymph flow in breast cancer patients after microdose administration of a near-infrared fluorophore: feasibility study. Radiology 2008;246(3):734–741 [DOI] [PMC free article] [PubMed] [Google Scholar]
- 18.Zhang HF, Maslov K, Stoica G, Wang LV. Functional photoacoustic microscopy for high-resolution and noninvasive in vivo imaging. Nat Biotechnol 2006;24(7):848–851 [DOI] [PubMed] [Google Scholar]
- 19.Wang X, Pang Y, Ku G, Xie X, Stoica G, Wang LV. Noninvasive laser-induced photoacoustic tomography for structural and functional in vivo imaging of the brain. Nat Biotechnol 2003;21(7):803–806 [DOI] [PubMed] [Google Scholar]
- 20.Denk W, Strickler JH, Webb WW. Two-photon laser scanning fluorescence microscopy. Science 1990;248(4951):73–76 [DOI] [PubMed] [Google Scholar]
- 21.Huang D, Swanson EA, Lin CP, et al. Optical coherence tomography. Science 1991;254(5035): 1178–1181 [DOI] [PMC free article] [PubMed] [Google Scholar]
- 22.Singh A, Gopinathan K. Confocal microscopy: a powerful technique for biological research. Curr Sci 1998;74(10): 841–851 [Google Scholar]
- 23.Zeff BW, White BR, Dehghani H, Schlaggar BL, Culver JP. Retinotopic mapping of adult human visual cortex with high-density diffuse optical tomography. Proc Natl Acad Sci U S A 2007;104(29):12169–12174 [DOI] [PMC free article] [PubMed] [Google Scholar]
- 24.Ku G, Wang X, Xie X, Stoica G, Wang LV. Imaging of tumor angiogenesis in rat brains in vivo by photoacoustic tomography. Appl Opt 2005;44(5):770–775 [DOI] [PubMed] [Google Scholar]
- 25.Song KH, Wang LV. Noninvasive photoacoustic imaging of the thoracic cavity and the kidney in small and large animals. Med Phys 2008;35(10):4524–4529 [DOI] [PMC free article] [PubMed] [Google Scholar]
- 26.Li M, Oh J, Xie X, et al. Simultaneous molecular and hypoxia imaging of brain tumors in vivo using spectroscopic photoacoustic tomography. Proc IEEE 2008;96(3):481–489 [Google Scholar]
- 27.Stein EW, Maslov K, Wang LV. Noninvasive, in vivo imaging of blood-oxygenation dynamics within the mouse brain using photoacoustic microscopy. J Biomed Opt 2009;14(2):020502. [DOI] [PMC free article] [PubMed] [Google Scholar]
- 28.De la Zerda A, Zavaleta C, Keren S, et al. Carbon nanotubes as photoacoustic molecular imaging agents in living mice. Nat Nanotechnol 2008;3(9):557–562 [DOI] [PMC free article] [PubMed] [Google Scholar]
- 29.Li L, Zemp RJ, Lungu G, Stoica G, Wang LV. Photoacoustic imaging of lacZ gene expression in vivo. J Biomed Opt 2007;12(2):020504. [DOI] [PubMed] [Google Scholar]
- 30.Pan D, Pramanik M, Senpan A, et al. Molecular photoacoustic tomography with colloidal nanobeacons. Angew Chem Int Ed Engl 2009;48(23):4170–4173 [DOI] [PMC free article] [PubMed] [Google Scholar]
- 31.Razansky D, Distel M, Vinegoni C, et al. Multispectral opto-acoustic tomography of deep-seated fluorescent proteins in vivo. Nat Photonics 2009;3(7):412–417 [Google Scholar]
- 32.Song KH, Stein EW, Margenthaler JA, Wang LV. Noninvasive photoacoustic identification of sentinel lymph nodes containing methylene blue in vivo in a rat model. J Biomed Opt 2008;13(5):054033. [DOI] [PMC free article] [PubMed] [Google Scholar]
- 33.Song KH, Kim C, Cobley CM, Xia Y, Wang LV. Near-infrared gold nanocages as a new class of tracers for photoacoustic sentinel lymph node mapping on a rat model. Nano Lett 2009;9(1):183–188 [DOI] [PMC free article] [PubMed] [Google Scholar]
- 34.Song KH, Kim C, Maslov K, Wang LV. Noninvasive in vivo spectroscopic nanorod-contrast photoacoustic mapping of sentinel lymph nodes. Eur J Radiol 2009;70(2):227–231 [DOI] [PMC free article] [PubMed] [Google Scholar]
- 35.Pramanik M, Song KH, Swierczewska M, Green D, Sitharaman B, Wang LV. In vivo carbon nanotube-enhanced non-invasive photoacoustic mapping of the sentinel lymph node. Phys Med Biol 2009;54(11):3291–3301 [DOI] [PMC free article] [PubMed] [Google Scholar]
- 36.Dean J, Gornstein V, Burcher M, Jankovic L. Real-time photoacoustic data acquisition with Philips iU22 ultrasound scanner. In: Oraevsky AA, Wang LV, eds. Proceedings of SPIE: medical imaging 2008—photons plus ultrasound: imaging and sensing 2008: The Ninth Conference on Biomedical Thermoacoustics, Optoacoustics, and Acousto-optics Vol 6856 Bellingham, Wash: International Society for Optical Engineering, 2008; 685622–685622-11 [Google Scholar]
- 37.Köstli KP, Frenz M, Bebie H, Weber HP. Temporal backward projection of optoacoustic pressure transients using fourier transform methods. Phys Med Biol 2001;46(7):1863–1872 [DOI] [PubMed] [Google Scholar]
- 38.American National Standards Institute American national standard for the safe use of lasers. ANSI z136.1-2007 Orlando, Fla: Laser Institute of America, 2007 [Google Scholar]
- 39.Prahl S. Optical absorption of methylene blue. Oregon Medical Laser Center Web site. http://omlc.ogi.edu/spectra/mb/index.html. Published 2001. Updated 2007 Accessed March 13, 2009