

Adjusted multivariate models used to evaluate anatomic MR imaging indicated that the presence of a lesion that was suggestive of cancer conferred a greater risk (hazard ratio, 4.0; 95% confidence interval: 1.1, 14.9) of Gleason score upgrade at subsequent biopsy.
Abstract
Purpose:
To determine the role that magnetic resonance (MR) imaging and MR spectroscopic imaging findings obtained at the time of diagnosis play in the progression of disease in patients whose prostate cancer is being managed with active surveillance and to compare the role of these findings with the role of transrectal ultrasonography (US) findings.
Materials and Methods:
The institutional review board approved this HIPAA-compliant retrospective study, and informed consent was obtained from all patients whose records were to be entered into the research database. All patients who had prostate cancer managed with active surveillance and who had undergone both MR imaging and MR spectroscopic imaging of the prostate and transrectal US at time of diagnosis were identified. Two urologists blinded to the clinical outcome in these patients independently reviewed and dichotomized the MR imaging report and the MR spectroscopic imaging report as normal or suggestive of malignancy. One experienced urologist performed all US examinations that were then dichotomized similarly. Uni- and multivariate (with use of standard clinical variables) Cox models were fitted to assess time to cancer progression, defined as Gleason score upgrading, prostate-specific antigen velocity of more than 0.75 (μg L−1)/y, or initiation of treatment more than 6 months after diagnosis.
Results:
The final cohort included 114 patients with a median follow-up of 59 months. Patients with a lesion that was suggestive of cancer at MR imaging had a greater risk of the Gleason score being upgraded at subsequent biopsy (hazard ratio, 4.0; 95% confidence interval: 1.1, 14.9) than did patients without such a lesion. Neither MR spectroscopic imaging nor transrectal US could be used to predict cancer progression.
Conclusion:
Abnormal prostate MR imaging results suggestive of cancer may confer an increased risk of Gleason score upgrade at subsequent biopsy. Although expensive, prostate MR imaging may help in counseling potential candidates about active surveillance.
© RSNA, 2010
Introduction
Although men with low-risk prostate cancer have an extremely small risk of prostate cancer–specific mortality (1), only 9% pursue active surveillance for initial management of the disease (2). Treatment decisions are complicated by the inability to predict which lesions will remain indolent and which are clinically important. To help with risk assessment at diagnosis, cancer biomarkers are needed.
There is a rapidly growing body of literature describing advances in techniques for magnetic resonance (MR) imaging of the prostate and assessment of the clinical usefulness of prostate MR imaging with MR spectroscopic imaging (3). It is of incremental value to standard clinical parameters, weighted in nomograms, to predict unfavorable disease, such as extracapsular invasion (4) and seminal vesicle invasion (5), and favorable disease, such as organ-confined disease (6) and insignificant disease at prostatectomy (7). Diffusion-weighted MR imaging also may be a useful marker of prostate cancer aggressiveness (8,9).
However, the long-term role of MR imaging and MR spectroscopic imaging in the context of active surveillance has not been well studied. The purpose of our study was to determine the role that MR imaging and MR spectroscopic imaging findings obtained at the time of diagnosis play in the progression of disease in patients whose prostate cancer is being managed with active surveillance and to compare the role of these findings with the role of transrectal ultrasonography (US) findings.
Materials and Methods
Study Subjects
Data collection and study protocol were approved by the institutional review board. Informed consent was obtained from all study participants before their data were entered into our Health Insurance Portability and Accountability Act–compliant database. We used a retrospective cohort study design. Men who had received a diagnosis of prostate cancer during the period from 1992 through 2007, had been prospectively enrolled in our active surveillance protocol for at least 6 months, had provided consent for research, and had undergone prostate MR imaging, MR spectroscopic imaging, and transrectal US were included. All men had Gleason grade 6 adenocarcinoma, clinical stage lower than T2c, prostate-specific antigen (PSA) level less than 20 μg/L, and fewer than 33% of biopsy cores positive for cancer. We excluded 11 men because they were missing risk data at diagnosis and three men because they had high-risk cancer (primary Gleason pattern 4 at biopsy [n = 2] or PSA level >20 μg/L [n = 1]). Patients were followed-up with PSA measurements and digital rectal examinations every 3–6 months and with transrectal US at 6- to 12-month intervals. Patients routinely underwent repeated prostate biopsy at 12- to 24-month intervals on the basis of patient preference; some patients—in whom cancer progression was suspected on the basis of serum PSA velocity, digital rectal examination results, or transrectal US results—underwent repeated prostate biopsy even earlier and at shorter intervals (10).
MR Imaging and Hydrogen 1 Spectroscopic Imaging Technique
All patients underwent MR imaging and MR spectroscopic imaging after diagnostic prostate biopsy was performed. The median time between diagnostic transrectal US and performance of biopsy was 109 days. The routine MR imaging and MR spectroscopic imaging protocol at our institution usually mandates an 8-week wait time after biopsy is performed to minimize any artifacts related to hemorrhage or other tissue distortion from performance of the biopsy. MR studies were performed with a 1.5-T whole-body MR imager (Signa; GE Medical Systems, Milwaukee, Wis). Patients underwent imaging in a supine position. The body coil was used for excitation, and a pelvic phased-array coil (GE Medical Systems) in combination with a commercially available balloon-covered expandable endorectal coil (Medrad, Pittsburgh, Pa) was used for signal reception. MR imaging sequences included thin-section nominal high-spatial-resolution transverse and coronal T2-weighted fast spin-echo imaging of the prostate and seminal vesicles with the following parameters: repetition time msec/echo time msec, 5000/96 (effective); echo train length, 16; section thickness, 3 mm; intersection gap, 0 mm; field of view, 14 cm; matrix, 256 × 192; frequency-encoding direction, anteroposterior (to prevent obscuration of the prostate by endorectal coil motion artifact); and number of signals acquired, three. Transverse spin-echo T1-weighted images were obtained from the aortic bifurcation to the symphysis pubis by using the following parameters: 700/8; section thickness, 5 mm; intersection gap, 1 mm; field of view, 24 cm; matrix, 256 × 192; frequency-encoding direction, transverse (to prevent obscuration of pelvic nodes by endorectal coil motion artifact); and number of signals acquired, one.
After review of the transverse T2-weighted images, an MR spectroscopic imaging volume was selected to maximize coverage of the prostate and minimize the inclusion of periprostatic fat and rectal air. The imaging volume was selected by two trained spectroscopists, each of whom had 7 years of experience, supervised by one of the authors (J.K., 20 years of experience in prostate spectroscopic imaging). Three-dimensional MR spectroscopic imaging data were acquired by using a water- and lipid-suppressed double spin-echo point-resolved spectroscopy sequence, with spectral-spatial pulses for the two 180° excitation pulses, that was optimized for the quantitative detection of choline, creatine, polyamines, and citrate. The spectral-spatial pulses enabled both sharp volume selection and frequency selection to reduce the water resonance and suppress lipid resonances (11,12). The influence of chemical shift on the apparent location of the selected volume was reduced by the high spectral bandwidth of the spectral-spatial pulses (11,12). Outer voxel saturation pulses were used to further sharpen volume selection and conform the selected volume to the shape of the prostate to eliminate susceptibility artifact from periprostatic fat and rectal air (13). Data sets were acquired as 16 × 8 × 8 phase-encoded spectral arrays (1000/130, 1024 voxels with a spatial resolution of 0.34 cm3) with a 17-minute acquisition time. All spectral data were apodized with a 2-Hz Lorentzian function. Data were Fourier transformed in the time domain and in three spatial domains with phase, baseline, and frequency corrections. MR spectroscopic imaging data, including the spectra and associated metabolic ratios, were overlaid on the corresponding transverse T2-weighted images. The total examination time was 1 hour, including coil placement and patient positioning. For technical reasons (patient movement), results from three MR spectroscopic imaging examinations could not be interpreted and were excluded from the MR spectroscopic imaging–specific analyses.
MR Image and MR Spectroscopic Image Interpretation
One of six attending radiologists specialized in abdominal imaging (F.V.C.) used established morphologic criteria to interpret prostate MR images at the time of examination (14). To best assess the pragmatic role of the imaging modalities, no central review of images by radiologists was conducted for this study; instead, radiology reports were interpreted independently by two urology clinicians (V.F., A.K.; urologic oncology fellows at the University of California, San Francisco, with 8 and 7 years, respectively, of experience in urology) who were blinded to outcomes. Coding was dichotomized as normal versus suggestive of cancer (encompassing a possible or probable cancerous lesion). Interobserver agreement between the two urologist readers was assessed by using the κ statistic. Level of agreement was defined as follows: A κ value of 0–0.20 indicated poor agreement; a κ value of 0.21–0.40, fair agreement; a κ value of 0.41–0.60, moderate agreement; a κ value of 0.61–0.80, good agreement; and a κ value of 0.81–1.00, very good agreement. Agreement was reached by means of consensus review of the 10 and 11 discordant interpretations, respectively, for MR imaging and MR spectroscopic imaging data. For the combined MR image and MR spectroscopic image analysis, any abnormal lesion was coded as suggestive of cancer.
Transrectal US Imaging Technique and Interpretation
Transrectal US was performed, and the results were interpreted by a urologist (K.S., more than 25 years of experience) who was highly experienced with transrectal US using a biplanar variable-frequency (5.0–10 MHz) probe (Hawk 2102 XDI and Pro Focus UltraView, BK Medical, Herlev, Denmark; Hi Vision 5500, Hitachi Medical Systems America, Twinsburg, Ohio). Scans were performed in both transverse and longitudinal planes continuously, and representative images were recorded. Color Doppler imaging was performed in every patient, with the filter adjusted to detect slow-flow velocity. If US-guided biopsy was performed, local anesthesia was administered with 1% lidocaine prostate block, followed by performance of biopsy. This included at least 14 random samples or was targeted at lesions visible at US but not at MR imaging.
Transrectal US images were interpreted (K.S.) at the time of examination, and the presence of any hypoechoic or hypervascular lesion suggestive of cancer was dichotomized and recorded for each sextant. This experienced estimation was based on multiple factors: the intraprostatic location, echogenicity, shape, clear delineation of the lesion, and lesion vascularity. These data were stored in our urologic oncology database. Because of the many technical difficulties of modeling transrectal US data and with the goal of matching the MR imaging and MR spectroscopic imaging data scheme, the presence of lesions suggestive of tumor was dichotomized (yes or no) at the time of statistical analysis (J.E.C., V.F.; 15 and 3 years, respectively, of experience in biostatistics).
Statistical Analysis
To evaluate for possible selection bias, we compared patients in our active surveillance program who were referred for MR imaging and included in the present study with patients undergoing active surveillance who did not undergo MR imaging and MR spectroscopic imaging. The variables were categorized by using the cutoffs shown in Table 1, and χ2 statistics were calculated.
Table 1.
Characteristics of Study Subjects and Subjects Who Did Not Undergo MR Imaging

Note.—Data are numbers of patients who underwent imaging at our institution and numbers of patients who we know did not undergo imaging at any institution. Data in parentheses are percentages. Missing values occur in some characteristic categories when the number of patients does not add up to the total.
P values were calculated on basis of χ2 test result.
Outcome variables were defined by change in PSA velocity, Gleason grade, and treatment regimen. PSA velocity was calculated by using the sum of the difference between all PSA values divided by the time between first and last PSA value considered. High PSA velocity was defined as PSA velocity greater than or equal to 0.75 (μg L−1)/y. Gleason score upgrade was defined as an increase in Gleason score to 7 or higher at follow-up biopsy. We did not distinguish between the 3 + 4 and 4 + 3 patterns in this analysis. Active treatment was defined as any treatment performed 6 or more months after the start of active surveillance. A summary progression variable indicated whether a patient had any of the three outcomes. Time between diagnosis and occurrence of outcome was computed and was censored at last follow-up in the absence of an outcome event.
Cox proportional hazards models were used to estimate the risk of cancer progression. Separate models were built for each of the following imaging modalities: anatomic MR imaging, MR spectroscopic imaging, combined MR imaging and MR spectroscopic imaging, and transrectal US. Covariates included in our models were age at diagnosis, year of diagnosis, D’Amico risk category, number of biopsy cores obtained at diagnosis, percentage of positive biopsy cores at diagnosis, and PSA density. PSA density was converted to a logarithmic scale to normalize its distribution. Time from diagnosis to MR imaging and MR spectroscopic imaging and ethnicity were not different across imaging findings categories and were not significant when included in the models; thus, we excluded them from our final multivariate models.
Variables that could confound the observed association were scrutinized. The distribution by year of diagnosis, stratified according to anatomic MR imaging findings, of the following variables was examined: number of biopsy cores, percentage of positive biopsy cores, and incidence of repeated biopsy. All P values were two sided, and P < .05 was considered to indicate a significant difference. All analyses were performed with software (SAS version 9.1; SAS Institute, Cary, NC).
Results
From 407 patients undergoing active surveillance who consented to research, the final study population consisted of all 114 patients who also underwent MR imaging and MR spectroscopic imaging. The median follow-up period was 59 months (range, 3–175 months). Mean age was 63.4 years ± 7.9 (standard deviation), and mean PSA level at diagnosis was 6.4 μg/L ± 3.4. Patients included in our study did not differ from those who were excluded in terms of demographic or clinical characteristics (Table 1), with the exception of clinical stage and year of diagnosis. Patients who underwent MR imaging and MR spectroscopic imaging were less likely to have stage T1c cancer and to have received a diagnosis in 2003 or later than were the patients at low or intermediate risk who did not undergo imaging and were undergoing active surveillance at our institution (n = 211). Patients included in the present study had a similar distribution across years of diagnosis of the number of biopsy cores, percentage of positive biopsy cores, and incidence of repeated biopsy as did all the other patients at low or intermediate risk undergoing active surveillance who did not undergo MR imaging and MR spectroscopic imaging.
On the basis of MR imaging and MR spectroscopic imaging at time of diagnosis, 69% (79 of 114) of patients had an anatomic lesion suggestive of cancer, and all lesions were confined to the prostate; 61% (68 of 111) had metabolic activity suggestive of cancer; and 75% (86 of 114) had either of these abnormalities. A detailed examination of lesions at MR imaging and MR spectroscopic imaging (Table 2) showed that, relative to MR imaging, seven additional lesions were abnormal only at MR spectroscopic imaging, thereby reducing the number of normal images. In contrast, only 35% (40 of 114) of patients had a lesion that was detectable with transrectal US at time of diagnosis. A good level of agreement was observed across the two readers interpreting each radiologic report, with κ scores of 0.79 and 0.72, respectively, for anatomic MR imaging and MR spectroscopic imaging.
Table 2.
Anatomic MR Imaging versus MR Spectroscopic Imaging Findings at Time of Diagnosis

Note.—Data are the number of patients.
Adjusted multivariate models used to evaluate anatomic MR imaging indicated that the presence of a lesion that was suggestive of cancer conferred a greater risk (hazard ratio, 4.0; 95% confidence interval: 1.1, 14.9) of Gleason score upgrade at subsequent biopsy (Fig 1). Associations with start of active treatment (hazard ratio, 3.4; 95% confidence interval: 1.0, 12.0) and high PSA velocity (hazard ratio, 1.0; 95% confidence interval: 0.3, 3.6) were not significant (Table 3).
Figure 1:

Flowchart shows Gleason score upgrade findings at repeated prostate biopsy.
Table 3.
Risk of Cancer Progression Assessed with Various Imaging Techniques at Time of Diagnosis

Note.—Data are presented as hazard ratio from Cox regression models adjusted for age at diagnosis, cancer risk, year of diagnosis, PSA density, number of biopsy cores obtained, and percentage of positive biopsy cores at diagnosis by means of anatomic MR imaging, MR spectroscopic imaging, or transrectal US. Data in parentheses are 95% confidence intervals.
Imaging technique indicates lesion or metabolic activity suggestive of cancer.
First occurrence of Gleason score upgrade of 7 or greater, start of active treatment, or PSA velocity greater than 0.75 (μg L−1)/y.
P < .05.
Adjusted multivariate models used to evaluate MR spectroscopic imaging indicated that metabolic activity suggestive of cancer conferred a nonsignificant increased risk of all three outcomes (Gleason score upgrade, start of active treatment, and high PSA velocity). Adjusted multivariate models used to evaluate the combination of MR imaging and MR spectroscopic imaging and those used to evaluate transrectal US showed no significant associations across all three outcomes (Table 3). When modeling the summary progression variable as the outcome criterion, only anatomic MR imaging was significantly associated with the outcome. The presence of a lesion suggestive of cancer conferred a greater risk of combined cancer progression (hazard ratio, 2.7; 95% confidence interval: 1.1, 6.7), as shown in Figures 2 and 3.
Figure 2a:

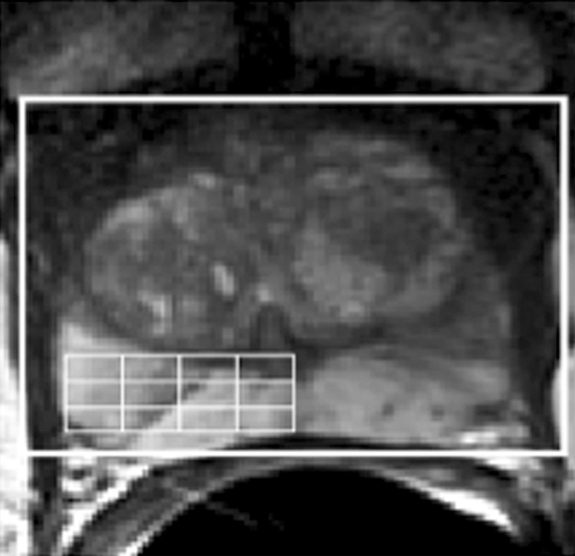
(a) Reception profile-corrected transverse T2-weighted image obtained from a volume MR imaging and MR spectroscopic imaging data set in a patient with a current PSA level of 5.93 μg/L and a small amount of biopsy-proved cancer (2-mm lesion, Gleason score of 3 + 3) in the right midgland toward the apex. At T2-weighted MR imaging, there were no clear regions of hypointensity indicative of cancer in the left midgland and apex. (b, c) The selected volume for spectroscopy (white box) and a portion of the 16 × 8 × 8 spectral phase encode grid (fine lines) was overlaid on the transverse T2-weighted image (b), with the corresponding 0.3-cm3 proton spectral array (c). There were high levels of citrate and polyamines and low levels of choline throughout the left midgland and apex, indicating healthy prostate metabolism. Across the 48 months since baseline MR imaging and MR spectroscopic imaging, the patient did not have a clinically important increase in PSA level.
Figure 3a:

(a) Reception profile-corrected transverse T2-weighted image obtained from a volume MR imaging and MR spectroscopic imaging data set in a patient with a current PSA level of 5.60 μg/L and biopsy-proved cancer (12-mm lesion, Gleason score of 3 + 3) in the left base. The selected volume for spectroscopy (white box) and a portion of the 16 × 8 × 8 spectral phase encode grid (fine lines) was overlaid on the image. (b) At T2-weighted MR imaging, there was a region of hypointensity (arrows) in the left base. (c) The corresponding spectral array showed elevated choline and reduced citrate and polyamine levels (shaded area) in approximately the same region as the T2 hypointensity. Across the 60 months since baseline MR imaging and MR spectroscopic imaging, the patient had high PSA velocity (> 75 [μg L−1]/y); at follow-up biopsy, he had an increase in the amount of histologically proved disease (28-mm lesion, Gleason score of 3 + 3 in the left base; 1-mm lesion in the left midgland).
Figure 2b:
(a) Reception profile-corrected transverse T2-weighted image obtained from a volume MR imaging and MR spectroscopic imaging data set in a patient with a current PSA level of 5.93 μg/L and a small amount of biopsy-proved cancer (2-mm lesion, Gleason score of 3 + 3) in the right midgland toward the apex. At T2-weighted MR imaging, there were no clear regions of hypointensity indicative of cancer in the left midgland and apex. (b, c) The selected volume for spectroscopy (white box) and a portion of the 16 × 8 × 8 spectral phase encode grid (fine lines) was overlaid on the transverse T2-weighted image (b), with the corresponding 0.3-cm3 proton spectral array (c). There were high levels of citrate and polyamines and low levels of choline throughout the left midgland and apex, indicating healthy prostate metabolism. Across the 48 months since baseline MR imaging and MR spectroscopic imaging, the patient did not have a clinically important increase in PSA level.
Figure 2c:

(a) Reception profile-corrected transverse T2-weighted image obtained from a volume MR imaging and MR spectroscopic imaging data set in a patient with a current PSA level of 5.93 μg/L and a small amount of biopsy-proved cancer (2-mm lesion, Gleason score of 3 + 3) in the right midgland toward the apex. At T2-weighted MR imaging, there were no clear regions of hypointensity indicative of cancer in the left midgland and apex. (b, c) The selected volume for spectroscopy (white box) and a portion of the 16 × 8 × 8 spectral phase encode grid (fine lines) was overlaid on the transverse T2-weighted image (b), with the corresponding 0.3-cm3 proton spectral array (c). There were high levels of citrate and polyamines and low levels of choline throughout the left midgland and apex, indicating healthy prostate metabolism. Across the 48 months since baseline MR imaging and MR spectroscopic imaging, the patient did not have a clinically important increase in PSA level.
Figure 3b:

(a) Reception profile-corrected transverse T2-weighted image obtained from a volume MR imaging and MR spectroscopic imaging data set in a patient with a current PSA level of 5.60 μg/L and biopsy-proved cancer (12-mm lesion, Gleason score of 3 + 3) in the left base. The selected volume for spectroscopy (white box) and a portion of the 16 × 8 × 8 spectral phase encode grid (fine lines) was overlaid on the image. (b) At T2-weighted MR imaging, there was a region of hypointensity (arrows) in the left base. (c) The corresponding spectral array showed elevated choline and reduced citrate and polyamine levels (shaded area) in approximately the same region as the T2 hypointensity. Across the 60 months since baseline MR imaging and MR spectroscopic imaging, the patient had high PSA velocity (> 75 [μg L−1]/y); at follow-up biopsy, he had an increase in the amount of histologically proved disease (28-mm lesion, Gleason score of 3 + 3 in the left base; 1-mm lesion in the left midgland).
Figure 3c:

(a) Reception profile-corrected transverse T2-weighted image obtained from a volume MR imaging and MR spectroscopic imaging data set in a patient with a current PSA level of 5.60 μg/L and biopsy-proved cancer (12-mm lesion, Gleason score of 3 + 3) in the left base. The selected volume for spectroscopy (white box) and a portion of the 16 × 8 × 8 spectral phase encode grid (fine lines) was overlaid on the image. (b) At T2-weighted MR imaging, there was a region of hypointensity (arrows) in the left base. (c) The corresponding spectral array showed elevated choline and reduced citrate and polyamine levels (shaded area) in approximately the same region as the T2 hypointensity. Across the 60 months since baseline MR imaging and MR spectroscopic imaging, the patient had high PSA velocity (>75 [μg L−1]/y); at follow-up biopsy, he had an increase in the amount of histologically proved disease (28-mm lesion, Gleason score of 3 + 3 in the left base; 1-mm lesion in the left midgland).
The distributions according to year of diagnosis, stratified according to anatomic MR imaging findings, of the following variables were similar: number of biopsy cores, percentage of positive biopsy cores, and incidence of repeated biopsy. Patients with a lesion suggestive of cancer at anatomic MR imaging had an overall greater percentage of positive biopsy cores than did patients with normal MR imaging results (mean of 25% vs 15%, P = .01). In contrast, there was no difference in the number of biopsy cores obtained (mean of 11 vs 12, P = .28) or the likelihood of undergoing repeated prostate biopsy (χ2, P = .81) across the MR findings category.
Discussion
We found that anatomic MR imaging at time of diagnosis was the imaging modality most highly associated with risk of subsequent prostate cancer progression, mainly driven by Gleason score upgrading, in men undergoing active surveillance. Consistent with our findings, results from another recent small study with a short follow-up period suggested that the apparent diffusion coefficient measured with diffusion-weighted MR imaging helped predict cancer progression (9). Overall, the bulk of evidence supports the concept that MR imaging and MR spectroscopic imaging findings may be used as biomarkers of disease aggressiveness (8). In contrast, transrectal US findings at diagnosis were not associated with cancer progression during active surveillance.
In our study, the findings at MR imaging and MR spectroscopic imaging or transrectal US could not be used to predict subsequent high PSA velocity. This finding is consistent with the findings of another study of MR imaging and MR spectroscopic imaging in active surveillance (15). That study was limited by its outcome event: high PSA velocity was the only study end point, and the authors concluded that MR imaging and MR spectroscopic imaging could not be used to predict cancer progression. However, in a separate study of men undergoing active surveillance and serial MR examinations, PSA velocity was greater in men with radiologically progressive disease, suggesting that PSA velocity is a useful tumor marker (16). The identification of the most meaningful outcome in active surveillance remains controversial, but most clinicians and researchers consider Gleason score upgrade to be most indicative of tumor progression (17,18). PSA kinetics are poor predictors of cancer progression during active surveillance (19), and they did not correlate with treatment at our institution; however, Gleason score upgrading did strongly correlate with treatment (10). At our institution, about one-third of the patients who are cared for across time receive care without evidence of disease progression. We could not determine the extent to which imaging findings may have triggered the start of active treatment and potentially explain the nonsignificant associations observed. This is another reason we emphasize Gleason score upgrade: it is a potentially more objective criterion than other indicators, such as start of active treatment, which could be triggered by psychologic, physician-related, or other issues.
On the other hand, Gleason score upgrading during active surveillance may reflect sampling error at time of diagnosis, which has been estimated to occur between 14% and 35% of the time (20,21). This sampling error is the basis for tumor reclassification to a higher risk group without true cancer progression. True tumor dedifferentiation across time during active surveillance is estimated to be less frequent than sampling error of prostate tumor (22). However, upgrading at second biopsy is reported in as many as one-third of men undergoing active surveillance (23). Thus, any tool that effectively may help clinicians better assess the risk of undergrading and understaging at time of diagnosis is critical for patients who are candidates for active surveillance because risk assessment depends greatly on tumor grade and stage.
We carefully examined whether the association we found was biased by a sampling artifact at diagnosis or by an ascertainment bias caused by differential repeated biopsy rate or schemes. The number of biopsy cores and the likelihood of undergoing repeated biopsy were similar across imaging categories (imaging findings suggestive of cancer vs normal findings). This finding supports our impression that the association is not driven by differential initial assessment or by differential follow-up, either of which could have confounded the associations observed. Another group also showed that MR imaging and MR spectroscopic imaging improved the prediction of insignificant disease, as defined by Epstein et al (24), at prostatectomy (7). Overall, it appears that MR imaging and MR spectroscopic imaging may yield additional predictive information at diagnosis and thus provide a potentially useful biomarker of risk of subsequent progression.
The field of prostate MR imaging and MR spectroscopic imaging is changing rapidly, and the imaging techniques used for the patients in the current study—1.5-T MR imaging and MR spectroscopic imaging—does not reflect the current state of the art, which involves the addition of dynamic contrast material–enhanced (8) imaging to MR imaging and MR spectroscopic imaging at 3 T (3). However, since 1.5-T prostate MR imaging and MR spectroscopic imaging is now commercially available and is becoming more widely used, it remains critically important to determine its role in the evaluation of active surveillance candidates. This cohort of patients who were in an active surveillance program for many years and who underwent imaging at baseline with MR imaging and MR spectroscopic imaging—a type of cohort about which few studies have been published—also provides a great window to explore the natural history of low-risk prostate cancer and its characteristics at diagnosis.
The characterization of smaller lesions within the prostate at MR imaging and MR spectroscopic imaging is technically more difficult. The high sensitivity and specificity of MR imaging and MR spectroscopic imaging for cancer localization within the prostate—as high as 91% and 95%, respectively, for larger cancer lesions (25)—can be as low as 44% for small (<0.5 cm3) low-grade (Gleason score 3 + 3) disease (26–28). An important part of the technical difficulty in assessing low-volume cancer is the limited spatial resolution with 1.5-T MR spectroscopic imaging (0.34 cm3). The improved spatial resolution of MR spectroscopic imaging (0.16 cm3) yielded by imagers with higher magnetic field strength can reduce the partial voluming of surrounding benign tissue in spectroscopic volumes containing cancer (3), and the ability to detect and characterize smaller malignant lesions could improve the ability of MR spectroscopic imaging to aid in the prediction of cancer progression, although this remains to be demonstrated.
There were a number of potential limitations to our study that merit consideration. First, two urologists interpreted the radiologist’s report to determine MR imaging and MR spectroscopic imaging findings. Central review by radiologists and spectroscopists, a more quantitative assessment of the MR spectroscopic imaging data, or both may have produced different results that better defined the optimal effectiveness of the imaging. On the other hand, the approach we used more likely reflects the way such data currently are used by clinicians for decision-making purposes and may better represent the true clinical usefulness of the imaging test. Second, selection bias is likely. Patients included were more likely to have palpable disease at diagnosis (cancer stage T2) and to have received a diagnosis before 2003. How this affected the main findings was uncertain, but thorough examination of potential confounding variables showed that none of them explained the measured association. Third, the problem of the appropriate definition of outcome is common to all studies about active surveillance. To be comprehensive, we examined all possible active surveillance outcome variables because they may reflect different aspects of the biology of the disease. Fourth, a small sample size limits the statistical power of the current study and is reflected by the somewhat large confidence intervals around the main estimates. However, the uniqueness of this cohort consists of the combination of institutional MR expertise and medium-term follow-up among the oldest active surveillance cohorts. As for every other current study about active surveillance, follow-up is still relatively limited, and late outcomes have not been assessed.
In conclusion, our results show that abnormal prostate MR imaging results that are suggestive of cancer may confer an increased risk of Gleason score upgrade at subsequent biopsy in patients undergoing active surveillance. MR spectroscopy and transrectal US were not associated with cancer progression. Although expensive, prostate MR imaging may be useful as a biomarker of prostate cancer aggressiveness to help with counseling potential candidates about the appropriateness of active surveillance as an initial management strategy.
Advances in Knowledge.
MR imaging at diagnosis appears to aid in the prediction of intermediate- to long-term cancer progression in men whose prostate cancer is managed with active surveillance independent of other typical cancer-related characteristics.
The presence of a lesion suggestive of cancer at MR imaging may confer a fourfold increased risk of Gleason score upgrade at subsequent biopsy (hazard ratio [HR], 4.0; 95% confidence interval [CI]: 1.1, 14.9) and a threefold increased risk of overall cancer progression (HR, 2.7; 95% CI: 1.1, 6.7).
Neither MR spectroscopic imaging nor US findings can be used to predict cancer progression.
Implication for Patient Care.
Prostate MR imaging may help with counseling potential candidates about the appropriateness of active surveillance in men with a diagnosis of prostate cancer.
Received June 26, 2009; revision requested August 5; final revision received January 12, 2010; accepted January 22; final version accepted February 1.
J.K. supported by a research grant from GE Healthcare. V.F. supported by the McLaughlin Dean’s Grant from Laval University.
Funding: This research was supported by the National Institutes of Health (grants 1P50CA089520-01, CA111291, and CA059897).
Authors stated no financial relationship to disclose.
Abbreviation:
- PSA
- prostate-specific antigen
References
- 1.Cooperberg MR, Broering JM, Carroll PR. Risk assessment for prostate cancer metastasis and mortality at the time of diagnosis. J Natl Cancer Inst 2009;101(12):878–887 [DOI] [PMC free article] [PubMed] [Google Scholar]
- 2.Barocas DA, Cowan JE, Smith JA, Jr, Carroll PR. and the CaPSURE Investigators What percentage of patients with newly diagnosed carcinoma of the prostate are candidates for surveillance? an analysis of the CaPSURE database. J Urol 2008;180(4):1330–1334;discussion 1334–1335 [DOI] [PubMed] [Google Scholar]
- 3.Kurhanewicz J, Vigneron D, Carroll P, Coakley F. Multiparametric magnetic resonance imaging in prostate cancer: present and future. Curr Opin Urol 2008;18(1):71–77 [DOI] [PMC free article] [PubMed] [Google Scholar]
- 4.Mullerad M, Hricak H, Wang L, Chen HN, Kattan MW, Scardino PT. Prostate cancer: detection of extracapsular extension by genitourinary and general body radiologists at MR imaging. Radiology 2004;232(1):140–146 [DOI] [PubMed] [Google Scholar]
- 5.Wang L, Hricak H, Kattan MW, et al. Prediction of seminal vesicle invasion in prostate cancer: incremental value of adding endorectal MR imaging to the Kattan nomogram. Radiology 2007;242(1):182–188 [DOI] [PubMed] [Google Scholar]
- 6.Wang L, Hricak H, Kattan MW, Chen HN, Scardino PT, Kuroiwa K. Prediction of organ-confined prostate cancer: incremental value of MR imaging and MR spectroscopic imaging to staging nomograms. Radiology 2006;238(2):597–603 [DOI] [PubMed] [Google Scholar]
- 7.Shukla-Dave A, Hricak H, Kattan MW, et al. The utility of magnetic resonance imaging and spectroscopy for predicting insignificant prostate cancer: an initial analysis. BJU Int 2007;99(4):786–793 [DOI] [PubMed] [Google Scholar]
- 8.deSouza NM, Riches SF, Vanas NJ, et al. Diffusion-weighted magnetic resonance imaging: a potential non-invasive marker of tumour aggressiveness in localized prostate cancer. Clin Radiol 2008;63(7):774–782 [DOI] [PubMed] [Google Scholar]
- 9.van As NJ, de Souza NM, Riches SF, et al. A study of diffusion-weighted magnetic resonance imaging in men with untreated localised prostate cancer on active surveillance. Eur Urol 2009;56(6):981–988 [DOI] [PubMed] [Google Scholar]
- 10.Dall’Era MA, Konety BR, Cowan JE, et al. Active surveillance for the management of prostate cancer in a contemporary cohort. Cancer 2008;112(12):2664–2670 [DOI] [PubMed] [Google Scholar]
- 11.Schricker AA, Pauly JM, Kurhanewicz J, Swanson MG, Vigneron DB. Dualband spectral-spatial RF pulses for prostate MR spectroscopic imaging. Magn Reson Med 2001;46(6):1079–1087 [DOI] [PubMed] [Google Scholar]
- 12.Star-Lack J, Vigneron DB, Pauly J, Kurhanewicz J, Nelson SJ. Improved solvent suppression and increased spatial excitation bandwidths for three-dimensional PRESS CSI using phase-compensating spectral/spatial spin-echo pulses. J Magn Reson Imaging 1997;7(4):745–757 [DOI] [PubMed] [Google Scholar]
- 13.Tran TK, Vigneron DB, Sailasuta N, et al. Very selective suppression pulses for clinical MRSI studies of brain and prostate cancer. Magn Reson Med 2000;43(1):23–33 [DOI] [PubMed] [Google Scholar]
- 14.Coakley FV, Teh HS, Qayyum A, et al. Endorectal MR imaging and MR spectroscopic imaging for locally recurrent prostate cancer after external beam radiation therapy: preliminary experience. Radiology 2004;233(2):441–448 [DOI] [PubMed] [Google Scholar]
- 15.Cabrera AR, Coakley FV, Westphalen AC, et al. Prostate cancer: is inapparent tumor at endorectal MR and MR spectroscopic imaging a favorable prognostic finding in patients who select active surveillance? Radiology 2008;247(2):444–450 [DOI] [PMC free article] [PubMed] [Google Scholar]
- 16.Coakley FV, Chen I, Qayyum A, et al. Validity of prostate-specific antigen as a tumour marker in men with prostate cancer managed by watchful-waiting: correlation with findings at serial endorectal magnetic resonance imaging and spectroscopic imaging. BJU Int 2007;99(1):41–45 [DOI] [PubMed] [Google Scholar]
- 17.Klotz L. What is the best approach for screen-detected low volume cancers? The case for observation. Urol Oncol 2008;26(5):495–499 [DOI] [PubMed] [Google Scholar]
- 18.Dall’Era MA, Cooperberg MR, Chan JM, et al. Active surveillance for early-stage prostate cancer: review of the current literature. Cancer 2008;112(8):1650–1659 [DOI] [PubMed] [Google Scholar]
- 19.van den Bergh RC, Roemeling S, Roobol MJ, Wolters T, Schröder FH, Bangma CH. Prostate-specific antigen kinetics in clinical decision-making during active surveillance for early prostate cancer: a review. Eur Urol 2008;54(3):505–516 [DOI] [PubMed] [Google Scholar]
- 20.Conti SL, Dall’era M, Fradet V, Cowan JE, Simko J, Carroll PR. Pathological outcomes of candidates for active surveillance of prostate cancer. J Urol 2009;181(4):1628–1633; discussion 1633–1634 [DOI] [PubMed] [Google Scholar]
- 21.Suardi N, Capitanio U, Chun FK, et al. Currently used criteria for active surveillance in men with low-risk prostate cancer: an analysis of pathologic features. Cancer 2008;113(8):2068–2072 [DOI] [PubMed] [Google Scholar]
- 22.Epstein JI, Walsh PC, Carter HB. Dedifferentiation of prostate cancer grade with time in men followed expectantly for stage T1c disease. J Urol 2001;166(5):1688–1691 [PubMed] [Google Scholar]
- 23.Choo R, Danjoux C, Morton G, et al. How much does Gleason grade of follow-up biopsy differ from that of initial biopsy in untreated, Gleason score 4-7, clinically localized prostate cancer? Prostate 2007;67(15):1614–1620 [DOI] [PubMed] [Google Scholar]
- 24.Epstein JI, Chan DW, Sokoll LJ, et al. Nonpalpable stage T1c prostate cancer: prediction of insignificant disease using free/total prostate specific antigen levels and needle biopsy findings. J Urol 1998;160(6 pt 2):2407–2411 [PubMed] [Google Scholar]
- 25.Scheidler J, Hricak H, Vigneron DB, et al. Prostate cancer: localization with three-dimensional proton MR spectroscopic imaging—clinicopathologic study. Radiology 1999;213(2):473–480 [DOI] [PubMed] [Google Scholar]
- 26.Coakley FV, Kurhanewicz J, Lu Y, et al. Prostate cancer tumor volume: measurement with endorectal MR and MR spectroscopic imaging. Radiology 2002;223(1):91–97 [DOI] [PubMed] [Google Scholar]
- 27.Dhingsa R, Qayyum A, Coakley FV, et al. Prostate cancer localization with endorectal MR imaging and MR spectroscopic imaging: effect of clinical data on reader accuracy. Radiology 2004;230(1):215–220 [DOI] [PubMed] [Google Scholar]
- 28.Zakian KL, Sircar K, Hricak H, et al. Correlation of proton MR spectroscopic imaging with gleason score based on step-section pathologic analysis after radical prostatectomy. Radiology 2005;234(3):804–814 [DOI] [PubMed] [Google Scholar]