

Abstract
Blood pressure (BP) control rates and number of antihypertensive medications were compared (average follow‐up, 4.9 years) by randomized groups: chlorthalidone, 12.5–25 mg/d (n=15,255), amlodipine 2.5–10 mg/d (n=9048), or lisinopril 10–40 mg/d (n=9054) in a randomized double‐blind hypertension trial. Participants were hypertensives aged 55 or older with additional cardiovascular risk factor(s), recruited from 623 centers. Additional agents from other classes were added as needed to achieve BP control. BP was reduced from 145/83 mm Hg (27% control) to 134/76 mm Hg (chlorthalidone, 68% control), 135/75 mm Hg (amlodipine, 66% control), and 136/76 mm Hg (lisinopril, 61% control) by 5 years; the mean number of drugs prescribed was 1.9, 2.0, and 2.1, respectively. Only 28% (chlorthalidone), 24% (amlodipine), and 24% (lisinopril) were controlled on monotherapy. BP control was achieved in the majority of each randomized group—a greater proportion with chlorthalidone. Over time, providers and patients should expect multidrug therapy to achieve BP <140/90 mm Hg in a majority of patients.
More than 70 million Americans—nearly 1 in 3 adults—have hypertension; its prevalence increases with age. 1 , 2 It is a major risk factor for coronary heart disease (CHD), heart failure (HF), stroke, and renal failure. It is reasonable to infer that improved detection, treatment, and control of elevated blood pressure (BP) were important contributors to the 64% decline in age‐adjusted cardiovascular mortality rates that has occurred since 1963. 2 But aging of the population, the epidemic of obesity, and longer survival with hypertension have all led to an actual increase in the prevalence of hypertension—the most common primary diagnosis recorded by physicians in the United States and the principal diagnosis for 38 million office visits during 2001. 3
Extensive public health efforts aimed at identifying, evaluating, and treating individuals with arterial hypertension have significantly improved BP control rates (<140/90 mm Hg) among US adults with hypertension in recent years, from 29% in 2000 to 37% in 2004, but for the majority, BP remains uncontrolled, especially among older individuals and some minorities. 4 These low BP control rates have been difficult to explain, given the number of apparently well‐tolerated antihypertensive agents 5 and the periodic publication of consensus guidelines. 5 , 6 , 7 , 8 A number of potential barriers to BP control have been proposed, including limited access to care, choice of antihypertensive drugs, provider practice patterns, and patient adherence. Recent reports strongly suggest that a major factor of inadequate BP control is the provider’s failure to increase doses or numbers of antihypertensive medications in the management of patients with uncontrolled BP. 9 , 10
The Antihypertensive and Lipid‐Lowering Treatment to Prevent Heart Attack Trial (ALLHAT), which was conducted in diverse North American demographic and medical settings, found that treatments based on an angiotensin‐converting enzyme (ACE) inhibitor (lisinopril [L]), a calcium channel blocker (CCB; amlodipine [A]), or an α‐blocker (doxazosin [D]) were not superior to thiazide‐type diuretic (chlorthalidone [C])–based treatment in preventing CHD, stroke, and renal complications in hypertension. Chlorthalidone was superior in preventing HF (compared to A, L, or D), combined cardiovascular events (compared to L or D), and stroke (compared to D and, among blacks, L). 11 , 12
We previously reported that BP was controlled to <140/90 mm Hg in two‐thirds of ALLHAT participants and concluded that it is likely that BP values <140/90 mm Hg could be achieved in the vast majority of persons with hypertension with the antihypertensive medications available today. 10 This report describes BP control in ALLHAT within and across randomized treatment groups over time, the relationship of BP control to the numbers and doses of drugs used, and factors that predict BP control within each randomized group. The doxazosin arm was terminated early and is not included in this report. 11
Methods
The rationale and design of ALLHAT have been published. 13 , 14 Briefly, eligible participants were hypertensive men and women 55 years or older with at least one additional risk factor for CHD (previous myocardial infarction or stroke [>6 months], other atherosclerotic vascular disease, left ventricular hypertrophy, type 2 diabetes, current cigarette smoking, and high‐density lipoprotein cholesterol <35 mg/dL). For untreated participants (and those treated for less than 2 months), BP inclusion criteria were average systolic BP (SBP) ≥140 and/or diastolic BP (DBP) ≥90 mm Hg but ≤180/110 mm Hg at 2 screening visits. Treated participants (1 or 2 antihypertensive drugs) were required to have BP values ≤160/100 mm Hg at the first screening visit and ≤180/110 mm Hg at the second. 13 , 15 Participants (N=33,357) were recruited in 623 centers in North America 16 , 17 and were randomly assigned to chlorthalidone, amlodipine, or lisinopril treatment. To maximize statistical power, 1.7 times as many participants were assigned to the chlorthalidone treatment arm than to the alternative treatment arms (originally 3 including doxazosin). 12 , 13 , 18 The treatment goal was BP <140/90 mm Hg. All participants signed an informed consent form, and all centers received institutional review board approval.
Blinded study drugs were titrated through 3 dosage levels: 12.5, 12.5 (sham titration), and 25 mg/d for chlorthalidone; 2.5, 5, and 10 mg/d for amlodipine; and 10, 20, and 40 mg/d for lisinopril. If the BP goal was not met on the maximum tolerated dosage of the blinded medication, an open‐label step 2 agent (atenolol [25–100 mg/d], reserpine [0.05–0.2 mg/d], or clonidine [0.1–0.3 mg BID]) could be added and increased until the goal was reached. If goal BP was still not achieved, an open‐label step 3 agent, hydralazine (25–100 mg BID), could be added. After initial titration visits, participants were seen every 3 months during the first year and every 4 months thereafter. This report describes the medication and BP status of participants at randomization, 6 months, annual follow‐up visits, and the last treatment visit in the 6‐month period immediately prior to the trial’s closeout.
Nonstudy open‐label drugs could be added to or substituted for step 2 or step 3 open‐label medications to improve tolerance or BP control. However, open‐label medications from one of the blinded classes of drugs could be used only if SBP was >160 mm Hg and/or DBP was >100 mm Hg after maximum tolerated titration of blinded and open‐label study drugs or if a compelling indication, such as HF, arose for one of the blinded drug classes.
Control of BP and adherence to assigned blinded medication were 2 of 6 key clinic performance measures monitored throughout the trial. A clinic‐specific performance profile indicated how each clinic compared with regional and overall study performance. These reports were monitored by regional physician coordinators, who provided counseling to clinic investigators as appropriate regarding means to improve performance. 19
Blood pressure measurement technique and definition of visit BP have been described previously. 10 Mean BP levels and percentage control (<140/90 mm Hg) at baseline and follow‐up were calculated for 18 major subgroups within each treatment group. Use of additional drugs, average step 1 dose, percentage remaining on step 1 drug, and percentage controlled on a different number of drugs at follow‐up were also tabulated for these subgroups. Multiple logistic regression analyses were performed to assess the independent influence of baseline variables on BP control at year 3 according to randomized treatment group.
Results
Detailed baseline results have been published. 15 Briefly, the 3 randomized treatment groups were similar. Mean age was 67 years, 47% were women, 35% were black, and 22% were cigarette smokers. Thirty‐six percent had a history of diabetes, 26% had preexisting CHD, and 90% were on 1 or 2 antihypertensive drugs prior to enrollment. At the first screening visit, mean BP was 145/83 mm Hg (159/91 mm Hg for the 10% untreated); the BP control rate was 27%.
During follow‐up, mean SBP/DBP decreased and control rates increased in all 3 groups (Table I). Among participants who attended a treatment visit in the last 6 months of follow‐up, mean BP was lower than at baseline by 12.8/8.3, 12.2/9.1, and 11.9/8.5 mm Hg for C, A, and L, respectively. The average step 1 dose prescribed to participants increased steadily over time, as did the average number of drugs prescribed (Table I); after 60 months, average doses of step 1 medication were 19.7, 7.9, and 29.9 mg for C, A, and L, respectively. BP control (<140/90 mm Hg) increased in all 3 groups to 68%, 66%, and 61% for C, A, and L, respectively, at year 5 (Table I) and was controlled in 69% to 73% at the last treatment visit. DBP control was achieved more often than SBP control (92% vs 67% overall). 10 Of the 32% to 39% in whom BP was not controlled across treatment groups at year 5, the majority (53.5%) had BP values <150/95 mm Hg (54.1% for C, 57.6% for A, 49.0% for L) (data not shown).
Table I.
Mean Blood Pressure (BP), BP Control Status, and Number of Drugs Prescribed, by Randomized Treatment Group: Chlorthalidone (C), Amlodipine (A), Lisinopril (L)
| Clinic Visit (Months) | No. With Visit | Mean Blood Pressure (mm Hg), SBP/DBP | Average Step 1 Dosagea | Mean No. of Drugs | BP <140/90 mm Hg (%) | SBP <140 mm Hg (%) | DBP <90 mm Hg (%) | ||||||||||||||
|---|---|---|---|---|---|---|---|---|---|---|---|---|---|---|---|---|---|---|---|---|---|
| C | A | L | C | A | L | C | A | L | C | A | L | C | A | L | C | A | L | C | A | L | |
| Initial | 15,255 | 9048 | 9054 | 144.8/83.3 | 144.8/83.2 | 145.0/83.4 | – | – | – | – | – | – | 27.5 | 27.7 | 27.2 | 30.8 | 31.0 | 30.9 | 68.3 | 68.3 | 67.7 |
| 6 | 14,148 | 8385 | 8375 | 138.6/80.4 | 140.4/80.0 | 141.9/81.2 | 16.5 | 5.8 | 23.1 | 1.3 | 1.3 | 1.3 | 52.9 | 48.2 | 46.1 | 55.9 | 50.7 | 48.3 | 83.1 | 83.9 | 78.4 |
| 12 | 12,924 | 7647 | 7530 | 136.8/79.3 | 138.4/78.7 | 140.0/79.9 | 17.5 | 6.5 | 25.1 | 1.4 | 1.4 | 1.5 | 57.9 | 55.0 | 50.8 | 60.9 | 57.2 | 53.3 | 86.2 | 87.7 | 82.4 |
| 36 | 11,262 | 6697 | 6423 | 134.9/77.3 | 135.7/76.4 | 136.7/77.4 | 18.8 | 7.3 | 27.7 | 1.7 | 1.7 | 1.8 | 63.8 | 63.0 | 59.0 | 65.8 | 64.7 | 61.0 | 90.2 | 91.5 | 87.8 |
| 60 | 5670 | 3400 | 3191 | 134.1/75.5 | 134.7/74.7 | 136.0/75.5 | 19.7 | 7.9 | 29.9 | 1.9 | 2.0 | 2.1 | 67.8 | 66.2 | 61.1 | 69.3 | 67.2 | 62.8 | 92.4 | 94.1 | 90.2 |
| Lastb | 8382 | 5032 | 4669 | 132.0/75.0 | 132.6/74.1 | 133.1/74.9 | 19.5 | 7.7 | 29.0 | 1.9 | 1.9 | 2.1 | 72.9 | 72.6 | 69.2 | 74.2 | 73.6 | 70.4 | 94.0 | 95.5 | 92.5 |
Abbreviations: DBP, diastolic blood pressure; SBP, systolic blood pressure. aIn mg/d. Dosages were 12.5–25 mg/d for C, 2.5–10 mg/d for A, and 10–40 mg/d for L. The number of participants on step 1 drug for C, A, and L, respectively, are 12,706, 7534, and 7163 (6 months); 11,313, 6662, and 6111 (12 months); 9326, 5592, and 4862 (36 months); 4581, 2795, and 2303 (60 months); and 6880, 4161, and 3474 (last visit). bLast treatment visit within 6 months of trial closeout. Mean follow‐up time was 4.9 years.
The year 3 mean BP, average step 1 drug dose, mean number of antihypertensive drugs prescribed, and percentage with controlled BP are presented in Table II for major subgroups defined by demographics and cardiovascular disease risk factors. Regardless of treatment assignment, BP control tended to be better in men, nonblacks, nondiabetics, younger participants (<65 years) and those with atherosclerotic cardiovascular disease (ASCVD), with a body mass index (BMI) <30 kg/m2, not on antihypertensive drugs prior to enrollment, and with an estimated glomerular filtration rate (eGFR) ≥60 mL/min/1.73 m2. Younger participants, nondiabetics, blacks, obese persons, those without ASCVD, and those with an eGFR ≥60 had higher DBP than their complements. Men and participants with ASCVD were receiving a slightly higher mean number of drugs compared with their complements and had better BP control rates. Diabetics, nonsmokers, obese persons, those with prior hypertension treatment, those with an eGFR <60, and blacks assigned to lisinopril had poorer BP control than their complements despite a higher average number of antihypertensive drugs.
Table II.
Mean Blood Pressure (BP), Average Step 1 Dosage (mg/d), Mean Number of Drugs Prescribed, and BP Control Status at Year 3, by Randomized Treatment Group and Major Subgroup
| No. With Visit | Mean Blood Pressure (mm Hg) SBP/DBP | Average Step 1 Dosagea | Mean No. of Drugs | BP <140/90 mm Hg (%) | |||||||||||
|---|---|---|---|---|---|---|---|---|---|---|---|---|---|---|---|
| C | A | L | C | A | L | C | A | L | C | A | L | C | A | L | |
| Male | 6165 | 3629 | 3599 | 134.2/77.3 | 135.3/76.5 | 135.6/77.2 | 19.1 | 7.5 | 27.8 | 1.7 | 1.7 | 1.9 | 65.4 | 63.7 | 61.9 |
| Female | 5097 | 3068 | 2824 | 135.8/77.2 | 136.3/76.4 | 138.2/77.6 | 18.4 | 7.0 | 27.6 | 1.6 | 1.6 | 1.8 | 61.8 | 62.1 | 55.3 |
| Black | 3755 | 2260 | 2123 | 136.2/79.0 | 137.8/78.5 | 140.2/79.9 | 18.8 | 7.7 | 29.8 | 1.6 | 1.7 | 2.0 | 59.4 | 56.0 | 51.0 |
| Nonblack | 7507 | 4437 | 4300 | 134.3/76.4 | 134.7/75.4 | 135.0/76.2 | 18.7 | 7.1 | 26.8 | 1.7 | 1.7 | 1.8 | 65.9 | 66.5 | 63.0 |
| Diabetic | 3955 | 2338 | 2210 | 136.0/76.3 | 137.3/75.7 | 138.5/76.4 | 19.1 | 7.5 | 27.8 | 1.7 | 1.8 | 1.9 | 61.3 | 59.5 | 56.6 |
| Nondiabetic | 7307 | 4359 | 4213 | 134.3/77.8 | 134.9/76.8 | 135.8/77.9 | 18.6 | 7.2 | 27.7 | 1.6 | 1.6 | 1.8 | 65.1 | 64.9 | 60.3 |
| Smoker | 2364 | 1450 | 1384 | 134.4/77.9 | 135.4/77.0 | 136.7/78.6 | 18.7 | 7.4 | 28.6 | 1.6 | 1.6 | 1.8 | 64.9 | 63.2 | 58.8 |
| Nonsmoker | 8898 | 5247 | 5039 | 135.1/77.1 | 135.8/76.3 | 136.8/77.1 | 18.8 | 7.2 | 27.5 | 1.7 | 1.7 | 1.8 | 63.5 | 62.9 | 59.1 |
| 55–64 years | 4876 | 2893 | 2809 | 134.0/79.0 | 134.9/78.3 | 135.7/79.4 | 18.8 | 7.5 | 27.7 | 1.7 | 1.7 | 1.8 | 65.1 | 64.8 | 61.2 |
| ≥65 years | 6386 | 3804 | 3614 | 135.6/75.9 | 136.3/75.0 | 137.5/75.9 | 18.7 | 7.1 | 27.7 | 1.7 | 1.7 | 1.8 | 62.8 | 61.6 | 57.3 |
| With ASCVD | 5266 | 3096 | 2982 | 134.4/76.3 | 135.2/75.7 | 135.9/76.4 | 18.6 | 7.1 | 27.1 | 1.7 | 1.7 | 1.8 | 64.7 | 64.6 | 60.0 |
| No ASCVD | 5996 | 3601 | 3441 | 135.3/78.1 | 136.2/77.1 | 137.5/78.3 | 18.8 | 7.4 | 28.3 | 1.6 | 1.6 | 1.8 | 62.9 | 61.6 | 58.1 |
| BMI ≥30 | 4709 | 2876 | 2646 | 135.4/78.0 | 136.4/77.4 | 137.1/78.0 | 19.0 | 7.5 | 28.4 | 1.7 | 1.8 | 1.9 | 61.5 | 61.1 | 57.6 |
| BMI <30 | 6553 | 3821 | 3777 | 134.6/76.7 | 135.2/75.8 | 136.4/77.0 | 18.6 | 7.2 | 27.2 | 1.6 | 1.6 | 1.8 | 65.4 | 64.4 | 60.0 |
| Antihypertensive medicationb | 10,211 | 6079 | 5800 | 135.0/77.3 | 135.8/76.4 | 136.8/77.5 | 18.9 | 7.3 | 28.1 | 1.7 | 1.7 | 1.9 | 63.6 | 62.8 | 58.8 |
| No antihypertensive medication | 1051 | 618 | 623 | 133.7/77.3 | 134.9/76.7 | 135.9/76.7 | 17.1 | 6.5 | 24.5 | 1.3 | 1.4 | 1.5 | 65.6 | 65.0 | 61.0 |
| eGFR <60 | 2700 | 1573 | 1509 | 135.8/76.6 | 136.2/76.0 | 136.5/76.4 | 19.2 | 7.3 | 27.9 | 1.7 | 1.7 | 1.9 | 63.2 | 60.8 | 58.4 |
| eGFR ≥60 | 8182 | 4883 | 4663 | 134.5/77.4 | 135.4/76.5 | 136.8/77.6 | 18.6 | 7.3 | 27.8 | 1.6 | 1.7 | 1.8 | 64.3 | 64.1 | 59.3 |
Abbreviations: A, amlodipine; ASCVD, atherosclerotic cardiovascular disease; BMI, body mass index (kg/m2)= weight/(height)2; C, chlorthalidone; DBP, diastolic blood pressure; eGFR, estimated glomerular filtration rate (mL/min/1.73m2); L, lisinopril; SBP, systolic blood pressure; SD, standard deviation. aIn mg/d. The percentages of participants on a step 1 drug are given in Table III. bAntihypertensive treatment before ALLHAT enrollment.
The number and percentage of participants at year 3 who were receiving their assigned step 1 drug and the percentages for whom 1, 2, 3, or ≥4 drugs were prescribed are presented in Table III for major subgroups. The large majority of participants were receiving 1 or 2 antihypertensive drugs in all 3 treatment groups (84%/82%/74% in C/A/L). However, a significantly larger proportion of those assigned to lisinopril (compared to C or A) were on 3‐ or 4‐drug regimens (P<.001).
Table III.
Percentage of Participants Taking Their Assigned Step 1 Drug and Percentage on 1, 2, 3, or ≥4 Prescribed Drugs at Year 3, by Treatment Group and Major Subgroup
| Subgroup | % On Step 1 Druga | % On 1 Druga | % On 2 Drugsa | % On 3 Drugsa | % On ≥4 Drugsa | ||||||||||
|---|---|---|---|---|---|---|---|---|---|---|---|---|---|---|---|
| C | A | L | C | A | L | C | A | L | C | A | L | C | A | L | |
| All | 82.8 | 83.5 | 75.7d | 49.2 | 47.0c | 44.1d | 33.5 | 35.2b | 28.9d | 12.0 | 12.4 | 17.5d | 3.1 | 3.3 | 6.7d |
| Male | 83.8 | 84.5 | 77.9d | 45.3 | 44.0 | 42.2c | 36.0 | 36.1 | 28.8d | 13.3 | 13.9 | 19.0d | 3.3 | 3.9 | 7.4d |
| Female | 81.6 | 82.4 | 72.9d | 53.8 | 50.5c | 46.6d | 30.5 | 34.1d | 29.0 | 10.5 | 10.6 | 15.7d | 2.8 | 2.5 | 5.8d |
| Black | 83.0 | 83.6 | 72.4d | 51.7 | 46.5d | 37.3d | 30.2 | 34.4d | 30.3 | 12.4 | 12.8 | 20.8d | 3.5 | 3.8 | 8.9d |
| Nonblack | 82.7 | 83.5 | 77.3d | 47.9 | 47.2d | 47.5d | 35.2 | 35.5d | 28.2 | 11.8 | 12.2 | 15.9d | 2.9 | 3.0 | 5.7d |
| Diabetic | 82.4 | 81.8 | 75.3d | 47.5 | 43.9c | 42.5d | 32.1 | 34.4 | 28.1c | 14.3 | 15.1 | 17.7d | 4.2 | 4.5 | 9.0d |
| Nondiabetic | 83.0 | 84.4b | 75.9d | 50.1 | 48.6 | 45.0d | 34.3 | 35.6 | 29.3d | 10.8 | 10.9 | 17.4d | 2.5 | 2.6 | 5.5d |
| Smoker | 83.4 | 85.2 | 76.6d | 52.0 | 51.7 | 44.7d | 31.6 | 33.1 | 28.8 | 10.6 | 11.0 | 18.0d | 2.6 | 2.3 | 5.8d |
| Nonsmoker | 82.7 | 83.0 | 75.5d | 48.4 | 45.7c | 43.9d | 34.0 | 35.7b | 28.9d | 12.4 | 12.8 | 17.4d | 3.2 | 3.5 | 7.0d |
| 55–64 years | 85.2 | 85.1 | 77.2d | 49.2 | 45.6c | 46.1c | 34.4 | 36.4 | 27.8d | 11.6 | 12.8 | 16.8d | 2.9 | 2.9 | 6.7d |
| ≥65 years | 81.0 | 82.3 | 74.5d | 49.1 | 48.1 | 42.5d | 32.9 | 34.2 | 29.7d | 12.3 | 12.1 | 18.1d | 3.2 | 3.5 | 6.7d |
| With ASCVD | 81.6 | 82.5 | 74.5d | 45.1 | 43.9 | 43.4 | 36.1 | 37.4 | 29.7d | 13.3 | 12.8 | 16.8d | 3.2 | 3.8 | 6.7d |
| No ASCVD | 83.9 | 84.3 | 76.7d | 52.7 | 49.6c | 44.7d | 31.3 | 33.2 | 28.1c | 10.9 | 12.1 | 18.1d | 3.0 | 2.7 | 6.7d |
| BMI ≥30 | 84.2 | 83.2 | 75.4d | 48.1 | 42.3d | 42.0d | 34.1 | 37.2c | 29.3d | 13.0 | 14.7b | 18.9d | 3.2 | 3.9 | 7.3d |
| BMI <30 | 81.8 | 83.7b | 75.9d | 50.0 | 50.5 | 45.6d | 33.1 | 33.6 | 28.6d | 11.3 | 10.7 | 16.5d | 3.0 | 2.8 | 6.3d |
| Antihypertensive medication | 82.6 | 83.3 | 75.4d | 47.5 | 45.3c | 42.4d | 34.5 | 36.3b | 29.5d | 12.7 | 13.0 | 18.6d | 3.4 | 3.5 | 7.0d |
| No antihypertensive medication | 84.9 | 85.8 | 78.7c | 65.5 | 63.3 | 60.4b | 24.3 | 24.3 | 23.4 | 5.3 | 6.1 | 7.1 | 0.4 | 1.3b | 4.2d |
| eGFR <60 | 80.6 | 80.5 | 73.0d | 44.4 | 43.7 | 42.7 | 33.3 | 36.9b | 28.2d | 15.1 | 13.3 | 18.4c | 4.3 | 3.9 | 8.0d |
| eGFR ≥60 | 84.0 | 85.0 | 76.9d | 50.6 | 47.9c | 44.3d | 33.8 | 34.9 | 29.0d | 11.1 | 12.1 | 17.5d | 2.6 | 3.1 | 6.4d |
Abbreviations: A, amlodipine; ASCVD, atherosclerotic cardiovascular disease; BMI, body mass index (kg/m2)= weight/(height)2; C, chlorthalidone; DBP, diastolic blood pressure; eGFR, estimated glomerular filtration rate (mL/min/1.73m2); L, lisinopril; SBP, systolic blood pressure; SD, standard deviation. Statistical comparisons are for A/C and L/C assuming homogeneity of proportions. aPercentage of those with year 3 clinic visit. Sample sizes for subgroups are given in Table II and for “All” in Table I. b P<.05; c P<.01; d P<.001.
Table IV shows proportions of participants with controlled BP over time according to the number of prescribed antihypertensive agents by race. At 12 months, BP was controlled with monotherapy in 39% of participants (41%, 37%, and 36% in C, A, and L, respectively). This number decreased to 26% by year 5 (28% in C, 24% in A, 24% in L), with ≥4 drugs required in 4% to achieve BP control (3%, 4%, and 6% in C‐, A‐, and L‐based treatment, respectively). Only 49% of participants had their BP controlled on <3 drugs at year 5; the proportion in whom BP was controlled was significantly higher for C (52%) than A (50%; P<.05) or L (42%; P<.01). Similar trends were seen for black and nonblack participants, though black participants were less likely than nonblacks to have their BP controlled on <3 drugs. At year 5, 45% of black participants had their BP controlled on 1 or 2 drugs, compared with 51% of nonblack participants (P<.001); the proportion controlled was significantly higher for C (black, 50%; nonblack, 54%) compared with L (black, 33%, P<.001; nonblack, 46%, P<.001) but not compared with A (black, 46%, P=.056; nonblack, 52%, P=.121).
Table IV.
Blood Pressure (BP) Control Status (SBP/DBP <140/90 mm Hg) in Participants by Treatment Group and Overall (T), According to the Number of Prescribed Drugs
| Clinic Visit | % BP Controlled and on 1 Drug | % BP Controlled and on 2 Drugs | % BP Controlled and on 3 Drugs | % BP Controlled and on ≥4 Drugs | % BP Controlled Overalla | ||||||||||||
|---|---|---|---|---|---|---|---|---|---|---|---|---|---|---|---|---|---|
| C | A | L | T | C | A | L | T | C | A | L | T | C | A | L | T | ||
| All | |||||||||||||||||
| 6‐month | 41.6 | 36.9 | 36.4 | 38.9 | 8.7 | 8.9 | 6.8 | 8.3 | 1.0 | 1.3 | 1.1 | 1.1 | 0.2 | 0.1 | 0.3 | 0.2 | 49.8 |
| 12‐month | 41.1 | 37.2 | 35.5 | 38.5 | 13.4 | 13.9 | 10.5 | 12.7 | 1.9 | 2.5 | 2.8 | 2.3 | 0.2 | 0.3 | 0.6 | 0.3 | 55.2 |
| 36‐month | 34.1 | 32.1 | 30.4 | 32.6 | 20.7 | 21.3 | 15.5 | 19.5 | 6.0 | 6.7 | 8.3 | 6.8 | 1.5 | 1.6 | 2.8 | 1.9 | 62.3 |
| 60‐month | 28.1 | 24.1 | 23.9 | 25.9 | 24.3 | 25.6 | 17.8 | 23.0 | 10.7 | 11.2 | 12.0 | 11.2 | 3.4 | 4.4 | 5.6 | 4.2 | 65.6 |
| Lastb | 30.9 | 28.6 | 28.4 | 29.6 | 25.8 | 26.6 | 20.4 | 24.6 | 10.7 | 17.5 | 12.4 | 11.4 | 4.2 | 4.4 | 6.5 | 4.8 | 71.8 |
| Black | |||||||||||||||||
| 6‐month | 41.8 | 34.3 | 30.2 | 36.6 | 6.1 | 7.0 | 5.4 | 6.2 | 0.8 | 1.0 | 1.0 | 0.9 | 0.2 | <0.1 | 0.3 | 0.2 | 45.3 |
| 12‐month | 40.6 | 35.4 | 27.3 | 35.6 | 9.5 | 11.3 | 9.6 | 10.0 | 1.6 | 2.0 | 3.1 | 2.1 | 0.2 | 0.5 | 0.8 | 0.4 | 49.7 |
| 36‐month | 33.7 | 29.6 | 22.4 | 29.6 | 16.7 | 17.7 | 14.6 | 16.4 | 5.9 | 6.1 | 8.4 | 6.6 | 1.7 | 1.5 | 3.8 | 2.2 | 56.3 |
| 60‐month | 30.3 | 24.0 | 17.3 | 25.2 | 19.5 | 22.4 | 16.0 | 19.4 | 9.1 | 10.1 | 12.5 | 10.2 | 3.6 | 4.8 | 6.2 | 4.6 | 60.9 |
| Lastb | 30.4 | 25.2 | 19.1 | 26.1 | 21.6 | 23.1 | 18.0 | 21.2 | 10.0 | 11.5 | 13.1 | 11.2 | 4.5 | 5.0 | 8.5 | 5.6 | 65.3 |
| Nonblack | |||||||||||||||||
| 6‐month | 41.6 | 38.2 | 39.8 | 40.2 | 10.2 | 9.9 | 7.6 | 9.4 | 1.1 | 1.4 | 1.2 | 1.2 | 0.2 | 0.1 | 0.3 | 0.2 | 52.2 |
| 12‐month | 41.4 | 38.2 | 39.7 | 40.0 | 15.4 | 15.3 | 10.9 | 14.1 | 2.1 | 2.7 | 2.7 | 2.4 | 0.2 | 0.2 | 0.5 | 0.3 | 58.1 |
| 36‐month | 34.3 | 33.4 | 34.4 | 34.1 | 22.7 | 23.2 | 16.0 | 21.1 | 6.0 | 7.1 | 8.3 | 6.9 | 1.4 | 1.6 | 2.4 | 1.7 | 65.3 |
| 60‐month | 26.8 | 24.2 | 27.5 | 26.3 | 26.9 | 27.4 | 18.9 | 24.9 | 11.6 | 11.8 | 11.7 | 11.7 | 3.3 | 4.1 | 5.4 | 4.0 | 68.2 |
| Lastb | 31.1 | 30.1 | 32.4 | 31.2 | 27.8 | 28.3 | 21.4 | 26.2 | 11.1 | 12.0 | 12.0 | 11.6 | 4.0 | 4.1 | 5.7 | 4.5 | 74.8 |
Abbreviations: A, amlodipine; C, chlorthalidone; DBP, diastolic blood pressure; L, lisinopril; SBP, systolic blood pressure; T, total. Denominators include all participants with a given visit (denominators are given in Table I, No. With Visit). Numerators include participants whose BP was controlled and who were prescribed the indicated number of drugs (numerators can be calculated from given percentages and corresponding denominators from Table I). aOverall percentage with controlled BP includes participants who were not being prescribed antihypertensive drugs at the given visit. bLast treatment visit within 6 months of trial closeout.
Table V presents data on BP and antihypertensive drug use at year 5 by race. Mean BP was <140/90 mm Hg, and control rates exceeded 50% in all 3 drug groups in both black and nonblack participants. However, BP control was less in blacks compared with nonblacks (61% vs 68%, P<.001), with greater differences seen in L (54% vs 65%, P<.001) than C (64% vs 70%, P<.001) or A (62% vs 68%, P<.001). This was the case despite that the mean number of drugs was higher in blacks compared with nonblacks with L (2.27 vs 2.04, P<.001) and similar with A (2.01 vs 1.97, P=.31) but not with C (1.86 vs 1.93, P=.02). A small percentage of blacks and nonblacks (10% and 6%, respectively) had SBP ≥160 mm Hg, including 14% of blacks receiving L compared with 8% receiving C. Among the 40% of blacks and 32% of nonblacks with uncontrolled BP, about half had SBP <150 mm Hg. The most common add‐on agent for both race subgroups and all treatment groups was atenolol (21%–29%), followed by hydralazine (8%–22%). Among C participants, 25% of blacks and 35% of nonblacks were prescribed atenolol. Among blacks, 25% of L participants received a diuretic and 17%, a CCB. Among nonblacks, a diuretic was prescribed for 22% of A participants and 21% of L participants.
Table V.
Blood Pressure, Step 1 Medication Use, and Add‐On Drugs at Year 5 Clinic Visit
| Medication Combinations | Black | Nonblack | ||||||
|---|---|---|---|---|---|---|---|---|
| C (n=2033) | A (n=1244) | L (n=1100) | T (n=4377) | C (n=3637) | A (n=2156) | L (n=2091) | T (n=7884) | |
| Mean No. of drugs | 1.86 | 2.01 | 2.27 | 2.01 | 1.93 | 1.97 | 2.04 | 1.97 |
| Mean SBP, mm Hg | 135.3 | 136.1 | 139.0 | 136.5 | 133.4 | 133.8 | 134.3 | 134.0 |
| Mean DBP, mm Hg | 77.6 | 76.5 | 78.1 | 77.4 | 74.4 | 73.7 | 74.1 | 74.1 |
| BP <140/90 mm Hg, % | 63.8 | 62.4 | 53.6 | 60.9 | 69.9 | 68.4 | 65.0 | 68.2 |
| SBP 140–149 mm Hg, % | 17.2 | 19.9 | 18.4 | 18.3 | 16.3 | 18.1 | 18.0 | 17.3 |
| SBP 150–159 mm Hg, % | 8.8 | 8.1 | 11.5 | 9.3 | 6.5 | 7.5 | 7.7 | 7.1 |
| SBP ≥160 mm Hg, % | 8.0 | 8.0 | 14.4 | 9.6 | 6.0 | 5.3 | 7.9 | 6.3 |
| SBP <140, DBP ≥90 mm Hg,% | 2.2 | 1.5 | 2.2 | 2.0 | 1.2 | 0.7 | 1.4 | 1.1 |
| On step 1 drug, % | 81.4 | 83.3 | 70.3 | 79.1 | 80.5 | 81.6 | 73.2 | 78.8 |
| On lowest dosage, % | 18.8 | 9.2 | 11.5 | 14.2 | 20.6 | 14.0 | 18.8 | 18.3 |
| On highest dosage, % | 47.1 | 59.4 | 48.4 | 50.9 | 46.0 | 51.4 | 41.3 | 46.2 |
| On 1 drug, % | 42.2 | 34.8 | 26.9 | 36.2 | 35.1 | 33.4 | 36.7 | 35.1 |
| On 2 drugs, % | 31.9 | 35.3 | 29.5 | 32.3 | 38.5 | 40.2 | 30.1 | 36.7 |
| On ≥3 drugs, % | 23.8 | 28.3 | 40.7 | 29.2 | 24.4 | 24.9 | 31.1 | 26.3 |
| Atenolol, % | 24.6 | 27.2 | 28.7 | 26.4 | 34.5 | 32.6 | 32.4 | 33.4 |
| Clonidine, % | 12.6 | 14.3 | 21.5 | 15.3 | 9.5 | 8.2 | 11.7 | 9.7 |
| Reserpine, % | 7.1 | 6.5 | 8.4 | 7.3 | 3.6 | 3.8 | 4.2 | 3.8 |
| Hydralazine, % | 12.6 | 14.2 | 24.7 | 16.1 | 10.3 | 8.3 | 14.3 | 10.8 |
| Diuretic, % | 14.2 | 19.8 | 25.5 | 18.6 | 14.3 | 22.4 | 20.9 | 18.3 |
| CCB, % | 9.5 | 8.4 | 17.0 | 11.1 | 8.9 | 8.0 | 14.1 | 10.0 |
| ACE‐I, % | 12.2 | 12.7 | 14.6 | 13.0 | 13.3 | 14.4 | 14.3 | 13.8 |
| α‐Adrenergic blocker, % | 4.8 | 5.5 | 5.8 | 5.2 | 5.8 | 6.0 | 5.8 | 5.9 |
| Other, % | 7.3 | 9.2 | 10.9 | 8.8 | 11.9 | 12.4 | 13.5 | 12.5 |
Abbreviations: A, amlodipine; ACE‐I, angiotensin‐converting enzyme inhibitor; BP, blood pressure; C, chlorthalidone; CCB, calcium channel blocker; DBP, diastolic blood pressure; L, lisinopril; SBP, systolic blood pressure; T, total. Values are expressed as % or mean.
The results from logistic regression analyses of baseline factors related to BP control at year 3 are presented graphically (Figure). The patterns were similar across treatment groups, though there were some notable differences. Control of BP with C was superior to that with L and similar to that with A in all subgroups. Factors that were significantly related to lesser BP control in all 3 treatment arms included higher baseline SBP, older age, black race, diabetes, prior use of BP medications, and an eGFR <60 mL/min/1.73m2. Blacks had less BP control compared with nonblacks even after controlling for other baseline factors examined in logistic analyses, and the relative odds of BP control (black/nonblack) was significantly lower among A than C participants (A/C interaction: odds ratio [OR], 0.911, P<.01) and among L than C participants (L/C interaction: OR, 0.895, P<.001). Additional logistic models including years of education and continuous variables for BMI, BMI2, and eGFR, with remaining characteristics as shown in the Figure, did not explain the higher risk of uncontrolled BP in black participants. Among C and A participants, a BMI ≥30 kg/m2 was significantly related to lesser BP control, but BMI (obese/nonobese) by treatment (A/C and L/C) interaction terms were not statistically significant. When considered as continuous measures, BMI and its square did not significantly predict BP control. As a continuous variable, eGFR was a statistically significant predictor of better BP control with increasing eGFR (OR, 1.0025; 95% confidence interval, 1.0010–1.0040). Men had significantly better BP control than women in the L group (P<.001). However, the test for drug by sex interaction was not statistically significant. The presence of ASCVD, left ventricular hypertrophy by electrocardiography, and current smoking status were not significantly associated with BP control status at year 3.
Figure.
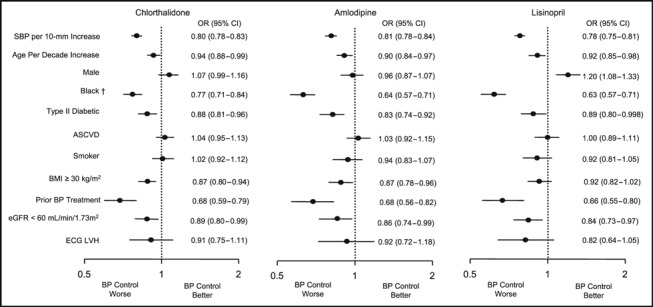
Characteristics that predicted better or worse blood pressure (BP) control (BP <140/90 mm Hg) within each drug group. Depicted are odds ratios (ORs) and their 95% confidence intervals (CIs) from 3 multiple logistic regression analyses of BP control at year 3; separate analyses were done for each randomized treatment group. An OR >1.0 indicates that the corresponding characteristic is associated with better BP control than its complementary subgroup (eg, the OR of 1.2 for men receiving lisinopril indicates 20% better BP control than among women receiving lisinopril); an OR <1.0 indicates worse BP control for the corresponding subgroup relative to its complement. The sample sizes for the respective logistic models were 11,262 (chlorthalidone), 6697 (amlodipine), and 6423 (lisinopril). †In a model combining all 3 treatment groups and including drug main effects and interaction terms (amlodipine/chlorthalidone and lisinopril/chlorthalidone ), the relative odds of BP control differed significantly by treatment group only for race (amlodipine/chlorthalidone interaction: OR, 0.911, P<.01, and lisinopril/chlorthalidone interaction: OR, 0.895, P<.001). SBP indicates systolic blood pressure; ASCVD, atherosclerotic cardiovascular disease; BMI, body mass index; eGFR, estimated glomerular filtration rate; ECG LVH, left ventricular hypertrophy on electrocardiography.
Discussion
This paper examined BP control and its determinants within and across randomized treatment groups in the largest blinded hypertension treatment trial of major morbidity and mortality end points. Our principal findings were that (1) BP control can be achieved in most patients with commonly available, affordable medications; (2) better BP control is achieved with a thiazide‐type diuretic as a step 1 drug both in a setting of monotherapy and with other drugs added, especially when compared with an ACE inhibitor–based treatment; and (3) lesser BP control in black participants could not be explained by baseline demographic or clinical characteristics.
By design, the trial included large numbers in all major subgroups defined by demographic characteristics and comorbidities. 12 , 15 , 20 , 21 , 22 In these participants, mean BP was reduced overall to ≤140/80 mm Hg by year 1 and to ≤136/76 mm Hg by year 5. Percentage at BP goal (<140/90 mm Hg) improved from 27% to 28% on prior therapy at baseline to ≥50% in all 3 treatment groups by year 1 and ≥60% by year 5. BP was controlled in >50% of participants in all major subgroups in each randomized treatment group by year 3, including blacks randomized to lisinopril, who had the lowest drug/subgroup control rate.
Although standardized training in BP measurement using mercury sphygmomanometers was delivered to clinic staff members, terminal digit preference for “0” was frequent but did not differ across randomized treatment groups. Digit preference may have considerable impact on a performance measure that defines BP control as ≤140/90 mm Hg (rather than <140/90)—a definition of BP control that has been used by others, such as the Healthcare Effectiveness Data and Information Set. 23 In ALLHAT, the overall percentage of participants with BP values ≤140/90 mm Hg was 8% greater at year 1 than the percentage with BP values <140/90 (63% vs 55%); at year 3, it was 8% greater (70% vs 62%), and at year 5 it was 6% greater (72% vs 66%). Perhaps because of BP training, these differences are less than what has been reported in a managed care setting (12.7%). 24
In this older hypertensive population, SBP was reduced most in the chlorthalidone group and least in the lisinopril group. At year 5, BP was controlled more with chlorthalidone (67.8%) than with amlodipine (66.2%) or lisinopril (61.1%); at the end of trial follow‐up, control rates were 72.9%, 72.6%, and 69.2%, respectively. Since ALLHAT was conducted in diverse clinical practice settings, control rates in clinical practice should be able to approach these levels. In fact, within the US Department of Veterans Affairs, BP control rates in a diverse hypertensive population have improved from 42% in 2000 prior to the publication of the primary ALLHAT results to 67% in 2004, similar to what was achieved in ALLHAT. 9 , 25 Compared with 2003–2004 National Health and Nutrition Examination Survey BP control rates (40%–57% in treated hypertensive patients aged ≥60 years), this represents good BP control rates for all subgroups in ALLHAT. 4
The dosage of blinded medications within each drug group at year 5 averaged 20 mg/d for chlorthalidone, 8 mg/d for amlodipine, and 30 mg/d for lisinopril. These dose levels represented 75%–80% of the maximum protocol‐allowable dose levels 13 and are higher than what is typically used in clinical practice. In addition, both effects on BP and clinical outcomes were seen with these doses, thus establishing dose levels from which to extrapolate the outcome results of ALLHAT (reported previously). 11 , 12 The chlorthalidone dosage range used in ALLHAT significantly reduced events in the Systolic Hypertension in the Elderly Program (SHEP) 26 and is at least as effective in lowering BP as 25–50 mg/d of hydrochlorothiazide, 27 while lower doses for either diuretic have not been adequately studied in major clinical outcome trials. It is reasonable, therefore, to assume that these are the appropriate dose ranges for management of hypertension.
ALLHAT data also confirm the need for multiple antihypertensive medications to achieve BP control. Although BP entry criteria in ALLHAT were developed with the intention of recruiting a population that could potentially be controlled on 1 or 2 antihypertensive medications, only 26% of participants had BP values that were below goal after 5 years on 1 drug, more (28%) in the chlorthalidone group than with amlodipine (24%) or lisinopril (24%). As expected from previous studies, more (52%) were controlled on 1 or 2 drugs with chlorthalidone therapy than with amlodipine (50%) or lisinopril therapy (42%). 28 In the ALLHAT diuretic arm, which was associated with the best BP control rate (67%), BP in 13.5% of participants was not controlled on 3 medications or the participants received ≥4 medications and therefore met criteria for resistant hypertension (defined as having uncontrolled BP on 3 drugs in full doses, one of which is a diuretic). 5 Corresponding percentages for black and nonblack participants were 14.8% and 12.8%, respectively. Because ALLHAT recruitment was intended to exclude patients with resistant hypertension, it is reasonable for physicians and others who manage hypertension, as well as patients, to expect a majority of hypertensive patients to require at least 2 or 3 medications to control BP.
At year 5, ALLHAT participants were prescribed an average of 2 antihypertensive drugs. Lisinopril participants were prescribed more drugs on average in blacks (2.27) than other race‐drug groups and still had the lowest BP control rates. These differential BP control rates could not be explained by clinical or demographic characteristics. Visit adherence at year 3 of follow‐up was slightly better among nonblack than black participants: 85.2% of nonblack and 82.3% of black participants attended >65% of expected visits and their 32‐ and 36‐month visits. And BP control was better among the more adherent (63.7%) than less (54.7%), with similar findings in black and nonblack participants. However, because of potential sampling bias in such postrandomization analyses, 29 differences in BP control could simply reflect a higher proportion of good adherers attending the 36‐month visit rather than real differences in BP control rates.
It is possible that fewer drugs or better control rates might have been achieved if an ACE inhibitor were combined with a thiazide‐type diuretic or a CCB for management of hypertension, but to allow routine addition of the specific drug classes being compared in the trial would have confounded the interpretation of the outcome results. In the Avoiding Cardiovascular Events Through Combined Therapy in Patients Living With Systolic Hypertension (ACCOMPLISH) trial, initial therapy with fixed‐dose combinations of an ACE inhibitor with either a CCB or a thiazide diuretic controlled BP in 73% of participants within 6 months. 30 However, this control rate may have been the result of beginning with 2‐drug combination therapy more than of the specific combinations used.
ALLHAT results (Figure) show little drug heterogeneity among the 3 drug classes in predictors of resistance to achieving a combined SBP and DBP goal when additional antihypertensive agents are used to achieve control. These results suggest that patient characteristics associated with resistance to antihypertensive drug therapy can allow clinicians to predict when more medication may be needed. They do not support the concept that the likelihood of controlling BP with a single agent can be increased by using patient characteristics to guide the choice of the initial antihypertensive agent. Therefore, clinical outcome results from trials like ALLHAT or other compelling indications (eg, renal disease) should have priority when selecting among the various antihypertensive drug classes. 5
Conclusions
Each randomized antihypertensive drug group in ALLHAT experienced high rates of BP control, as did each of the major subgroups. The thiazide‐type diuretic chlorthalidone was associated with the best BP control rates and the ACE inhibitor lisinopril with the least, especially in the black subgroup. This was true both for monotherapy and when additional drugs were added. Even among black participants, more than half had their BP controlled with a lisinopril‐based regimen, which did not routinely include a thiazide diuretic or a CCB, agents that are preferred for combining with an ACE inhibitor today. Over time, relatively few hypertensive patients can have their BP controlled with single‐drug therapy, suggesting that those who care for hypertensive patients, as well as the patients themselves, should expect that multidrug therapy will often be required to achieve BP <140/90 mm Hg or even lower, as has been recommended for some groups of patients. 5 , 31
Acknowledgments
Acknowledgments and disclosures: The ALLHAT investigators acknowledge contributions of study medications supplied by Pfizer, Inc (amlodipine and doxazosin), AstraZeneca (atenolol and lisinopril), and Bristol‐Meyers Squibb (pravastatin). A complete list of members of the ALLHAT Collaborative Research Group has been published previously. 11 This research was supported by Health and Human Services contract number N01‐HC‐35130 from the National Heart, Lung, and Blood Institute, National Institutes of Health, US Department of Health and Human Services, Bethesda, MD. The ALLHAT investigators acknowledge contributions of study medications supplied by Pfizer, Inc (amlodipine), AstraZeneca (atenolol and lisinopril), and Bristol‐Myers Squibb (pravastatin) and financial support provided by Pfizer, Inc. JNB has consulted for Novartis and Sankyo and has received honoraria from AstraZeneca and Pfizer. WCC has consulted for Calpis, King, Myogen, Novartis, Pfizer, Roche, Sankyo, Sanofi Aventis, and Takeda and has received honoraria from AstraZeneca, Boehringer Ingelheim, Forest Pharmaceuticals, Novartis, and Sankyo. He has also received research grants from Abbott Laboratories and Novartis. BRD has consulted for BioMarin, GlaxoSmithKline, Proctor and Gamble, and Takeda. CEF has consulted for BioMarin. RAP has received researched grants from Berlex, Bristol‐Myers Squibb, Ferring, Novartis, Schering Plough, Takeda, and Wyeth and has received honoraria from Berlex, Ferring, and Pfizer. DGV has consulted for AstraZeneca, received honoraria from AstraZeneca and Merck, and has received a research grant from Boehringer Ingelheim. JTW has consulted for GlaxoSmithKline, Novartis, Pfizer, and Sanofi‐Synthelabo; has received honoraria from GlaxoSmithKline; and has received research grants from GlaxoSmithKline and Novartis. The rest of the authors have no financial interests to disclose.
References
- 1. Fields LE, Burt VL, Cutler JA, et al. The burden of adult hypertension in the United States 1999 to 2000: a rising tide. Hypertension. 2004;44:398–404. [DOI] [PubMed] [Google Scholar]
- 2. National Heart, Lung, and Blood Institute . NHLBI Fact Book, 2007. Chapter 4: Disease Statistics. http://www.nhlbi.nih.gov/about/factpdf.htm. Accessed May 13, 2008. [Google Scholar]
- 3. Hing E, Cherry DK, Woodwell DA, et al. National ambulatory medical care survey: 2004 summary. Adv Data Vital Health Stat. 2006;374:1–34. [PubMed] [Google Scholar]
- 4. Ong KL, Cheung BMY, Man YB, et al. Prevalence, awareness, treatment, and control of hypertension among United States adults 1999–2004. Hypertension. 2007;49:69–75. [DOI] [PubMed] [Google Scholar]
- 5. The seventh report of the Joint National Committee on Prevention, Detection, Evaluation, and Treatment of High Blood Pressure: the JNC 7 report. JAMA. 2003;289:2560–2571. [DOI] [PubMed] [Google Scholar]
- 6. The sixth report of the Joint National Committee on Prevention, Detection, Evaluation, and Treatment of High Blood Pressure. Arch Intern Med. 1997;157:2413–2446. [DOI] [PubMed] [Google Scholar]
- 7. The fifth report of the Joint National Committee on Detection, Evaluation, and Treatment of High Blood Pressure (JNC V). Arch Intern Med. 1993;153:154–183. [PubMed] [Google Scholar]
- 8. Guidelines Committee . 2003 European Society of Hypertension‐European Society of Cardiology guidelines for the management of arterial hypertension. J Hypertens. 2003;21:1011–1053. [DOI] [PubMed] [Google Scholar]
- 9. Berlowitz DR, Ash AS, Hickey EC, et al. Inadequate management of blood pressure in a hypertensive population. N Engl J Med. 1998;339:1957–1963. [DOI] [PubMed] [Google Scholar]
- 10. Cushman WC, Ford CE, Cutler JA, et al. Success and predictors of blood pressure control in diverse North American settings: the Antihypertensive and Lipid‐Lowering Treatment to Prevent Heart Attack Trial (ALLHAT). J Clin Hypertens. 2002;4:393–404. [DOI] [PubMed] [Google Scholar]
- 11. The ALLHAT Officers and Coordinators for the ALLHAT Collaborative Research Group . Major cardiovascular events in hypertensive patients randomized to doxazosin vs chlorthalidone: the Antihypertensive and Lipid‐Lowering Treatment to Prevent Heart Attack Trial (ALLHAT). JAMA. 2000;283:1967–1975. [PubMed] [Google Scholar]
- 12. The ALLHAT Officers and Coordinators for the ALLHAT Collaborative Research Group . Major outcomes in high‐risk hypertensive patients randomized to angiotensin‐converting enzyme inhibitor or calcium channel blocker vs diuretic. The Antihypertensive and Lipid‐Lowering Treatment to Prevent Heart Attack Trial (ALLHAT). JAMA. 2002;288:2981–2997. [DOI] [PubMed] [Google Scholar]
- 13. Davis BR, Cutler JA, Gordon DJ, et al. Rationale and design for the Antihypertensive and Lipid‐Lowering Treatment to Prevent Heart Attack Trial (ALLHAT). Am J Hypertens. 1996;9:342–360. [DOI] [PubMed] [Google Scholar]
- 14. Cutler JA, Gordon DJ, Davis BR, et al. Rationale and design for the Antihypertensive and Lipid‐Lowering Treatment to Prevent Heart Attack Trial (ALLHAT). In: Black HR, ed. Clinical Trials in Hypertension. New York: Marcel Dekker, 2001:531–586. [Google Scholar]
- 15. Grimm RH, Margolis KL, Papademetriou V, et al. Baseline characteristics of participants in the Antihypertensive and Lipid‐Lowering Treatment to Prevent Heart Attack Trial (ALLHAT). Hypertension. 2001;37:19–27. [DOI] [PubMed] [Google Scholar]
- 16. Wright JT, Cushman WC, Davis BR, et al. The Antihypertensive and Lipid‐Lowering Treatment to Prevent Heart Attack Trial (ALLHAT): clinical center recruitment experience. Control Clin Trials. 2001;22:659–673. [DOI] [PubMed] [Google Scholar]
- 17. Pressel S, Davis BR, Louis GT, et al. Participant recruitment in the Antihypertensive and Lipid‐Lowering Treatment to Prevent Heart Attack Trial (ALLHAT). Control Clin Trials. 2001;22:674–686. [DOI] [PubMed] [Google Scholar]
- 18. Dunnett CW. A multiple comparisons procedure for comparing several treatments with a control. J Am Stat Assoc. 1955;60:573–583. [Google Scholar]
- 19. Lusk CM, Bettencourt J, Carroll L, et al. The ALLHAT adherence survival kit. Appl Clin Trials. 2004;13:40–48. [Google Scholar]
- 20. Rahman M, Pressel S, Davis BR, et al. Cardiovascular outcomes in high‐risk hypertensive patients stratified by baseline glomerular filtration rate. Ann Intern Med. 2006;144:172–180. [DOI] [PubMed] [Google Scholar]
- 21. Wright JT, Dunn JK, Cutler JA, et al. Outcomes in hypertensive black and nonblack patients treated with chlorthalidone, amlodipine, and lisinopril. JAMA. 2005;293: 1595–1608. [DOI] [PubMed] [Google Scholar]
- 22. Whelton PK, Barzilay J, Cushman WC, et al. Clinical outcomes in antihypertensive treatment of type 2 diabetes, impaired fasting glucose concentration, and normoglycemia. Arch Intern Med. 2005;165:1401–1409. [DOI] [PubMed] [Google Scholar]
- 23. Romain TM, Patel RP, Heaberlin AM, et al. Assessment of factors influencing blood pressure control in a managed care population. Pharmacotherapy. 2003;23:1060–1070. [DOI] [PubMed] [Google Scholar]
- 24. Green BB, Kaplan RC, Psaty BM. How do minor changes in the definition of blood pressure control affect the reported success of hypertension treatment? Am J Manag Care. 2003;9:219–224. [PubMed] [Google Scholar]
- 25. Berlowitz DR, Cushman WC, Glassman P. Hypertension in adults across age groups. JAMA. 2005;294:2970–2971. [DOI] [PubMed] [Google Scholar]
- 26. SHEP Cooperative Research Group . Prevention of stroke by antihypertensive drug treatment in older persons with isolated systolic hypertension: final results of the Systolic Hypertension in the Elderly Program (SHEP). JAMA. 1991;265:3255–3264. [PubMed] [Google Scholar]
- 27. Ernst ME, Carter BL, Goerdt CJ, et al. Comparative antihypertensive effects of hydrochlorothiazide and chlorthalidone on ambulatory and office blood pressure. Hypertension. 2006;47:352–358. [DOI] [PubMed] [Google Scholar]
- 28. Materson BJ, Reda DJ, Cushman WC, et al. Results of combination antihypertensive therapy after failure of each of the components. J Human Hypertens. 1995;9:791–796. [PubMed] [Google Scholar]
- 29. Berkson J. Limitations of the application of fourfold table analysis to hospital data. Biometrics. 1946;2:47–53. [PubMed] [Google Scholar]
- 30. Jamerson K, Bakris GL, Dahlof B, et al. Exceptional early blood pressure control rates: the ACCOMPLISH trial. Blood Press. 2007;16:80–86. [DOI] [PubMed] [Google Scholar]
- 31. Rosendorff C, Black HR, Cannon CP, et al.; American Heart Association Council for High Blood Pressure Research; American Heart Association Council on Clinical Cardiology; American Heart Association Council on Epidemiology and Prevention . Treatment of hypertension in the prevention and management of ischemic heart disease: a scientific statement from the American Heart Association Council for High Blood Pressure Research and the Councils on Clinical Cardiology and Epidemiology and Prevention. Circulation. 2007;115:2761–2788. [DOI] [PubMed] [Google Scholar]