Abstract
Signatures of “strong” J and “weak” K exciton couplings in the nonlinear femtosecond optical response of the FMO photosynthetic complex are identified. The two types of couplings originate from interactions of molecular transition charge dipoles and change of molecular permanent dipoles in their ground and excited states, respectively. We demonstrate that by combining various two-dimensional optical signals it should be possible to invert spectroscopic data to reconstruct the full exciton Hamiltonian (energies and couplings).
Keywords: Excitons, Femtosecond spectroscopy, Photosynthetic aggregates
1. Introduction
Assemblies of chromophores play crucial roles in light-harvesting, transport and primary charge-separation in photosynthetic bacteria and higher plants. These mark the primary events in the photosynthesis [1–4]. Collective excitations in photosynthetic complexes undergo elaborate multi-step relaxation pathways, optimized to capture light with high speed and efficiency [4–9].
These systems are typical to a broader class of molecular assemblies of electrically neutral chromophores with nonoverlapping charge distributions, which interact via electrostatic couplings between molecular multipoles. One-dimensional aggregates are classified as J or H type depending on the relative orientation of transition dipoles [10–12].
The optical excitations of such aggregates are known as Frenkel excitons [4,10,13–20]. The number of singly-excited states is equal to the number 𝒩 of chromophores, whereas the number of double-exciton states scales as ~ 𝒩2. The optical properties of aggregates are governed by molecular properties and the intermolecular interactions.
The two-dimensional correlation plots obtained by coherent multidimensional correlation spectroscopy reveal molecular fluctuation dynamics, intermolecular correlations, and exciton dynamics in real time [9,21–26]. These experiments are carried out by applying four femtosecond pulses, as shown in Fig. 1 and controlling the three time intervals, t1, t2, t3, between them. Fourier transform of the signal with respect to these intervals generate multidimensional spectrograms, whose peak patten is associated with the network of intermolecular interactions [23,27–29]. The lineshapes contain valuable signatures of interactions with intramolecular and solvent vibrations: static fluctuations cause inhomogeneous broadening, while fast fluctuations are responsible for exponential decay of coherences which shows up as homogeneous broadening. In this paper we study the signatures of two types of intermolecular interactions in various 2D signals and how they can be inverted to yield the exciton Hamiltonian.
Fig. 1.
Left: geometry of the seven of BChl molecules in one unit of the Fenna–Matthews–Olson (FMO) photosynthetic complex; center: dipole moments of the BChl molecule (µ indicates the transition dipole and d the difference between permanent dipoles in the excited state and the ground state); right: schematic of the time-domain coherent four-pulse experiment.
2. The exciton model
Optical properties of a molecular aggregate are described by the Frenkel exciton Hamiltonian:
| (1) |
where |0〉 is the ground state of the aggregate, denotes the set of single-excitons and is a set of double-excitons. Their properties are characterized by energies εm and couplings J and K as described below. is the nth excitation creation operator, which promotes molecule n into its excited state. B̂ are the conjugate annihilation operators. These elementary excitations are hard-core bosons with the Pauli commutation rules .
This Hamiltonian is derived using the Heitler–London and the adiabatic approximations in Appendix A. The relevant states form three manifolds (ground state, single- and double-excitons). The ground state energy is given by 〈0|Ĥ(e)0〉 = 0. In the single-exciton manifold the mth singly-excited state energy is , and the resonant coupling between singly-excited states m and n is given by . The 𝒩 single-exciton eigenstates |e〉 are related to the local excitations by the transformation matrix ϕme:
| (2) |
The eigenvalues εe are obtained by diagonalizing the matrix hmn = Jnm + δmnεm. We thus find that the single-excited states are characterized by J coupling.
The double-exciton state energies are (m > n) : the K coupling thus manifests in the double-exciton manifold by shifting double-exciton energies. The off-diagonal coupling between two different double-exciton states is (m > n and k > l): J coupling is responsible for double-exciton delocalization.
The double-exciton eigenstates |f〉 may be expanded in the basis set of direct Product of Real Space Excitations (PRSE) (with m > n) by
| (3) |
where Φ is a transformation matrix. The notation is simplified by including a pair (mm) in the basis set and setting Φ(mm),f ≡ 0. The Φ matrix is obtained by diagonalizing the double-exciton block of the Hamiltonian. The eigenvalues (energies) now depend on εm, Jmn and Kmn.
Double-exciton states may be alternatively expressed in the basis of Products of single-exciton Eigenstate Space Excitations (PESE) [29], |ee′〉, by transformation:
| (4) |
where
| (5) |
is the unitary transformation matrix (m ≥ n and e ≥ e′); . The double-exciton states may then be expanded in the PESE basis as
| (6) |
| (7) |
This relationship between the single-exciton and double-exciton eigenstates through Ψ matrix is very convenient when describing double-exciton resonances and their relation with single-exciton resonances [29]. Note that in the PRSE basis the excitons are hard-core Bosons. In the PESE basis this is no longer the case: two e and e′ excitations which compose a single double-exciton are spatially delocalized and thus Ψ(ee),f is finite.
Since we are using a normally-ordered form of the Hamiltonian, the single-exciton manifold only depends on J couplings. K couplings only affect the double-exciton (and higher) manifolds. Jmn is dominant for near degenerate chromophores εm ≈ εn but is negligible when their energy difference Δmn = |εm − εn| is large, Jmn ≪ Δmn (the J-induced frequency shift is ~ J2/Δ). In that limit the leading contributions to the energy-shifts come from K. In NMR J and K are known as strong and weak coupling and dominate homonuclear and heteronuclear signals, respectively [30].
In the dipole approximation for molecular charge densities the J and K couplings are given by transition dipoles µm, and difference of permanent dipoles, dm, between the excited state and the ground state (see Appendix A):
| (8) |
| (9) |
where Rmn is the vector connecting chromophores m and n. More general expressions in terms of charge distributions are given in Appendix A. The K coupling can be ignored for signals related to single-exciton properties, where J controls single-exciton eigenvalues, exciton delocalization and relaxation. It is also negligible when the dipole moment in the molecular excited state is similar to that of the ground state so that the difference is much smaller than the transition dipole. Electronic structure calculations of Bacteriochlorophyll molecules (BChls), which are the main pigments in photosynthetic complexes, show that the difference of permanent dipole is comparable to the transition dipole [31]. The K couplings must thus be crucial for signals which are sensitive to double-exciton manifold, i.e. excited state absorption and exciton annihilation.
3. Signatures of exciton couplings in multidimensional signals of the FMO complex
The FMO photosynthetic complex (Fig. 1) is widely studied complex made of seven closely-packed bacteriochlorophyll a (BChla) molecules (Fig. 1). Evidence of excitonic interactions and relaxation pattern has been established by a variety of spectroscopic techniques. Its single-exciton Hamiltonian is well known from spectroscopy investigations (Table 1) [9,32–35]. We have calculated the K couplings assuming the dipole–dipole interaction (Eq. (9)) and the electronic structure calculations of Madjet et al. [31]: the magnitude of the d dipole of BChl molecule is 2.8 D (we use HF-CIS estimation) and it points out from ring I to ring III twisted 18° off ring V. The dipole origin is taken at the Mg atom. The calculated K couplings are given in Table 2 and will be denoted as K0. The signals were calculated using sum-over-eigenstates expressions as described by Abramavicius et al. [26].
Table 1.
Single-exciton Hamiltonian of FMO in cm−1 (ε-diagonal and J-offdiagonal) taken from Brixner et al. [8]. The exciton state energy of chromophore 7 (12,400 cm−1) is set to 0.
| 1 | 2 | 3 | 4 | 5 | 6 | 7 | |
|---|---|---|---|---|---|---|---|
| 1 | 20 | ||||||
| 2 | −106 | 160 | |||||
| 3 | 8 | 28 | −260 | ||||
| 4 | −5 | 6 | −62 | −85 | |||
| 5 | 6 | 2 | −1 | −70 | 60 | ||
| 6 | −8 | 13 | −9 | −19 | 40 | 100 | |
| 7 | −4 | 1 | 17 | −57 | −2 | 32 | 0 |
Table 2.
The K couplings in cm−1 (set K0) between molecules calculated from Eq. (9).
| 1 | 2 | 3 | 4 | 5 | 6 | |
|---|---|---|---|---|---|---|
| 2 | −26.3 | |||||
| 3 | 0.04 | 8.52 | ||||
| 4 | −1.53 | 2.10 | −17.1 | |||
| 5 | 2.51 | −0.17 | 0.08 | −10.0 | ||
| 6 | −6.99 | 4.63 | −1.97 | −5.87 | 34.15 | |
| 7 | −3.79 | 0.18 | −11.3 | −14.5 | 3.70 | 7.14 |
Each chromophore is assumed to be coupled to two, one fast and one slow, overdamped Brownian oscillators responsible for homogeneous and inhomogeneous line broadening. The spectral density corresponding to chromophore n is
| (10) |
We have used the relaxation timescales ps. The following coupling strengths were used to fit the experimental absorption spectrum: for chromophores 1, 2, 5, 6; 30 cm−1 for chromophore 3 and 80 cm−1 for chromophores 4 and 7; for all chromophores (this corresponds to Gaussian diagonal disorder with 20 cm−1 variance).
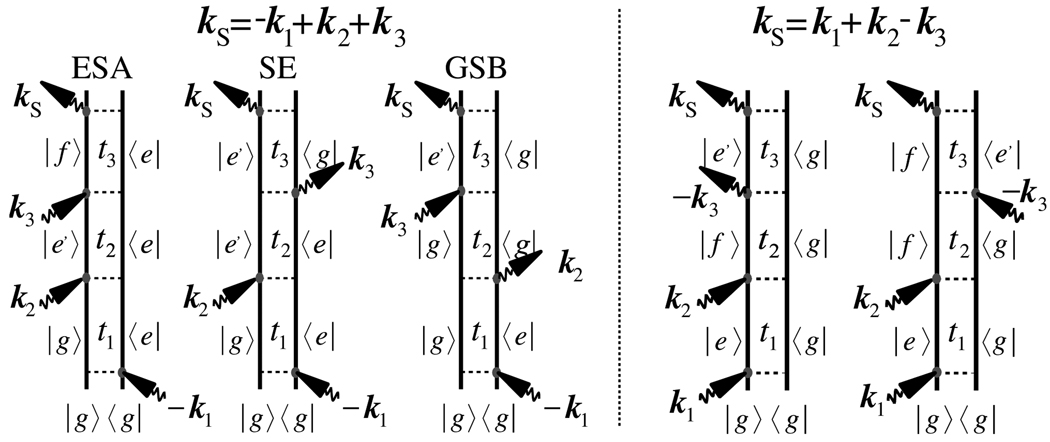
We have studied the signatures of K couplings in two types of signal [26]. The two-dimensional photon-echo (2D PE) signal (see Fig. 1) generated in phase-matching direction kI = −k1 + k2 + k3 is the most common 2D technique for probing exciton dynamics (kj is the wavevector of laser pulse j). This signal is described by the three Feynman diagrams shown in Fig. 2 (left) which reflect excited state emission (ESE), ground state bleaching (GSB) and the excited state absorption (ESA) pathways. The ESA and GSB pathways are limited to the single-exciton space and, thus containing signatures of J couplings. The ESA pathway involves the double-exciton states during t3, thus, carrying information about K couplings.
Fig. 2.
Double-sided Feynman diagrams for the photon echo technique (left) and the double-quantum coherence signal (right).
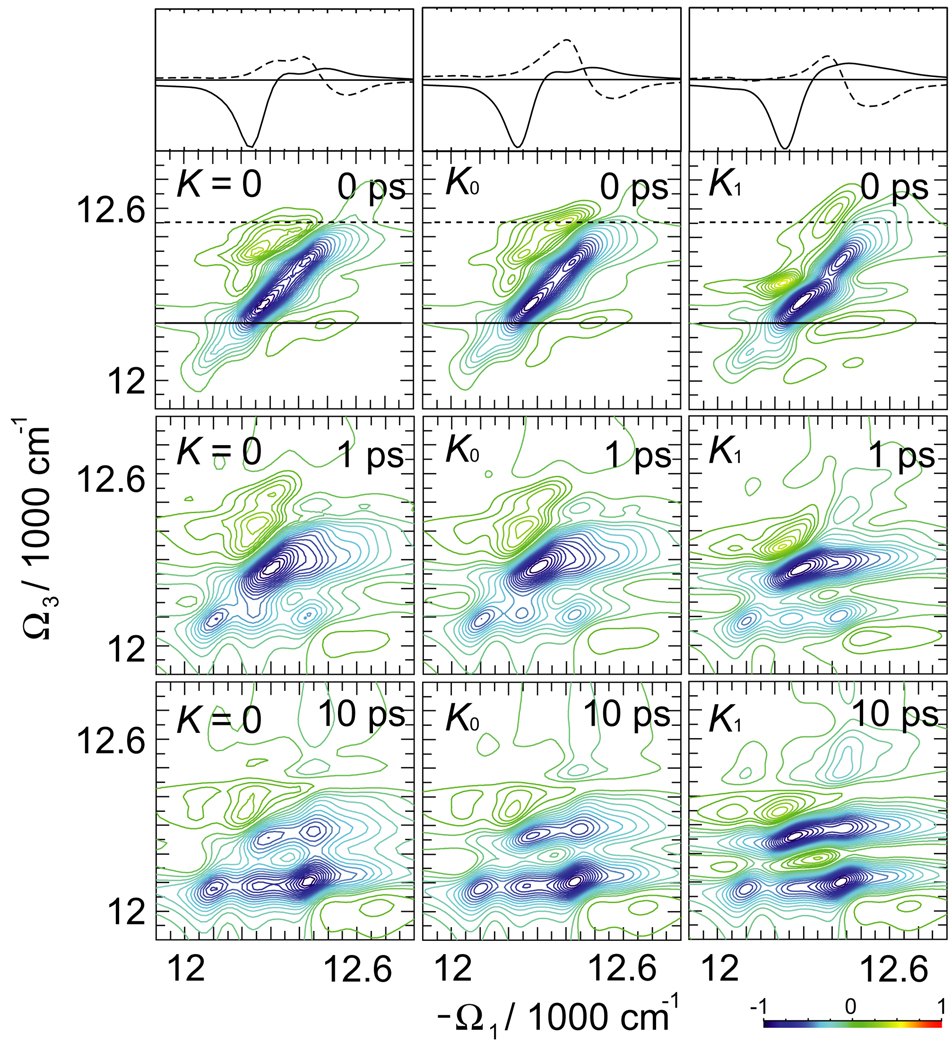
The simulated 2D PE signal is displayed in Fig. 3. At t2 = 0 crosspeaks related to J coupling can be identified, reflecting cooperative exciton dynamics. The lineshapes are elongated along the main diagonal, which is characteristics of slow bath fluctuations. At longer t2 delay times the exciton transport can be followed through the redistribution of blue crosspeak amplitudes. The difference between K = 0 and K0 can be identified by changes in green/yellow-color regions, which signify the induced absorption and are sensitive to K couplings. Thus the main exciton peaks are unaffected by K. Only small part of the 2D plot reveals the K dependence of ESA. The sections of the 2D plot show (black solid and dotted lines) that K0 induces significant variations of various peak amplitudes. These differences become smaller at long t2.
Fig. 3.
Simulated 2D PE signal SkI (Ω3, t2, Ω1) of FMO for different delay times t2 and three sets of K couplings, as indicated. The top traces show the sections of t2 = 0 signal as marked by the black solid and dashed lines in 2D plots. The line-style of the sections corresponds to the marker style in the 2D plots.
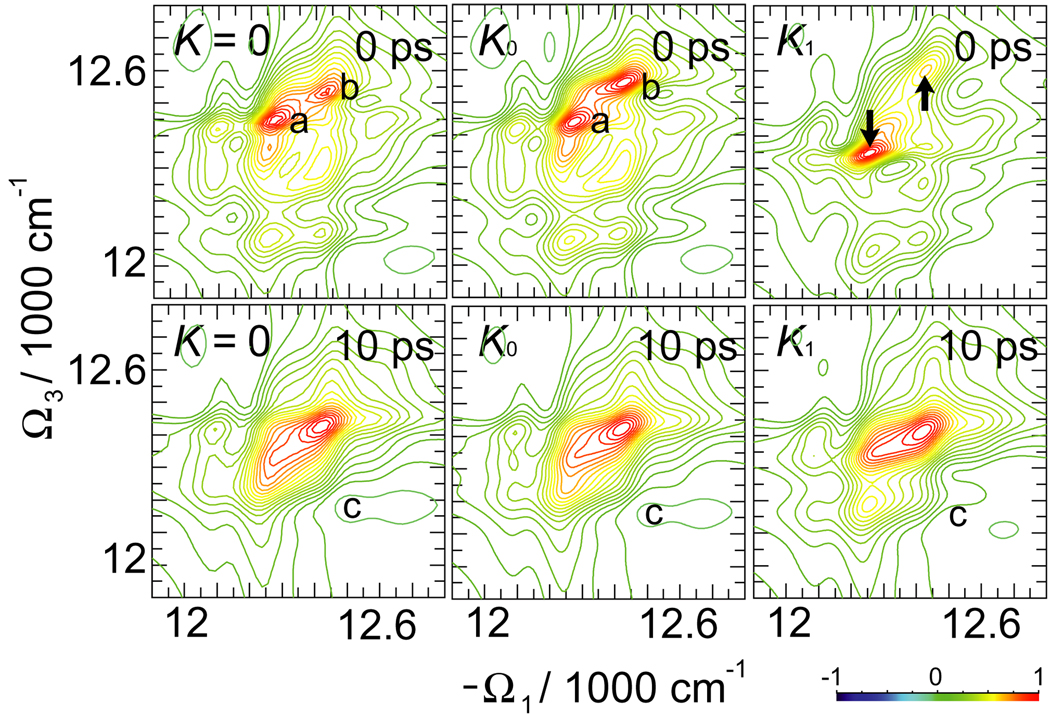
In Fig. 4 we show the ESA contribution to the 2D signal and its dependence on K couplings (the other, ESE and GSB, contributions do not depend on K and thus are not shown). K0 induce small but visible changes to the ESA: the peaks amplitudes significantly change at t2 = 0. For the two strongest peaks we have: a is stronger than b for K = 0, while b is stronger than a for K0. At longer delay times the signatures of K couplings vanish.
Fig. 4.
ESA contribution to the 2D PE signal SkI (Ω3, t2, Ω1) of FMO at different delay times t2 and three sets of K couplings.
For comparison we also show the signal calculated using larger couplings K1 = 4K0. The K1 spectra show larger changes in Figs. 3 and 4: the various peaks change amplitudes. Two strongest peaks a and b shift as indicated by black arrows. At long t2 some variation can be observed for peak c. The ESA contribution to the signal alone is however not a direct experimental observable.
We have further simulated the two-dimensional double-quantum coherence signal (2D 2Q) generated in kIII = k1 + k2 − k3. The corresponding Feynman diagrams are shown in Fig. 2 (right) [29,36]. Both diagrams are of the ESA type: they only differ by the order of two final interactions. During the delay time t2 the diagrams show double-exciton resonances, which directly depend on K couplings. During t3 the two diagrams show different resonances. The two diagrams exactly cancel when t3 = 0. They show oscillations with single-exciton frequencies in t1 and double-exciton frequencies during t2.
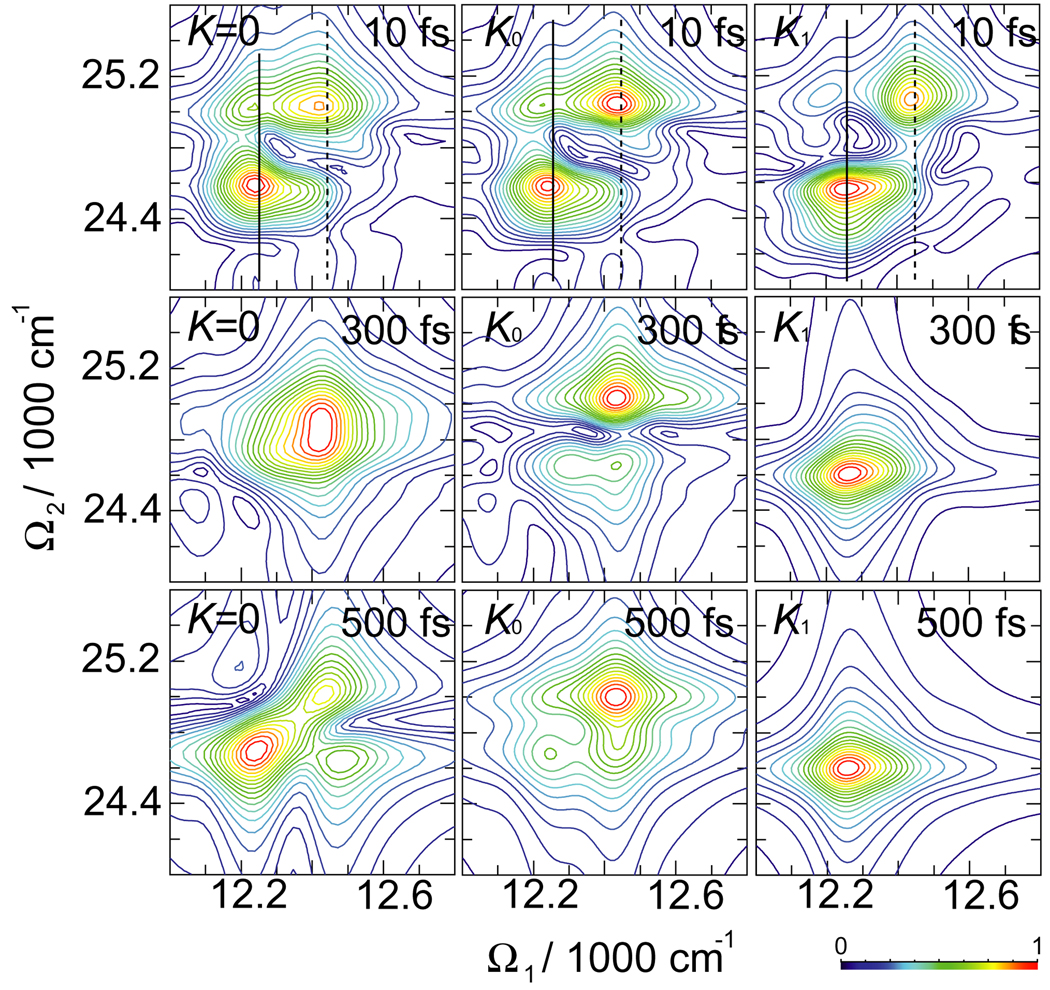
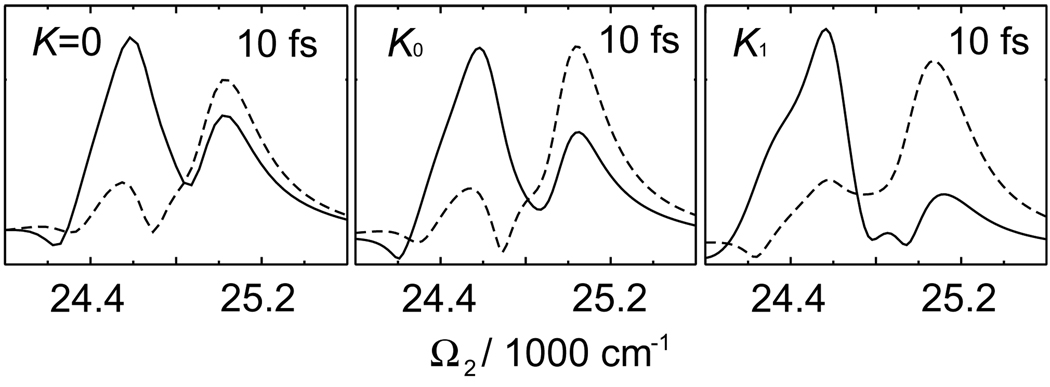
A convenient 2D representation of the signal uses the Fourier transform with respect to t1 and t2 at a fixed but finite t3 > 0. The absolute value of this signal is presented in Fig. 5. It shows very high sensitivity to the K couplings. At t3 = 10 fs, K0 shows changes in peak amplitudes and peak positions compared to K = 0. These are strongly-affected by the K couplings as can be seen in sections of 2D signal separately shown in Fig. 6. At longer t3 the peak patterns between K = 0, K0 and K1 be included change dramatically. Note that the single-exciton resonances along Ω1 axis do not change. The t3 evolution offers direct probe of double-exciton wavefunctions in the PESE basis (Eq. (4)). Our simulations show that double-exciton wavefunctions are very sensitive to K.
Fig. 5.
Absolute value of the simulated 2D 2Q signal SkIII (t3, Ω2, Ω1) of FMO for different delay times t3 and three sets of K couplings. Black solid and dashed lines mark the sections plotted in Fig. 6.
Fig. 6.
Sections of the simulated 2D 2Q signal SkIII (t3, Ω2, Ω1) of FMO at t3 = 10 fs along the black solid and dotted lines marked in Fig. 5. The line-style of the sections corresponds to the marker style in the 2D plots.
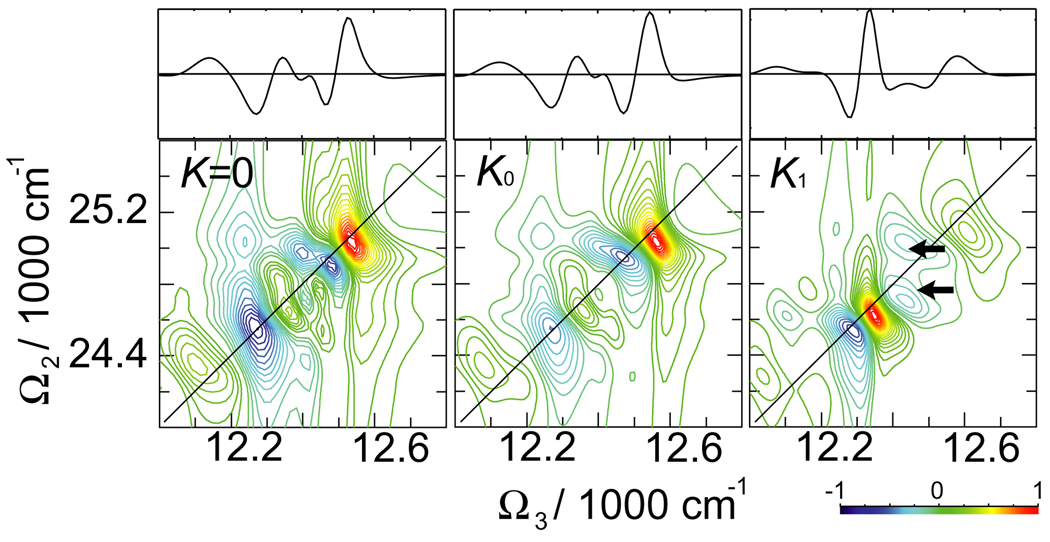
A different, (Ω2, Ω3), projection of the 2D 2Q signal at t1 = 0 is shown in Fig. 7 (the t1 evolution reflects exciton wavefunction as can be seen from diagrams in Fig. 2, while peak amplitudes decay as in the linear polarization; we thus keep t1 = 0). The peaks along Ω3 mix the single-exciton and double-exciton states and their resonances. The influence of K couplings is strong: this is confirmed by the section plots. K0 couplings significantly change distribution of peak amplitudes (see ratio between two strongest negative peaks in the section plot). K1 shows clear frequency shifts.
Fig. 7.
Imaginary (absorptive) part of the 2D 2Q signal SkIII (Ω3, Ω2, t1 = 0) signal of FMO for various K couplings. On top shown are the sections of the signal along the black solid and dashed lines as marked on 2D plots. The line-style of the sections corresponds to the marker style in the 2D plots.
4. Discussion and conclusions
Our simulations demonstrate that the kI technique is most sensitive to properties of the single-exciton manifold, governed by site energies and J couplings. Many earlier simulations have been performed and compared with experiment, firmly establishing the single-exciton Hamiltonian block [8,33,37]. Note that the exciton transport timescales and pathways are related to overlaps of single-exciton wavefunctions ψ, which also reflect the J coupling network.
The kI signals are only weakly-sensitive to the double-exciton block via the ESA (and the K). Double-quantum 2D signals on the other hand are highly sensitive to the K couplings, since they directly probe the double-exciton manifold. It should be noted that these signals are equally sensitive to the single-exciton manifold through the single-exciton resonances along either the Ω1 or the Ω3 axis. The K couplings mainly induce the shifts of the double-exciton eigen energies. Observed variations of the double-exciton peaks mainly come from K-induced perturbations of the interference pattern of strongly-overlapping positive and negative contributions. Note that the K-induced shifts (1–50 cm−1) are smaller than the absorption linewidth. However these small variations of transition frequencies in 2D 2Q signals are mapped into strong variations of the peak amplitudes.
The K couplings originate from the permanent dipole differences in the ground and excited state of molecules. These dipoles are relatively weak in FMO pigments. However, in more close-packed BChls (like in the photosynthetic reaction center) the excited state permanent dipole moment is highly affected by the surrounding BChls and contributions of the charge-transfer (CT) states become significant. The K couplings could then be very strong due to the large dipole moments of the CT states. The CT character of excited states are also important in donor–acceptor complexes. The accuracy of the estimated K couplings can be further improved by going beyond dipole–dipole coupling model [31]. Higher multipoles or the entire excited-state and transition charge distributions can be included using the expressions given in Appendix A.
In conclusion, we note that by combining the −k1 + k2 + k3 and k1 + k2 − k3 signals we can obtain the exciton Hamiltonian parameters directly from experiment: the single-exciton manifold and J couplings are obtained from the absorption, pump–probe as well as 2D kI signals. The K couplings can then be obtained from the double-quantum signals. The sensitivity can be further increased and specific resonances enhanced and optimized using chirality-induced techniques combined with coherent control and pulse shaping algorithms [28,38].
Acknowledgements
This research was supported by the National Institutes of Health (GM59230) and National Science Foundation (CHE-0745892).
Appendix A. The Frenkel-exciton hamiltonian
In this appendix we derive the exciton Hamiltonian based on the Heitler–London and adiabatic approximations. The Frenkel exciton Hamiltonian for an excitonic aggregate is
| (A.1) |
where ĥn = K̂n + Ûn is the Hamiltonian of isolated chromophore: K̂n is the kinetic energy operator of all electrons of chromophore n, Un is the intramolecular potential energy operator. Vmn is the intermolecular Coulomb interaction energy consisting of electron–electron, nuclei–nuclei and electron–nuclei interactions [31]:
| (A.2) |
where q is an electron charge, N is the number of electrons, r are electron coordinates and R are the nuclei coordinates; Z denote the atomic number (N reflects Pauli principle for exchange of electrons).
We consider two-level chromophores and denote the ground state wavefunction of chromophore n as
| (A.3) |
its excited state is
| (A.4) |
where φ denotes the wavefunction of electrons in the field of nuclei and R̄kn denotes the position of kth nuclei of nth molecule.
We next introduce excitation creation and annihilation operators. In the Heitler–London approximation the ground state of the aggregate is given by . The singly-excited state of a complex is obtained by promoting one chromophore to its excited state, which is obtained by acting with nth excitation creation operator: . Double excitations on a single chromophore are not allowed so we have . However, double excitations of the complex can be created by promoting two different chromophores to their singly-excited states. We thus get . B̂ have the commutation relations of Paulions (hard-core bosons) .
Using the basis of |0〉, and shifting the ground-state energy to 0, we construct the Frenkel exciton Hamiltonian in Eq. (1). The various parameters in this Hamiltonian are given as follows:
| (A.5) |
is the excitation energy of chromophore m adjusted by inter-chromophore interactions. The angular brackets denote integration over coordinates of all particles; we have additionally introduced the molecular charge density
| (A.6) |
for arbitrary states a, b.
| (A.7) |
is the resonant J coupling between transition charge densities of two chromophores and
| (A.8) |
is the K coupling between densities of charge-differences.
Using the dipole approximation we replace the charge densities by dipole moments. We define the transition dipole
| (A.9) |
and the charge-difference dipole between the molecular excited state and the ground state charge distributions
| (A.10) |
Eqs. (8) and (9) are obtained by making multipole expansion of Eqs. (A.7) and (A.8) and using Eqs. (A.9) and (A.10) [4].
References
- 1.Olson J. Photosynth. Res. 2004;80:181. doi: 10.1023/B:PRES.0000030428.36950.43. [DOI] [PubMed] [Google Scholar]
- 2.McDermott G, Prince SM, Freer AA, Hawthornthwaite-Lawless AM, Papiz MZ, Cogdell RJ, Isaacs NJ. Nature. 1995;374:517. doi: 10.1006/jmbi.1997.0966. [DOI] [PubMed] [Google Scholar]
- 3.Jordan P, Fromme P, Witt H, Klukas O, Saenger W, Krauß N. Nature. 2001;411:909. doi: 10.1038/35082000. [DOI] [PubMed] [Google Scholar]
- 4.van Amerogen H, Valkunas L, van Grondelle R. Photosynthetic Excitons. Singapore: World Scientific; 2000. [Google Scholar]
- 5.Gobets B, van Grondelle R. Biochim. Biophys. Acta. 2001;1507:80. doi: 10.1016/s0005-2728(01)00203-1. [DOI] [PubMed] [Google Scholar]
- 6.Muller M, Niklas J, Lubitz W, Holzwarth A. Biophys. J. 2003;85:3899. doi: 10.1016/S0006-3495(03)74804-8. [DOI] [PMC free article] [PubMed] [Google Scholar]
- 7.Novoderezhkin VI, Rutkauskas D, van Grondelle R. Biophys. J. 2006;90:2890. doi: 10.1529/biophysj.105.072652. [DOI] [PMC free article] [PubMed] [Google Scholar]
- 8.Brixner T, Stenger J, Vaswani HM, Cho M, Blankenship RE, Fleming GR. Nature. 2005;434:625. doi: 10.1038/nature03429. [DOI] [PubMed] [Google Scholar]
- 9.Engel GS, Calhoun TR, Read EL, Ahn TK, Mančal T, Cheng YC, Blankenship RE, Fleming GR. Nature. 2007;446:782. doi: 10.1038/nature05678. [DOI] [PubMed] [Google Scholar]
- 10.Heijs DJ, Dijkstra AG, Knoester J. Chem. Phys. 2007;341:230. [Google Scholar]
- 11.Pugzlys A, Hania PR, Augulis R, Duppen K, van Loosdrecht PHM. Int. J. Photoenergy. 2006;2006 ID 29623. [Google Scholar]
- 12.Zhang Q, Atay T, Tischler JR, Bradley MS, Bulovic V, Nurmikko AV. Nature Nanotechnol. 2007;2:555. doi: 10.1038/nnano.2007.253. [DOI] [PubMed] [Google Scholar]
- 13.Davydov A. A Theory of Molecular Excitons. New York: McGraw-Hill; 1962. [Google Scholar]
- 14.Rashba EI, Sturge MD, editors. Excitons. Elsevier; 1987. [Google Scholar]
- 15.Mukamel S, Chemla DS, editors. Chem. Phys. vol. 210. Elsevier; 1996. Confined excitations in molecular and semiconductor nanostructures; p. 1. [Google Scholar]
- 16.Markovitsi D, Small G, editors. Chem. Phys. vol. 275. Elsevier; 2002. Photoprocesses in multichromophoric molecular assemblies; p. 1. [Google Scholar]
- 17.Agranovich VM, La Rocca GC, editors. Organic Nanostructures: Science and Applications; International School of Physics Enrico Fermi. vol. 149. Amsterdam: IOS Press; 2002. [Google Scholar]
- 18.Knoester J, Agranovich VM. Thin Films Nanostruct. 2003;31:1. [Google Scholar]
- 19.Ohta M, amd Yang K, Fleming GR. J. Chem. Phys. 2001;115:7609. [Google Scholar]
- 20.Fidder H. Chem. Phys. 2007;341:158. [Google Scholar]
- 21.Tanimura Y, Mukamel S. J. Chem. Phys. 1993;99:9496. [Google Scholar]
- 22.Mukamel S. Annu. Rev. Phys. Chem. 2000;51:691. doi: 10.1146/annurev.physchem.51.1.691. [DOI] [PubMed] [Google Scholar]
- 23.Chernyak V, Zhang WM, Mukamel S. J. Chem. Phys. 1998;109:9587. [Google Scholar]
- 24.Zhang W, Chernyak V, Mukamel S. J. Chem. Phys. 1999;110:5011. [Google Scholar]
- 25.Zigmantas D, Read E, Mančal T, Brixner T, Gardiner A, Cogdell R, Fleming G. Proc. Nat. Acad. Sci. USA. 2006;203:12672. doi: 10.1073/pnas.0602961103. [DOI] [PMC free article] [PubMed] [Google Scholar]
- 26.Abramavicius D, Palmieri B, Voronine DV, Šanda F, Mukamel S. Chem. Rev. doi: 10.1021/cr800268n. in press. [DOI] [PMC free article] [PubMed] [Google Scholar]
- 27.Zhang WM, Chernyak V, Mukamel S. J. Chem. Phys. 1999;110:5011. [Google Scholar]
- 28.Abramavicius D, Voronine DV, Mukamel S. Biophys. J. 2008;94:3613. doi: 10.1529/biophysj.107.123455. [DOI] [PMC free article] [PubMed] [Google Scholar]
- 29.Abramavicius D, Voronine DV, Mukamel S. Proc. Nat. Acad. Sci. USA. 2008;105:8525. doi: 10.1073/pnas.0802926105. [DOI] [PMC free article] [PubMed] [Google Scholar]
- 30.Scheurer C, Mukamel S. J. Chem. Phys. 2002;116:6803. [Google Scholar]
- 31.Madjet ME, Abdurahman A, Renger T. J. Phys. Chem. B. 2006;110:17268. doi: 10.1021/jp0615398. [DOI] [PubMed] [Google Scholar]
- 32.Louwe RJW, Vrieze J, Hoff AJ, Aartsma TJ. J. Phys. Chem. B. 1997;101(51):11280. [Google Scholar]
- 33.Vulto S, de Baat M, Louwe R, Permentier H, Neef T, Miller M, van Amerongen H, Aartsma T. J. Phys. Chem. B. 1998;102:9577. [Google Scholar]
- 34.Prokhorenko VI, Holzwarth AR, Nowak FR, Aartsma TJ. J. Phys. Chem. B. 2002;106(38):9923. [Google Scholar]
- 35.Read EL, Engel GS, Calhoun TR, Mančal T, Ahn TK, Blankenship RE, Fleming GR. Proc. Nat. Acad. Sci. USA. 2007 doi: 10.1073/pnas.0701201104. doi:10.1073. [DOI] [PMC free article] [PubMed] [Google Scholar]
- 36.Li Z, Abramavicius D, Mukamel S. J. Am. Chem. Soc. 2008;130:3509. doi: 10.1021/ja0774414. [DOI] [PMC free article] [PubMed] [Google Scholar]
- 37.Vulto SIE, de Baat MA, Neerken S, Nowak FR, van Amerongen H, Amesz J, Aartsma TJ. J. Phys. Chem. B. 1999;103:8153. [Google Scholar]
- 38.Voronine D, Abramavicius D, Mukamel S. J. Chem. Phys. 2007;126:044508. doi: 10.1063/1.2424706. [DOI] [PubMed] [Google Scholar]


