Abstract
The spatial and temporal distributions of wall shear stress (WSS) in prototype vessel geometries of coronary segments are investigated via numerical simulation, and the potential association with vascular disease and specifically atherosclerosis and plaque rupture is discussed. In particular, simulation results of WSS spatio-temporal distributions are presented for pulsatile, non-Newtonian blood flow conditions for: (a) curved pipes with different curvatures, and (b) bifurcating pipes with different branching angles and flow division. The effects of non-Newtonian flow on WSS (compared to Newtonian flow) are found to be small at Reynolds numbers representative of blood flow in coronary arteries. Specific preferential sites of average low WSS (and likely atherogenesis) were found at the outer regions of the bifurcating branches just after the bifurcation, and at the outer-entry and inner-exit flow regions of the curved vessel segment. The drop in WSS was more dramatic at the bifurcating vessel sites (less than 5% of the pre-bifurcation value). These sites were also near rapid gradients of WSS changes in space and time – a fact that increases the risk of rupture of plaque likely to develop at these sites. The time variation of the WSS spatial distributions was very rapid around the start and end of the systolic phase of the cardiac cycle, when strong fluctuations of intravascular pressure were also observed. These rapid and strong changes of WSS and pressure coincide temporally with the greatest flexion and mechanical stresses induced in the vessel wall by myocardial motion (ventricular contraction). The combination of these factors may increase the risk of plaque rupture and thrombus formation at these sites.
Keywords: Blood flow simulation, Curved pipe, Bifurcating pipe, Wall shear stress
Introduction
It is widely accepted that the process of atherogenesis (i.e. the creation and development of atherosclerotic plaques in arteries) is affected critically by hemodynamic factors and is specifically related to wall shear stress (WSS). Wall shear stress expresses the tangential force per unit area that is exerted by the flowing fluid on the surface of the conduit tube:
| (1a) |
where dFs is the infinitesimal force exerted tangentially on the infinitesimal wall area dA, and τw the corresponding wall shear stress.
The magnitude of wall shear stress (measured in pressure units, Pa or dyn/cm2) depends on the gradient of the corresponding tangential velocity near the tube wall (du/dr), in other words on how fast the flow velocity increases when moving from the tube wall towards the center of the tube, and also on the dynamic viscosity (μ) which is a physical property of the fluid showing how easily the fluid is sliding. Wall shear stress τw is expressed as [1–3]:
| (1b) |
Atherogenesis is specifically related to low levels of WSS as well as high levels of oscillating amplitude of WSS (see, for instance, [4] and references therein). Following the initial controversy regarding the role of wall shear stress in the process of atherogenesis, consensus has been reached in the view that vessel locations with low levels of wall shear stress are favored for the creation of atheromatic plaque, as proposed initially by Caro et al. [5,6]. Several subsequent studies have validated this view [7–11], and have revealed that atherogenesis preferentially involves the outer walls of vessel bifurcations, side branches and regions of strong curvature in the arterial tree [8,12,13]. In these anatomically predisposed locations, the vessel wall shear stress is significantly lower in magnitude, and is associated with directional changes and flow separation, features absent from regions of the arterial tree that are generally spared from atherosclerosis [12–15]. Atherosclerotic lesions are located in regions of low wall shear stress throughout the arterial tree, e.g. at the carotid artery bifurcation [7,10,16], the coronary arteries [8,17], the abdominal artery [18] and the thoracic aorta [19]. The importance of WSS in plaque formation, plaque evolution and vascular disease is briefly discussed in the following sections.
WSS and vascular wall remodeling
It is assumed that vascular WSS remains at an optimal range of time-averaged values of 15 dyn/cm2 ± 50% [20]. Direct measurements and fluid mechanical models of the arterial regions susceptible to atheromatosis have revealed WSS values of the order of 4 dyn/cm2, which are considerably lower than the values in the neighborhood of 12 dyn/cm2 found in the protected areas [7,21]. In several experiments, WSS has been shown to actively influence vessel wall remodeling [22–24]. Specifically, chronic increases in blood flow, and the resultant increases in average WSS, lead to expansion of luminal radius such that the mean WSS value eventually returns to its baseline level [22,25–27]. Conversely, decreased values of average WSS resulting from lower flow or blood viscosity [28] induce a decrease in internal vessel radius [11,23,27]. It has been postulated, therefore, that the natural presence of curves and branch points in the arterial tree creates a local low WSS environment at birth which determines the localization of the initial fatty streak [29]. The natural low WSS environment may become exacerbated by the presence of the fatty streak, and may result in the exacerbation of the low WSS conditions immediately downstream from the fatty streak [30]. The low WSS environment may convert the fatty streak into a more pronounced atherosclerotic plaque, with the consequent development of even more extensive low WSS environment downstream. This progressive lowering of WSS may lead to further growth of the plaque and progressive atherosclerosis may result in a self-reinforcing manner.
Molecular mechanisms stimulated by WSS
The molecular mechanisms that mediate the flow-related physiological effects of WSS are under intensive investigation, and exciting data are emerging on this issue. A dysfunctional endothelium, characterized by decreased NO synthesis, facilitates several relevant physiological processes, such as vessel wall entry and oxidation of circulating lipoproteins, monocyte entry and internalization or inflammation, smooth cell proliferation and extracellular matrix deposition, vasoconstriction, as well as a prothrombotic state within the vessel lumen [31,32]. Endothelial dysfunction, traditionally recognised as the earliest manifestation of atheromatosis, is often the result of disturbances in the physiological pattern of blood flow which result in WSS alterations [33,34]. Atherogenesis is promoted by decreased WSS because it is associated with a reduction in several vascular wall functions including endothelial NO synthase (eNOS) production, vasodilatation and endothelial cell repair [35]. These are coupled with increases in reactive oxygen species (ROS), endothelial permeability to lipoproteins, leukocyte adhesion, apoptosis, smooth muscle cell proliferation and collagen deposition [36]. Interestingly, it has been demonstrated that WSS can even regulate gene expression, thus modulating endothelial biology [13,36,37].
WSS and platelet aggregation
Another well known role of WSS is the activation of blood platelets which is thought to be a major contributing factor to thrombotic disease, particularly in areas of high WSS values [38,39]. These high WSS areas may be natural, as in the severe stenoses caused by arteriosclerosis, or artificial, as in the cases of abnormal flow patterns produced by prosthetic heart valves [39]. It is likely that WSS promotes platelet aggregation, at least in part, by increasing both the number and efficiency of platelet–platelet collisions [38]. Increased collision efficiency at higher WSS may result from the direct effects of WSS on platelets to induce shear-dependent vWF (plasma protein von Willebrand factor) binding that results in platelet aggregation [40–44].
Clearly, the role of WSS in the process of plaque formation and rupture (and possible thrombosis) is multi-faceted and rather fundamental. This provides the motivation for examining in greater detail the spatio-temporal patterns of WSS in specific (prototypical) vessel geometries that are most commonly associated with atheromatosis in the arterial system.
The present work seeks to elaborate on the fundamental fluid mechanical aspects relevant to atherogenesis in two typical vessel geometries, representative of segments of the arterial system (curved and bifurcating pipes) that are often the site of atherosclerotic lesions and vulnerable plaques (often leading to thrombosis and myocardial infarctions in the case of coronary arteries). To this purpose, we have performed numerical simulations of pulsatile blood flow in prototype curved and bifurcating pipes, under conditions representative of those in coronary arteries, in order to produce reference data that can enhance our understanding of the flow-related aspects of the process of atherogenesis and possible plaque rupture in the more complex cases of real coronary arteries.
The paper is organized as follows. In the next section, we present the governing equations and the numerical methodology used for the flow simulations of the present study. In the subsequent two sections, we present our results and discuss their implications for the clinical problem of interest (flow-related aspects of atherogenesis and possible plaque rupture in coronary arteries).
Methods
We consider incompressible flows governed by the Navier–Stokes equations:
| (2a) |
| (2b) |
where ui is a velocity component, p is the static pressure, and ρ is the fluid density (for blood: ρ = 1060 kg/m3), while Sij = (1/2)(∂ui/∂xj + ∂uj/∂xi) are the elements of the strain rate tensor. The external force components fi are set equal to zero. The dynamic viscosity coefficient μ has a constant value if the fluid is considered Newtonian, while its value depends on the flow field for non-Newtonian fluids. In the present work, blood is modeled both as a Newtonian (with a dynamic viscosity coefficient of 0.0035 Pa s) and a non-Newtonian fluid, in the latter case using the widely accepted “Generalised Power Law” model [45,46] for expressing blood viscosity in terms of the shear rate (twice the strain rate):
| (3a) |
| (3b) |
| (3c) |
where, for blood and SI units, μ∞ = 0.0035, n∞ = 1.0, Δμ = 0.25, Δn = 0.45, a = 50, b = 3, c = 50, d = 4.
For a given vessel geometry, the flow structure and dynamics depend on the Reynolds number, defined at inflow as:
| (4) |
where U is the time-averaged mean inflow velocity, d is the vessel diameter, and ν is the kinematic viscosity, equal to the ratio: μ/ρ. Throughout the present work, Reynolds number Re = 80.4 is used as a value representative of blood flow in the coronary arteries.
The system of governing Navier–Stokes equations, constrained by the selected vessel geometry and appropriate boundary and initial conditions, was simulated for the three velocity components ui and p using the STAR-CD [47,48] computational platform based on the finite volume approach, according to which the prototypical vessel segments were decomposed into a number of finite volumes (cells). Illustrative examples of the grids for the two prototype geometries of vessel segments are given in Fig. 1.
Figure 1.
Illustrative examples of the two prototype geometries of vessel segments and the grid meshes used for the numerical simulation of blood flow: curved vessel (left) and bifurcating vessel (right).
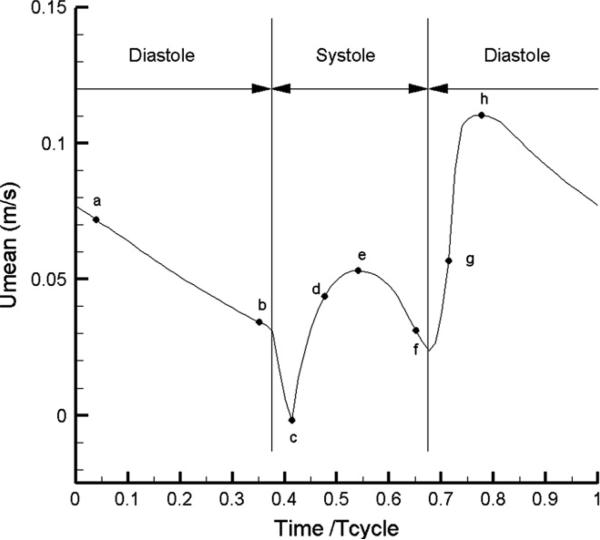
Two types of inflow velocity profiles were examined (a parabolic and a uniform) and the respective results were compared. Note that the instantaneous volume flow rate divided by the inflow cross-section gives the instantaneous mean velocity at inflow (independent of the type of velocity profile prescribed at the inflow). The temporal pattern of this mean velocity over a cardiac cycle was selected as the “representative waveform” based on well-accepted literature data [49], see Fig. 2. No-slip (zero-velocity) boundary conditions were prescribed for the velocity at the vessel walls, while Neumann velocity boundary conditions were implemented at the outflow boundary. In the simulations, the governing equations were integrated until a “statistical steady state” was reached – defined here as the state where a complex limit cycle is established (complex flow pattern of period equal to one cardiac cycle, which perfectly repeats itself). The time-dependent flow quantities presented in the following sections correspond to this state. The presented time-averaged WSS values correspond to the average over the cardiac cycle of the magnitudes of the instantaneous WSS vectors, which are calculated by processing the computed instantaneous velocity fields.
Figure 2.
The temporal pattern of flow velocity over one cardiac cycle that is used in the simulations (from Berne and Levy [49]). Eight pivotal time instants are marked by the letters a through h.
Results
The computational grids generated consisted of a number of finite volumes, typically of the order of a hundred thousand for the curved pipes, and two hundred thousand for the bifurcating pipes. The specific numbers of cells and nodes used for the numerical grids in the five cases of prototype vessel geometries are given in Table 1.
Table 1.
Number of cells and nodes used for discretizing the geometries studied.
| Geometry | Cells | Nodes | |
|---|---|---|---|
| Curved pipe | R/r = 2 | 65,000 | 69,000 |
| R/r = 4 | 73,000 | 77,000 | |
| R/r = 10 | 100,000 | 106,000 | |
| Bifurcating pipe | Angle = 50° | 220,000 | 228,000 |
| Angle = 80° | 182,000 | 192,000 |
We have performed both spatial and temporal resolution tests for the case of curved pipe flow, at R/r = 4, R being the curvature of the vessel center-line and r the pipe radius. (As the grid density is higher for the bifurcating pipes, we believe that the adequacy of the resolution used characterizes both geometry cases of the present study.) In addition to the standard (“high-resolution”) grid of Table 1, we have performed simulations on a coarser (“low-resolution”) grid, with a number of nodes approximately equal to half of those of the standard grid (not presented here for brevity). Steady-flow field results were compared in terms of velocity profiles at several pipe cross-sections, as well as wall shear stress distributions along representative wall segments. The profiles were nearly identical, suggesting the adequacy of the spatial resolution implemented.
The numerical time step used in the simulations was 0.0018112 s, corresponding to 400 time steps per cardiac cycle. We have also performed simulations with a time-step value twice as high (200 time steps per cardiac cycle) which have demonstrated the adequacy of temporal resolution used.
Curved pipes
We performed simulations of curved pipe flows at three values of normalized curvature: R/r = 2, 4, and 10, where R is the radius of the center-line of the curved pipe (i.e. the locus of the centers of pipe cross-sections) and r is the pipe radius. In all three cases, the vessel diameter was d = 0.0044 m, while the normalized entry length (length of the straight pipe portion before the curvature) was 4.55 times the pipe diameter (d = 2r), while the normalized outflow length (length of the straight pipe portion after the curvature) was 3.64 times the pipe diameter. The left panel of Fig. 1 shows the geometry details of the grid mesh close to the inflow, for R/r = 2. The entry length was chosen as to be sufficient for the flow to develop before the curved region, and thus be independent of the shape of the inflow profile. This independence has been verified by implementing both parabolic and uniform velocity profiles at inflow (see below) for both steady and pulsatile conditions. In the following, we will normalize the computed WSS values with a reference value, equal to the WSS of fully developed steady flow at the same Reynolds number. For the conditions of the present study, this reference value is equal to 0.38 Pa (3.8 dyn/cm2).
We start with simulations of Newtonian flow in curved pipes with three different values of normalized curvature. It is known that, for steady flows in curved pipes, the fluid elements at inflow are decelerated in the outer flow region (close to the outer wall), while they are accelerated in the inner flow region; the inverse is true for fluid elements approaching the end of the curved region [50]. Wall shear stress (WSS) is expected to drop in regions where the flow is decelerating, and rise in regions of accelerating flow. This provides the qualitative means for a first verification of the obtained simulation results.
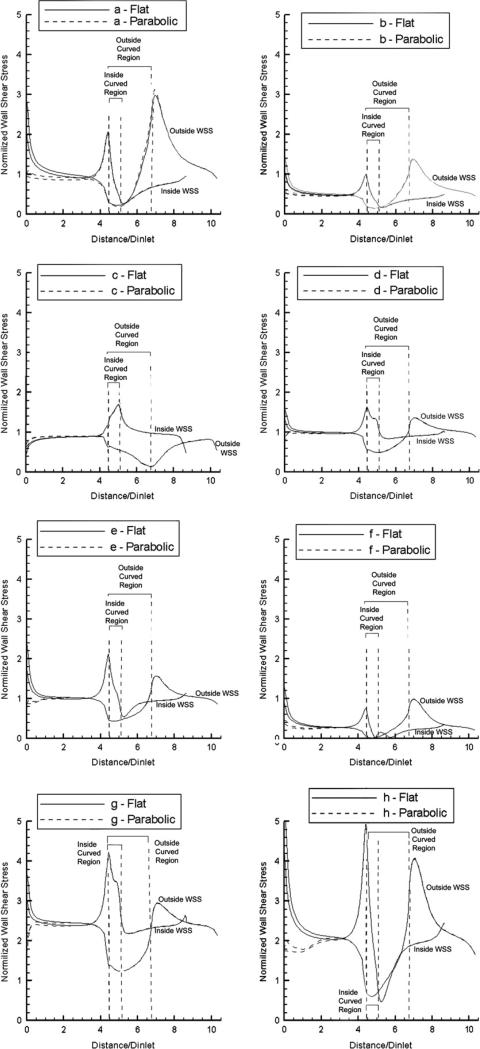
The resulting distributions of computed normalized WSS along the outside and the inside vessel walls, at mid-segment positions, are shown in Fig. 3 for R/r = 2 at the eight time points of the cardiac cycle indicated in Fig. 2 by the letters a through h. The results indicate a region of low WSS during the long diastolic phase (h-a-b) at the start of the curved portion on the outside wall, and at the end of the curved portion on the inside wall, while regions of high WSS are shown at the conjugate areas (i.e. at the end of the curved portion on the outside wall, and at the start of the curved portion on the inside wall). Also indicated are big changes during the rapid transition from the systolic to the diastolic phase (e-f-g-h), with very low WSS values observed along the entire vessel segment at time point f that represents the cusp of the systolic–diastolic transition. In Fig. 3 we show the results for both flat and parabolic inflow velocity profiles, and demonstrate that the WSS distributions become identical after an entry length of about 3.5 pipe diameters.
Figure 3.
Normalized WSS distributions at eight pivotal time instants during the cardiac cycle (see Fig. 2) along the outside and inside wall mid-segments of the curved vessel (R/r = 2) for flat and parabolic inlet velocity profiles (Newtonian flow model).
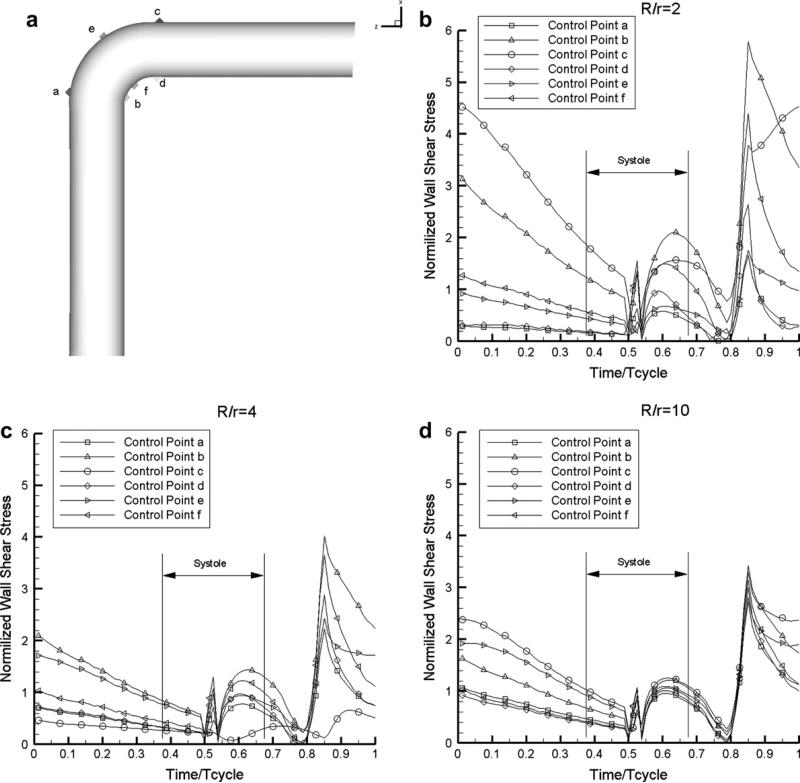
The time course of the computed WSS at six control points at the start, middle and end of the curved portion is shown in Fig. 4 for the three curvatures: R/r = 2, 4, and 10. These results indicate low WSS levels at the start and end of systole, as well as rapid changes at those time points. The different time evolution of WSS at the six points considered is consistent with the results shown in Fig. 3. These observations regarding the spatial distribution of WSS are common for all three curvatures, although the time variations become milder at increasing R/r values (less curved vessels).
Figure 4.
Temporal profiles of the normalized WSS during the cardiac cycle at six control points of the curved vessel marked in (a), for three degrees of curvature: (b) R/r = 2, (c) R/r = 4, (d) R/r = 10 (Newtonian flow model).
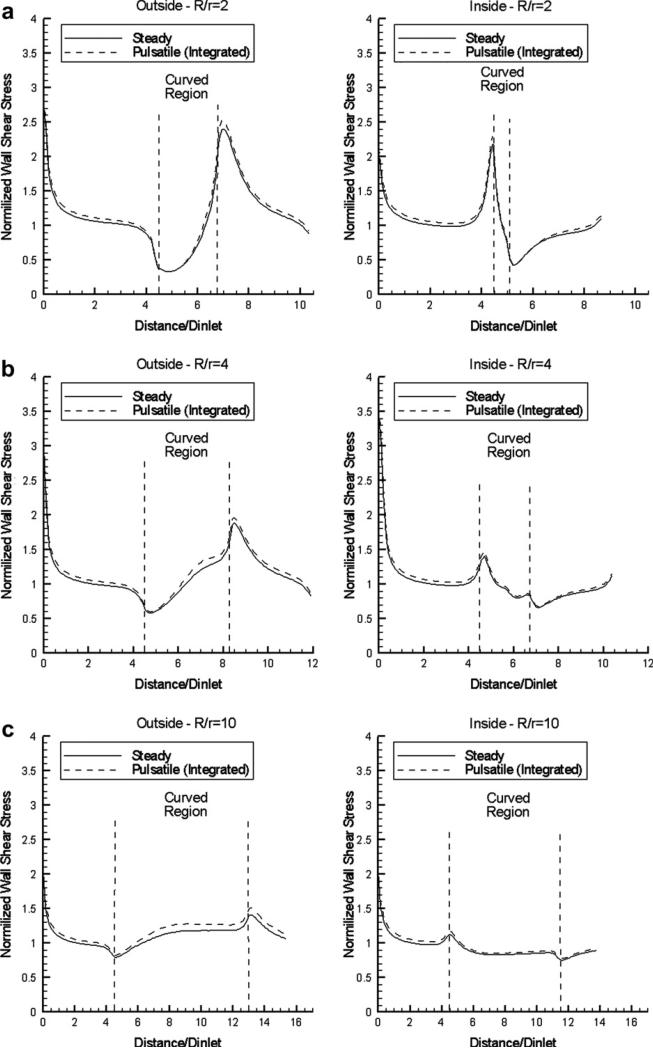
The time-averaged values of WSS for curvature R/r = 2, 4 and 10 and flat inflow profile are compared with the results under steady-flow conditions in Fig. 5, and shown to be nearly identical. A comparison with the corresponding results for parabolic inflow profile (not shown for brevity) indicates that WSS distributions become identical approximately 3.5 diameters downstream of the inflow. In all cases, the regions of low and high WSS are the same (at the start and end of the curved portion), but the respective WSS deviations from the normalized reference value of 1 are smaller at higher R/r values (see Fig. 5). This illustrates that the regions of low WSS (usually associated with atherogenesis) are constricted for high values of non-dimensional vessel curvature or, conversely, they are expanded in strongly curved vessels.
Figure 5.
Normalized WSS distributions along the outside and inside curved vessel wall mid-segments, for steady flow and pulsatile flow (time-averaged results) using a flat inlet velocity profile: (a) R/r = 2, (b) R/r = 4, (c) R/r = 10 (Newtonian flow model).
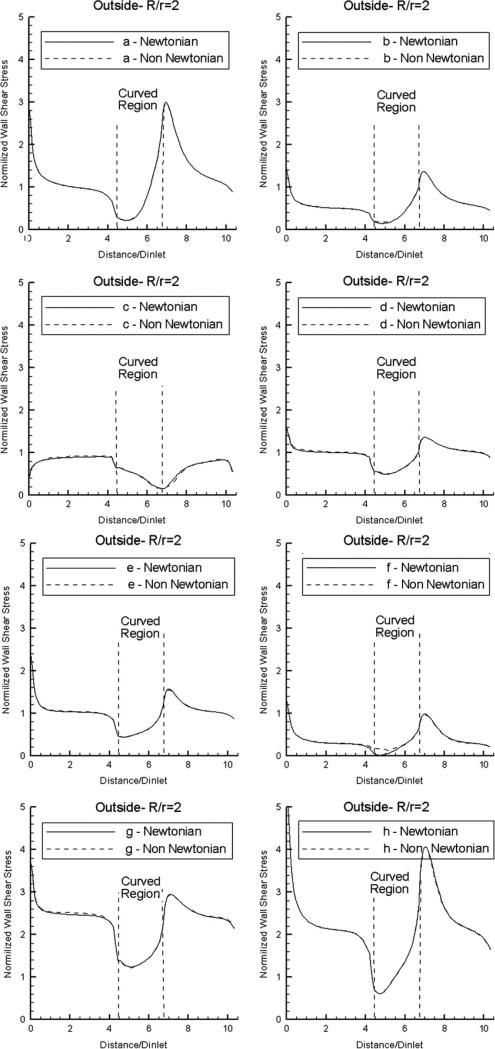
Next, we examine the effect of non-Newtonian flow on the computed normalized WSS distributions. Results are shown in Fig. 6 for the outside wall mid-segments, in the case R/r = 2. It is evident that the effect of non-Newtonian flow (as defined by the widely accepted “Generalized Power Law” viscosity model) is negligible, except when the WSS values drop very close to zero in the Newtonian case (at time instant f) and given small (but clearly non-zero) values in the non-Newtonian case. The same observations were made for the distributions along inside wall mid-segments, as well as for the other two curvatures (results not shown in the interest of space). The good agreement between the Newtonian and non-Newtonian flow models can be explained as a result of the no-slip boundary condition imposed on the vessel wall that gives rise to substantial shear stress at the wall. For this reason, the effect of non-Newtonian flow is expected to be far more pronounced in the regions of low shear stress away from the vessel wall (i.e. in the bulk-flow region near the center-line of the vessel).
Figure 6.
Normalized WSS distributions at eight pivotal time instants during the cardiac cycle (see Fig. 2) along the outside wall mid-segment of the curved vessel (R/r = 2) for flat inlet velocity profile, using Newtonian and non-Newtonian flow models.
In order to characterise the temporal variation of WSS over the cardiac cycle and its dependence on the curvature, we present in Table 2 the minimum and maximum absolute values of normalized WSS at four out of the six control points shown in Fig. 4, as well as the max/min ratio, the max – min difference, and the normalized difference (max – min)/max. An interesting observation here is that more pronounced relative variations are observed at points a and d, which are characterized by low time-averaged WSS values.
Table 2.
WSS simulation results in curved pipes, at four control points marked in Fig. 4 (a through d ).
| R/r | R/r | R/r | ||
|---|---|---|---|---|
| WSS location | 2.0 | 4.0 | 10 | |
| Outer | τa min | 0.009 | 0.015 | 0.054 |
| τa max | 1.662 | 2.228 | 2.734 | |
| τamax/τamin | 185.119 | 145.845 | 50.261 | |
| τamax – τamin | 1.653 | 2.213 | 2.680 | |
| (τamax – τamin)/τamax | 0.995 | 0.993 | 0.980 | |
| τc min | 0.172 | 0.093 | 0.035 | |
| τc max | 5.785 | 4.018 | 3.424 | |
| τcmax/τcmin | 33.544 | 42.989 | 99.222 | |
| τcmax – τcmin | 5.612 | 3.924 | 3.390 | |
| (τcmax – τcmin)/τcmax | 0.970 | 0.977 | 0.990 | |
| Inner | τb min | 0.153 | 0.081 | 0.264 |
| τb max | 4.536 | 0.665 | 3.302 | |
| τbmax/τbmin | 29.724 | 8.166 | 12.487 | |
| τbmax – τbmin | 4.384 | 0.583 | 3.038 | |
| (τbmax – τbmin)/τbmax | 0.966 | 0.878 | 0.920 | |
| τd min | 0.035 | 0.241 | 0.016 | |
| τd max | 2.642 | 2.889 | 3.001 | |
| τdmax/τdmin | 75.477 | 11.995 | 188.725 | |
| τdmax – τdmin | 2.607 | 2.648 | 2.985 | |
| (τdmax – τdmin)/τdmax | 0.987 | 0.917 | 0.995 |
To examine the spatial dependence of this temporal variation of normalized WSS for curved pipes, we compute the spatial distribution of oscillatory shear index (OSI), which is a sensitive measure of the time variation of the direction of the wall shear stress vector. OSI is defined as [51–53]:
| (5) |
where is the WSS vector, and 〈〉 denotes time-average.
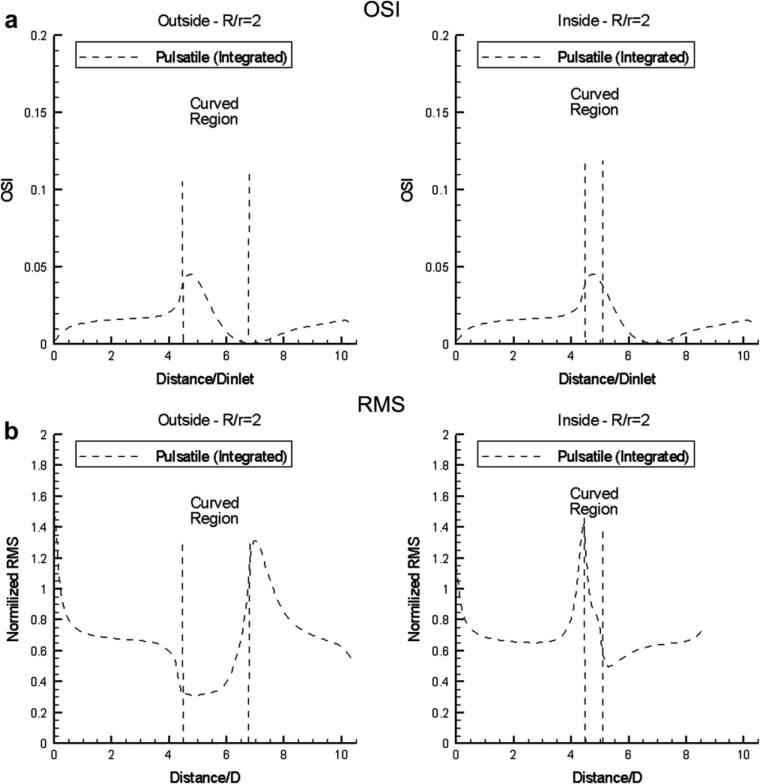
OSI is a dimensionless parameter that accounts for the degree of deviation of WSS from the antegrade flow direction. Small OSI values (close to 0) indicate small variations of WSS vector during the cardiac cycle. Conversely, OSI values close to 0.5 indicate that WSS vector is subject to large variations, and can be very small or change direction at parts of the cardiac cycle, which means that at those time instances flow is stopped or reversed. In the same context, the spatial distribution of the root-mean-square (RMS) value of normalized WSS variation over the cardiac cycle is also computed. The results for R/r = 2 are shown in Fig. 7 for the OSI and RMS distributions (the computed distributions for R/r = 4 and 10, not presented for brevity, are qualitatively similar, but the variations are smoother, and characterized by less pronounced maxima). It is evident that the RMS distributions (Fig. 7b) track closely the spatial pattern of the time-averaged normalized WSS (compare with Fig. 5), while the OSI patterns (Fig. 7a) exhibit in general the reverse trends (i.e. rising when the RMS values decline and vice-versa).
Figure 7.
(a) Oscillatory shear index (OSI) and (b) WSS root-mean-square (RMS) distribution along the outside and inside curved vessel (R/r = 2) wall mid-segments for flat inlet velocity profile (Newtonian flow model).
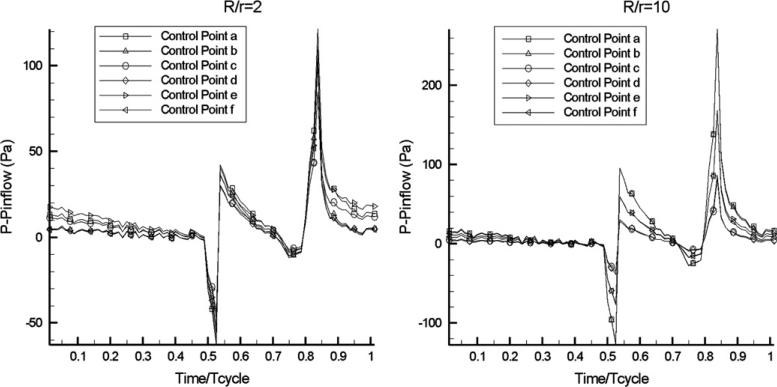
Finally, Fig. 8 presents the computed pressure traces for R/r = 2 and 10, at the six points identified in Fig. 4. Evidently, the computed pressures are characterized by sharp variations during the systolic phase, as well as by a sudden increase during diastole.
Figure 8.
Time-history of intravascular pressure (with respect to a reference value at inflow) in curved pipe flow at two values of non-dimensional curvature, at the six control points shown in Fig. 5 (Newtonian flow model).
Bifurcating pipes
We performed simulations of pulsatile blood flow in bifurcating pipes with two different bifurcation angles: 50° and 80°. In both cases, the normalized entry length (before the bifurcation) was 4.55 times the vessel diameter, while the same value was also prescribed for the outlet length. The diameter, d = 0.0044 m, was the same for all three pipes of the bifurcating segment (stem and two branches). The inflow velocity profile was always uniform. In order to examine the effect of “flow volume division” on the computed WSS distributions, three different splits of flow volume rates in the two downstream branches (1/1, 3/1, 7/1) were imposed in the simulations. These different divisions of flow volume rates are deemed to emulate the different splits caused in real bifurcating arteries by different types of lesions/stenoses at the branches or respective downstream vessel trees. The computational meshes were created with a total number of cells equal to approximately 220,000 for the 50° bifurcation angle and 182,000 for the 80° bifurcation angle, as indicated in Table 1. An illustration of the geometry and details of the mesh for the 80° bifurcation angle is shown in the right panel of Fig. 1. Illustrations of the patterns of steady-flow fields (in terms of velocity vectors) in the bifurcating segments for the aforementioned three divisions of volume flow rate are shown in Fig. 9.
Figure 9.
Illustration of the steady-flow fields (velocity vector plots) in the bifurcating segment with 80° angle for three different divisions of volume flow rate (50%–50%, 75%–25%, 87.5%–12.5%) (Newtonian flow model).
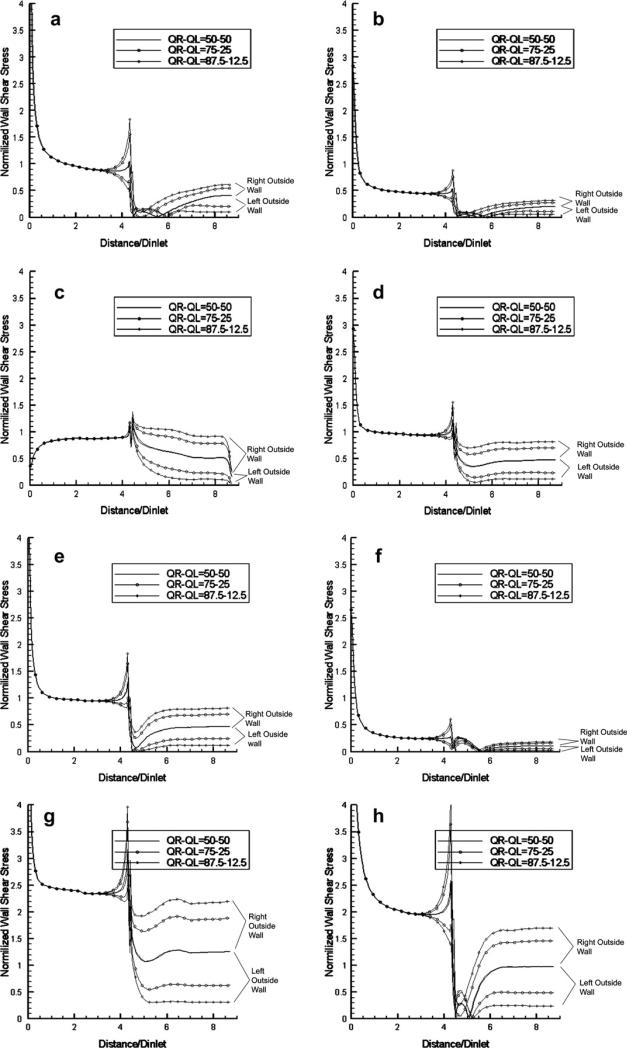
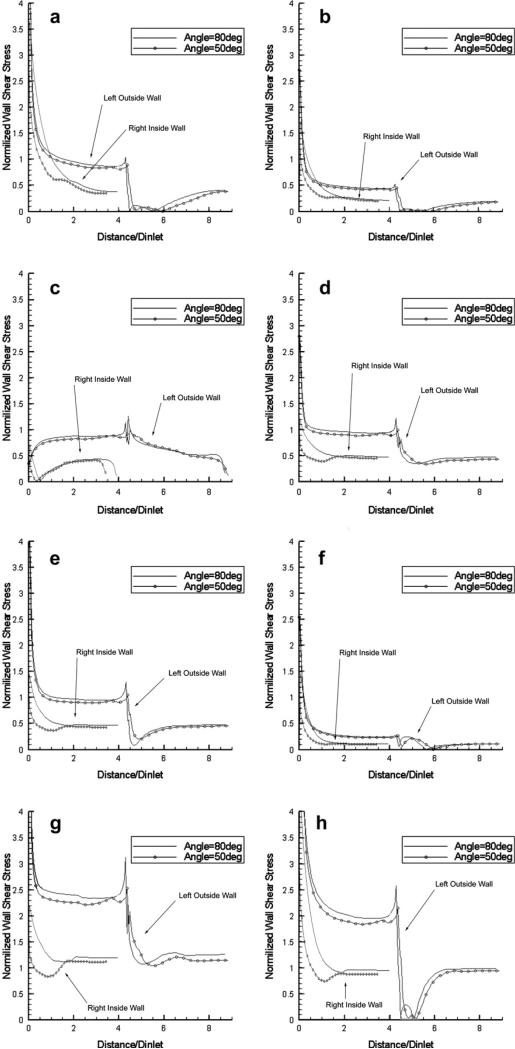
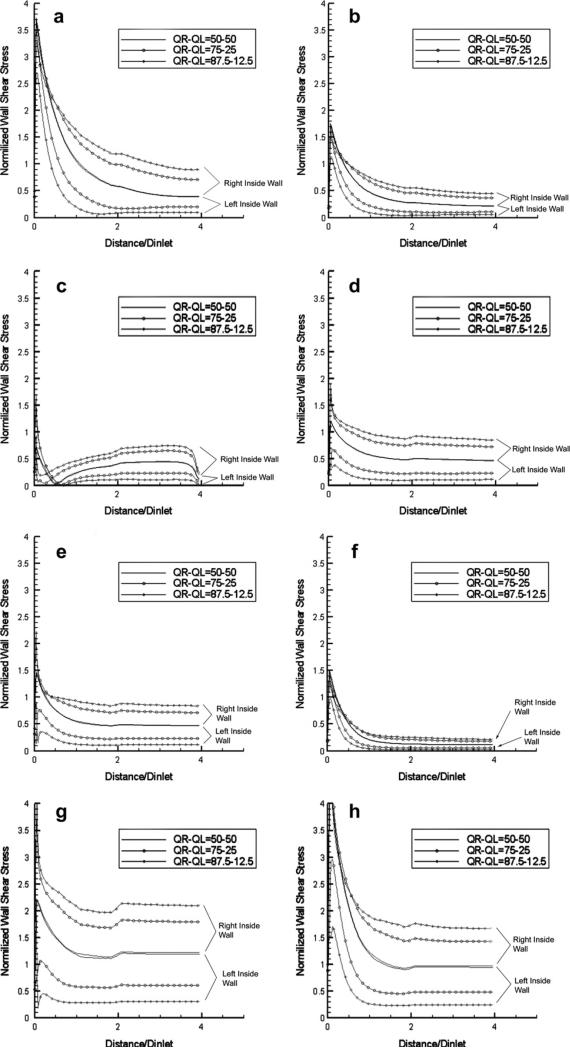
The results of the computed normalized WSS values are presented in Figs. 10–12 as spatial distributions along the four relevant wall segments (left-outside, right-outside, left-inside and right-inside mid-segments, respectively) for the case of 80° bifurcation angle at the eight time points of the cardiac cycle indicated in Fig. 2, for the three different flow volume divisions: 1/1 (50%–50%), 3/1 (75%–25%), 7/1 (87.5%–12.5%). It is evident that low WSS values during the “long residence” diastolic phase (h-a-b) appear immediately after the bifurcation on the left- and right-outside walls. For the same walls, rapid and dramatic changes are observed during the brief transition from systole to diastole (e-f-g-h), and very low WSS values along the entire length of these walls at the “cusp” point f of transition from the systolic to diastolic phase. The aforementioned drops in WSS on the two outside walls after the bifurcation are accompanied by a significant increase of WSS at the conjugate (opposite) regions on the two inner walls after the bifurcation. This existence of low WSS regions, also observed in the case of curved pipes, is associated with the fact that the flow is generating low-velocity regions in the outer regions of bifurcating vessels or in the outer/inner region of the entry/exit of curved vessels; the low-velocity regions are also characterized by flow recirculation (back-flow) in the case of bifurcating pipes. The results shown in Figs. 10 and 11 contain all three cases of flow volume division, and it is evident that lower WSS values occur at the branch that receives less volume flow rate. This observation (that the WSS values drop considerably when more flow volume is diverted towards the other branch) may prove clinically important in those cases where lesions/stenoses in a branch (or in its respective downstream vessels) reduce the flow volume through it, and cause further reduction in the WSS that may accelerate the process of atheromatosis in this branch, leading to an unstable and catastrophic condition.
Figure 10.
Normalized WSS distributions at eight pivotal time instants during the cardiac cycle (see Fig. 2) along the left-outside and right-outside wall mid-segments of the bifurcating vessel with 80° angle for three different divisions of volume flow rate (50%–50%, 75%–25%, 87.5%–12.5%) (Newtonian flow model).
Figure 12.
Comparison of the normalized WSS distributions at eight pivotal time instants during the cardiac cycle (see Fig. 2) along the left-outside and the right-inside wall mid-segments of bifurcating vessels with 50° and 80° bifurcation angles. The flow rate is divided equally in the two branches (Newtonian flow model).
Figure 11.
Normalized WSS distributions at eight pivotal time instants during the cardiac cycle (see Fig. 2) along the left-inside and right-inside wall mid-segments of the bifurcating vessel with 80° angle for three different divisions of volume flow rate (50%–50%, 75%–25%, 87.5%–12.5%) (Newtonian flow model).
In Fig. 12, we compare the WSS distributions along the left-outside and right-inside wall mid-segments at the eight time instants for the two cases of bifurcation angles (80° and 50°), when the flow volume is equally divided between the two branches. The results indicate that small differences exist for the outer wall, while considerable differences are observed for the inner wall, with the WSS values for the 50° bifurcation being consistently lower in the early portion of the inner wall (up to a distance equal to 1.5 times the vessel diameter). This could be attributed to the fact that, at larger values of the bifurcation angle, larger recirculation zones are created in the outer region, and the flow is forced to accelerate along the region close to the inner wall. The time-averaged WSS distributions along these two wall regions over the cardiac cycle exhibit the same effects (not shown in the interest of space). We should note that the observations regarding the distributions of WSS are also valid in steady-flow conditions, and that the steady-flow values are very close to the time-averages of the instantaneous distributions of pulsatile flow, as in the cases of curved pipes presented earlier.
Finally, we note that the spatial distribution patterns of the computed RMS values of the WSS (quantifying the extent of temporal variations of WSS at each point of the vessel wall) along the four wall regions for the three flow volume divisions are similar to the distribution patterns of the time-averaged WSS values, as was also observed for the curved vessels. We also mention that the WSS distributions corresponding to Newtonian and non-Newtonian flows are very similar, and comparisons are not shown in the interest of space.
Discussion
The motivation of the present computational study has been to elucidate our understanding of the spatio-temporal variation of wall shear stress (WSS) in simulated pulsatile flow through two prototypical geometries of blood vessel segments (curved and bifurcating pipes), and its relation to the process of atherogenesis and possible plaque rupture. This is viewed as one of the first steps in a long effort to identify preferred locations of vulnerable plaques in coronary arteries and high-risk coronary segments for myocardial infarction. The distribution of WSS in coronary arteries has been investigated in various numerical studies either in models of the coronary vessels [30,54–57] or in patient specific coronary vessel geometries [27,46,57–66]. The purpose of the present study has been to examine in more detail the spatio-temporal variations of WSS in prototype geometries, and their relation to fundamental geometric features. Given the complexity of temporal variations, the present results of flow in simpler geometries may serve as reference data for interpreting existing and future results of the more complex flows in real arteries.
The presented results show the regions of low WSS in these two prototypical geometries of vessel segments and the pattern of temporal variations during the cardiac cycle. While regions of low WSS have been previously correlated to atherogenesis, the specific spatial distribution of WSS and its pattern of changes along the vessel walls for various anatomical/functional parameters (the degree of curvature in curved segments, and the angle of bifurcation and the flow volume division in bifurcating segments) have been explored herein in detail.
The catastrophic effect of coronary plaque rupture has been associated with a variety of mechanical and hemodynamic forces acting on coronary plaques. These include: (1) wall shear stress [67,68], (2) circumferential wall stress – the tensile stress induced on the vessel wall by the transmural blood pressure [69,70], (3) surges and drops in intraluminal blood pressure [71,72], (4) mechanical shear stress – the shearing stress exerted between adjacent layers of the vessel wall induced by the circumferential elongation due to circumferential stresses [73,74], (5) arterial wall collapse due to a drop in static pressure within the throat of the stenosis (Bernoulli's principle) [75,76], (6) circumferential bending which causes deformation and bending of plaques [77], (8) longitudinal flexion due to the participation of coronary arteries to cardiac motion [78] and (9) fatigue failure which is an incremental failure progression under influence of repetitive biomechanical stresses [79,80]. The results of the current study provide evidence that supports the association of mechanical and hemodynamic force and plaque rupture. We have presented the detailed temporal pattern of WSS variations during the cardiac cycle at key locations of the vessel segments, and its possible implications for cap thinning and plaque rupture. For instance, it is evident that very low WSS values occur at the start and end of systole, as well as that rapid and dramatic changes of WSS values occur during the transition from the systolic to the diastolic phase. These sharp temporal changes of WSS may raise the risk of plaque rupture during and right after systole, especially when combined with the mechanical stresses induced by significant flexion of curved or bifurcating vessel segments due to the myocardial motion during systolic ventricular contraction. Another factor contributing to the higher risk of plaque rupture during (or near) the systolic phase is the rapid and significant changes in intravascular pressure, as demonstrated in Fig. 8.
The presented results have demonstrated the minimal effects of non-Newtonian flow conditions (relative to Newtonian) on the spatio-temporal WSS distributions, which is due to the no-slip boundary condition at the vessel wall and the resulting high shear rates in the near-wall regions; these non-Newtonian effects can be significant near the center-line of the vessel.
The time-averaged WSS values over the cardiac cycle are shown to be very close to the WSS values under steady-flow conditions – a fact that can be utilized in practice to expedite the computation of WSS spatial distributions in arbitrary vessel geometries (by simulating steady instead of pulsatile flow conditions) when minimal information on flow statistics is looked for.
Another intriguing observation, from the clinical point of view, is the significant and self-reinforcing effect of uneven flow volume division in a bifurcating vessel. Specifically, the presence of a lesion/stenosis in one of the branches (or in its subsidiary downstream vessels) will cause a reduction of volume flow rate through this branch, and an increase in the other branch, that will reduce the WSS in the lesioned branch, and promote further atheromatosis. This self-reinforcing process can lead to an unstable and potentially catastrophic situation of severe stenosis and vascular occlusion.
Acknowledgements
This work was partially supported by a grant from the Niarchos Foundation. Computer resources were provided by the National Technical University of Athens.
References
- 1.Rowan JO. Physics and the circulation. Adam Hilger Ltd; Bristol: 1981. [Google Scholar]
- 2.Milnor W. Hemodynamics. Williams & Wilkins; 1982. [Google Scholar]
- 3.Nichols W, O'Rourke M. McDonald's blood flow in arteries: theoretical, experimental and clinical principles. Hodder Arnold; 2005. [Google Scholar]
- 4.Shaaban AM, Duerinckx AJ. Wall shear stress and early atherosclerosis: a review. AJR Am J Roentgenol. 2000;174:1657–65. doi: 10.2214/ajr.174.6.1741657. [DOI] [PubMed] [Google Scholar]
- 5.Caro CG, Fitz-Gerald JM, Schroter RC. Proposal of a shear dependent mass transfer mechanism for atherogenesis. Clin Sci. 1971;40:5P. doi: 10.1042/cs040005p. [DOI] [PubMed] [Google Scholar]
- 6.Caro CG, Fitz-Gerald JM, Schroter RC. Atheroma and arterial wall shear. Observation, correlation and proposal of a shear dependent mass transfer mechanism for atherogenesis. Proc R Soc Lond B Biol Sci. 1971;177:109–59. doi: 10.1098/rspb.1971.0019. [DOI] [PubMed] [Google Scholar]
- 7.Zarins CK, Giddens DP, Bharadvaj BK, Sottiurai VS, Mabon RF, Glagov S. Carotid bifurcation atherosclerosis. Quantitative correlation of plaque localization with flow velocity profiles and wall shear stress. Circ Res. 1983;53:502–14. doi: 10.1161/01.res.53.4.502. [DOI] [PubMed] [Google Scholar]
- 8.Asakura T, Karino T. Flow patterns and spatial distribution of atherosclerotic lesions in human coronary arteries. Circ Res. 1990;66:1045–66. doi: 10.1161/01.res.66.4.1045. [DOI] [PubMed] [Google Scholar]
- 9.Bharadvaj BK, Mabon RF, Giddens DP. Steady flow in a model of the human carotid bifurcation. Part I – flow visualization. J Biomech. 1982;15:349–62. doi: 10.1016/0021-9290(82)90057-4. [DOI] [PubMed] [Google Scholar]
- 10.Motomiya M, Karino T. Flow patterns in the human carotid artery bifurcation. Stroke. 1984;15:50–6. doi: 10.1161/01.str.15.1.50. [DOI] [PubMed] [Google Scholar]
- 11.Cheng C, Tempel D, van Haperen R, van der Baan A, Grosveld F, Daemen MJ, et al. Atherosclerotic lesion size and vulnerability are determined by patterns of fluid shear stress. Circulation. 2006;113:2744–53. doi: 10.1161/CIRCULATIONAHA.105.590018. [DOI] [PubMed] [Google Scholar]
- 12.Resnick N, Yahav H, Shay-Salit A, Shushy M, Schubert S, Zilberman LC, et al. Fluid shear stress and the vascular endothelium: for better and for worse. Prog Biophys Mol Biol. 2003;81:177–99. doi: 10.1016/s0079-6107(02)00052-4. [DOI] [PubMed] [Google Scholar]
- 13.Davies PF. Flow-mediated endothelial mechanotransduction. Physiol Rev. 1995;75:519–60. doi: 10.1152/physrev.1995.75.3.519. [DOI] [PMC free article] [PubMed] [Google Scholar]
- 14.Malek AM, Alper SL, Izumo S. Hemodynamic shear stress and its role in atherosclerosis. JAMA. 1999;282:2035–42. doi: 10.1001/jama.282.21.2035. [DOI] [PubMed] [Google Scholar]
- 15.Benson TJ, Nerem RM, Pedley TJ. Assessment of wall shear stress in arteries, applied to the coronary circulation. Cardiovasc Res. 1980;14:568–76. doi: 10.1093/cvr/14.10.568. [DOI] [PubMed] [Google Scholar]
- 16.Gnasso A, Irace C, Carallo C, De Franceschi MS, Motti C, Mattioli PL, et al. In vivo association between low wall shear stress and plaque in subjects with asymmetrical carotid atherosclerosis. Stroke. 1997;28:993–8. doi: 10.1161/01.str.28.5.993. [DOI] [PubMed] [Google Scholar]
- 17.Friedman MH, Brinkman AM, Qin JJ, Seed WA. Relation between coronary artery geometry and the distribution of early sudanophilic lesions. Atherosclerosis. 1993;98:193–9. doi: 10.1016/0021-9150(93)90128-h. [DOI] [PubMed] [Google Scholar]
- 18.Pedersen EM, Oyre S, Agerbaek M, Kristensen IB, Ringgaard S, Boesiger P, et al. Distribution of early atherosclerotic lesions in the human abdominal aorta correlates with wall shear stresses measured in vivo. Eur J Vasc Endovasc Surg. 1999;18:328–33. doi: 10.1053/ejvs.1999.0913. [DOI] [PubMed] [Google Scholar]
- 19.Wentzel JJ, Corti R, Fayad ZA, Wisdom P, Macaluso F, Winkelman MO, et al. Does shear stress modulate both plaque progression and regression in the thoracic aorta? Human study using serial magnetic resonance imaging. J Am Coll Cardiol. 2005;45:846–54. doi: 10.1016/j.jacc.2004.12.026. [DOI] [PubMed] [Google Scholar]
- 20.Kamiya A, Bukhari R, Togawa T. Adaptive regulation of wall shear stress optimizing vascular tree function. Bull Math Biol. 1984;46:127–37. doi: 10.1007/BF02463726. [DOI] [PubMed] [Google Scholar]
- 21.Jou LD, van Tyen R, Berger SA, Saloner D. Calculation of the magnetization distribution for fluid flow in curved vessels. Magn Reson Med. 1996;35:577–84. doi: 10.1002/mrm.1910350418. [DOI] [PubMed] [Google Scholar]
- 22.Kamiya A, Togawa T. Adaptive regulation of wall shear stress to flow change in the canine carotid artery. Am J Physiol. 1980;239:H14–21. doi: 10.1152/ajpheart.1980.239.1.H14. [DOI] [PubMed] [Google Scholar]
- 23.Langille BL, O'Donnell F. Reductions in arterial diameter produced by chronic decreases in blood flow are endothelium-dependent. Science. 1986;231:405–7. doi: 10.1126/science.3941904. [DOI] [PubMed] [Google Scholar]
- 24.Kraiss LW, Kirkman TR, Kohler TR, Zierler B, Clowes AW. Shear stress regulates smooth muscle proliferation and neointimal thickening in porous polytetrafluoroethylene grafts. Arterioscler Thromb. 1991;11:1844–52. doi: 10.1161/01.atv.11.6.1844. [DOI] [PubMed] [Google Scholar]
- 25.Girerd X, London G, Boutouyrie P, Mourad JJ, Safar M, Laurent S. Remodeling of the radial artery in response to a chronic increase in shear stress. Hypertension. 1996;27:799–803. doi: 10.1161/01.hyp.27.3.799. [DOI] [PubMed] [Google Scholar]
- 26.Irace C, Gnasso A, Cirillo F, Leonardo G, Ciamei M, Crivaro A, et al. Arterial remodeling of the common carotid artery after aortic valve replacement in patients with aortic stenosis. Stroke. 2002;33:2446–50. doi: 10.1161/01.str.0000032103.59213.bc. [DOI] [PubMed] [Google Scholar]
- 27.Stone PH, Coskun AU, Kinlay S, Clark ME, Sonka M, Wahle A, et al. Effect of endothelial shear stress on the progression of coronary artery disease, vascular remodeling, and in-stent restenosis in humans: in vivo 6-month follow-up study. Circulation. 2003;108:438–44. doi: 10.1161/01.CIR.0000080882.35274.AD. [DOI] [PubMed] [Google Scholar]
- 28.Melkumyants AM, Balashov SA, Khayutin VM. Endothelium dependent control of arterial diameter by blood viscosity. Cardiovasc Res. 1989;23:741–7. doi: 10.1093/cvr/23.9.741. [DOI] [PubMed] [Google Scholar]
- 29.Feldman CL, Stone PH. Intravascular hemodynamic factors responsible for progression of coronary atherosclerosis and development of vulnerable plaque. Curr Opin Cardiol. 2000;15:430–40. doi: 10.1097/00001573-200011000-00010. [DOI] [PubMed] [Google Scholar]
- 30.Nosovitsky VA, Ilegbusi OJ, Jiang J, Stone PH, Feldman CL. Effects of curvature and stenosis-like narrowing on wall shear stress in a coronary artery model with phasic flow. Comput Biomed Res. 1997;30:61–82. doi: 10.1006/cbmr.1997.1434. [DOI] [PubMed] [Google Scholar]
- 31.Ignarro LJ, Napoli C. Novel features of nitric oxide, endothelial nitric oxide synthase, and atherosclerosis. Curr Atheroscler Rep. 2004;6:281–7. doi: 10.1007/s11883-004-0059-9. [DOI] [PubMed] [Google Scholar]
- 32.Voetsch B, Jin RC, Loscalzo J. Nitric oxide insufficiency and atherothrombosis. Histochem Cell Biol. 2004;122:353–67. doi: 10.1007/s00418-004-0675-z. [DOI] [PubMed] [Google Scholar]
- 33.Ravensbergen J, Ravensbergen JW, Krijger JK, Hillen B, Hoogstraten HW. Localizing role of hemodynamics in atherosclerosis in several human vertebrobasilar junction geometries. Arterioscler Thromb Vasc Biol. 1998;18:708–16. doi: 10.1161/01.atv.18.5.708. [DOI] [PubMed] [Google Scholar]
- 34.Nerem RM. Vascular fluid mechanics, the arterial wall, and atherosclerosis. J Biomech Eng. 1992;114:274–82. doi: 10.1115/1.2891384. [DOI] [PubMed] [Google Scholar]
- 35.Cunningham KS, Gotlieb AI. The role of shear stress in the pathogenesis of atherosclerosis. Lab Invest. 2005;85:9–23. doi: 10.1038/labinvest.3700215. [DOI] [PubMed] [Google Scholar]
- 36.Gimbrone MA, Jr, Topper JN, Nagel T, Anderson KR, Garcia-Cardena G. Endothelial dysfunction, hemodynamic forces, and atherogenesis. Ann N Y Acad Sci. 2000;902:230–9. doi: 10.1111/j.1749-6632.2000.tb06318.x. discussion 239–40. [DOI] [PubMed] [Google Scholar]
- 37.Wang N, Miao H, Li YS, Zhang P, Haga JH, Hu Y, et al. Shear stress regulation of Kruppel-like factor 2 expression is flow pattern-specific. Biochem Biophys Res Commun. 2006;341:1244–51. doi: 10.1016/j.bbrc.2006.01.089. [DOI] [PubMed] [Google Scholar]
- 38.Kroll MH, Hellums JD, McIntire LV, Schafer AI, Moake JL. Platelets and shear stress. Blood. 1996;88:1525–41. [PubMed] [Google Scholar]
- 39.Schulz-Heik K, Ramachandran J, Bluestein D, Jesty J. The extent of platelet activation under shear depends on platelet count: differential expression of anionic phospholipid and factor Va. Pathophysiol Haemost Thromb. 2005;34:255–62. doi: 10.1159/000093104. [DOI] [PubMed] [Google Scholar]
- 40.McCrary JK, Nolasco LH, Hellums JD, Kroll MH, Turner NA, Moake JL. Direct demonstration of radiolabeled von Willebrand factor binding to platelet glycoprotein Ib and IIb–IIIa in the presence of shear stress. Ann Biomed Eng. 1995;23:787–93. doi: 10.1007/BF02584477. [DOI] [PubMed] [Google Scholar]
- 41.Goto S, Salomon DR, Ikeda Y, Ruggeri ZM. Characterization of the unique mechanism mediating the shear-dependent binding of soluble von Willebrand factor to platelets. J Biol Chem. 1995;270:23352–61. doi: 10.1074/jbc.270.40.23352. [DOI] [PubMed] [Google Scholar]
- 42.Hellums JD. 1993 Whitaker lecture: biorheology in thrombosis research. Ann Biomed Eng. 1994;22:445–55. doi: 10.1007/BF02367081. [DOI] [PubMed] [Google Scholar]
- 43.Moake JL, Turner NA, Stathopoulos NA, Nolasco LH, Hellums JD. Involvement of large plasma von Willebrand factor (vWF) multimers and unusually large vWF forms derived from endothelial cells in shear stress-induced platelet aggregation. J Clin Invest. 1986;78:1456–61. doi: 10.1172/JCI112736. [DOI] [PMC free article] [PubMed] [Google Scholar]
- 44.Maxwell MJ, Dopheide SM, Turner SJ, Jackson SP. Shear induces a unique series of morphological changes in trans-locating platelets: effects of morphology on translocation dynamics. Arterioscler Thromb Vasc Biol. 2006;26:663–9. doi: 10.1161/01.ATV.0000201931.16535.e1. [DOI] [PubMed] [Google Scholar]
- 45.Ballyk PD, Steinman DA, Ethier CR. Simulation of non-Newtonian blood flow in an end-to-side anastomosis. Biorheology. 1994;31:565–86. doi: 10.3233/bir-1994-31505. [DOI] [PubMed] [Google Scholar]
- 46.Johnston BM, Johnston PR, Corney S, Kilpatrick D. Non-Newtonian blood flow in human right coronary arteries: steady state simulations. J Biomech. 2004;37:709–20. doi: 10.1016/j.jbiomech.2003.09.016. [DOI] [PubMed] [Google Scholar]
- 47.CD Adapco Group Star-CD version 3.24 methodology. 2004 [Google Scholar]
- 48.CD Adapco Group Star-CD version 3.24 user guide. 2004 [Google Scholar]
- 49.Berne RM, Levy MN. Cardiovascular physiology. Mosby Inc; St. Louis, USA: 2001. [Google Scholar]
- 50.Berger SA, Talbot L, Yao LS. Flow in curved pipes. Annu Rev Fluid Mech. 2004;15:461–512. [Google Scholar]
- 51.Ku DN, Giddens DP, Zarins CK, Glagov S. Pulsatile flow and atherosclerosis in the human carotid bifurcation. Positive correlation between plaque location and low oscillating shear stress. Arteriosclerosis. 1985;5:293–302. doi: 10.1161/01.atv.5.3.293. [DOI] [PubMed] [Google Scholar]
- 52.He X, Ku DN. Pulsatile flow in the human left coronary artery bifurcation: average conditions. J Biomech Eng. 1996;118:74–82. doi: 10.1115/1.2795948. [DOI] [PubMed] [Google Scholar]
- 53.Buchanan JR, Kleinstreuer C, Hyun S, Truskey GA. Hemodynamics simulation and identification of susceptible sites of atherosclerotic lesion formation in a model abdominal aorta. J Biomech. 2003;36:1185–96. doi: 10.1016/s0021-9290(03)00088-5. [DOI] [PubMed] [Google Scholar]
- 54.Chen SJ, Hoffmann KR, Carroll JD. Three-dimensional reconstruction of coronary arterial tree based on biplane angio-grams. Proc SPIE Med Imag. 1996;2710:103–14. [Google Scholar]
- 55.Santamarina A, Weydahl E, Siegel JM, Jr, Moore JE., Jr Computational analysis of flow in a curved tube model of the coronary arteries: effects of time-varying curvature. Ann Biomed Eng. 1998;26:944–54. doi: 10.1114/1.113. [DOI] [PubMed] [Google Scholar]
- 56.Jung J, Hassanein A, Lyczkowski RW. Hemodynamic computation using multiphase flow dynamics in a right coronary artery. Ann Biomed Eng. 2006;34:393–407. doi: 10.1007/s10439-005-9017-0. [DOI] [PubMed] [Google Scholar]
- 57.Soulis JV, Farmakis TM, Giannoglou GD, Louridas GE. Wall shear stress in normal left coronary artery tree. J Biomech. 2006;39:742–9. doi: 10.1016/j.jbiomech.2004.12.026. [DOI] [PubMed] [Google Scholar]
- 58.Krams R, Wentzel JJ, Oomen JA, Vinke R, Schuurbiers JC, de Feyter PJ, et al. Evaluation of endothelial shear stress and 3D geometry as factors determining the development of atherosclerosis and remodeling in human coronary arteries in vivo. Combining 3D reconstruction from angiography and IVUS (ANGUS) with computational fluid dynamics. Arterioscler Thromb Vasc Biol. 1997;17:2061–5. doi: 10.1161/01.atv.17.10.2061. [DOI] [PubMed] [Google Scholar]
- 59.Lee BK, Kwon HM, Kim D, Yoon YW, Seo JK, Kim IJ, et al. Computed numerical analysis of the biomechanical effects on coronary atherogenesis using human hemodynamic and dimensional variables. Yonsei Med J. 1998;39:166–74. doi: 10.3349/ymj.1998.39.2.166. [DOI] [PubMed] [Google Scholar]
- 60.Feldman CL, Ilegbusi OJ, Hu Z, Nesto R, Waxman S, Stone PH. Determination of in vivo velocity and endothelial shear stress patterns with phasic flow in human coronary arteries: a methodology to predict progression of coronary atherosclerosis. Am Heart J. 2002;143:931–9. doi: 10.1067/mhj.2002.123118. [DOI] [PubMed] [Google Scholar]
- 61.Berthier B, Bouzerar R, Legallais C. Blood flow patterns in an anatomically realistic coronary vessel: influence of three different reconstruction methods. J Biomech. 2002;35:1347–56. doi: 10.1016/s0021-9290(02)00179-3. [DOI] [PubMed] [Google Scholar]
- 62.Wentzel JJ, Gijsen FJ, Stergiopulos N, Serruys PW, Slager CJ, Krams R. Shear stress, vascular remodeling and neointimal formation. J Biomech. 2003;36:681–8. doi: 10.1016/s0021-9290(02)00446-3. [DOI] [PubMed] [Google Scholar]
- 63.Zeng D, Ding Z, Friedman MH, Ethier CR. Effects of cardiac motion on right coronary artery hemodynamics. Ann Biomed Eng. 2003;31:420–9. doi: 10.1114/1.1560631. [DOI] [PubMed] [Google Scholar]
- 64.Ramaswamy SD, Vigmostad SC, Wahle A, Lai YG, Olszewski ME, Braddy KC, et al. Fluid dynamic analysis in a human left anterior descending coronary artery with arterial motion. Ann Biomed Eng. 2004;32:1628–41. doi: 10.1007/s10439-004-7816-3. [DOI] [PubMed] [Google Scholar]
- 65.Johnston BM, Johnston PR, Corney S, Kilpatrick D. Non-Newtonian blood flow in human right coronary arteries: transient simulations. J Biomech. 2006;39:1116–28. doi: 10.1016/j.jbiomech.2005.01.034. [DOI] [PubMed] [Google Scholar]
- 66.Soulis JV, Giannoglou GD, Chatzizisis YS, Seralidou KV, Parcharidis GE, Louridas GE. Non-Newtonian models for molecular viscosity and wall shear stress in a 3D reconstructed human left coronary artery. Med Eng Phys. 2007;30:9–19. doi: 10.1016/j.medengphy.2007.02.001. [DOI] [PubMed] [Google Scholar]
- 67.Gertz SD, Roberts WC. Hemodynamic shear force in rupture of coronary arterial atherosclerotic plaques. Am J Cardiol. 1990;66:1368–72. doi: 10.1016/0002-9149(90)91170-b. [DOI] [PubMed] [Google Scholar]
- 68.Fry DL. Acute vascular endothelial changes associated with increased blood velocity gradients. Circ Res. 1968;22:165–97. doi: 10.1161/01.res.22.2.165. [DOI] [PubMed] [Google Scholar]
- 69.Cheng GC, Loree HM, Kamm RD, Fishbein MC, Lee RT. Distribution of circumferential stress in ruptured and stable atherosclerotic lesions. A structural analysis with histopatho-logical correlation. Circulation. 1993;87:1179–87. doi: 10.1161/01.cir.87.4.1179. [DOI] [PubMed] [Google Scholar]
- 70.Richardson PD. Biomechanics of plaque rupture: progress, problems, and new frontiers. Ann Biomed Eng. 2002;30:524–36. doi: 10.1114/1.1482781. [DOI] [PubMed] [Google Scholar]
- 71.Constantinides P. Plaque fissures in human coronary thrombosis. J Atheroscler Res. 1966:1–17. [Google Scholar]
- 72.Doriot PA. Estimation of the supplementary axial wall stress generated at peak flow by an arterial stenosis. Phys Med Biol. 2003;48:127–38. doi: 10.1088/0031-9155/48/1/309. [DOI] [PubMed] [Google Scholar]
- 73.Berliner JA, Navab M, Fogelman AM, Frank JS, Demer LL, Edwards PA, et al. Atherosclerosis: basic mechanisms. Oxidation, inflammation, and genetics. Circulation. 1995;91:2488–96. doi: 10.1161/01.cir.91.9.2488. [DOI] [PubMed] [Google Scholar]
- 74.Lee RT, Kamm RD. Vascular mechanics for the cardiologist. J Am Coll Cardiol. 1994;23:1289–95. doi: 10.1016/0735-1097(94)90369-7. [DOI] [PubMed] [Google Scholar]
- 75.Aoki T, Ku DN. Collapse of diseased arteries with eccentric cross section. J Biomech. 1993;26:133–42. doi: 10.1016/0021-9290(93)90044-f. [DOI] [PubMed] [Google Scholar]
- 76.Binns RL, Ku DN. Effect of stenosis on wall motion. A possible mechanism of stroke and transient ischemic attack. Arteriosclerosis. 1989;9:842–7. doi: 10.1161/01.atv.9.6.842. [DOI] [PubMed] [Google Scholar]
- 77.Alfonso F, Macaya C, Goicolea J, Hernandez R, Segovia J, Zamorano J, et al. Determinants of coronary compliance in patients with coronary artery disease: an intravascular ultrasound study. J Am Coll Cardiol. 1994;23:879–84. doi: 10.1016/0735-1097(94)90632-7. [DOI] [PubMed] [Google Scholar]
- 78.Stein PD, Hamid MS, Shivkumar K, Davis TP, Khaja F, Henry JW. Effects of cyclic flexion of coronary arteries on progression of atherosclerosis. Am J Cardiol. 1994;73:431–7. doi: 10.1016/0002-9149(94)90671-8. [DOI] [PubMed] [Google Scholar]
- 79.Versluis A, Bank AJ, Douglas WH. Fatigue and plaque rupture in myocardial infarction. J Biomech. 2006;39:339–47. doi: 10.1016/j.jbiomech.2004.10.041. [DOI] [PubMed] [Google Scholar]
- 80.Bank AJ, Versluis A, Dodge SM, Douglas WH. Atherosclerotic plaque rupture: a fatigue process? Med Hypotheses. 2000;55:480–4. doi: 10.1054/mehy.2000.1096. [DOI] [PubMed] [Google Scholar]


