

Abstract
The study of bioadhesion is significant to applications in a variety of scientific fields. Techniques that are surface sensitive need to be utilized to examine these kinds of systems because bioadhesion occurs at the interface between two surfaces. Recently, Sum Frequency Generation (SFG) has been applied to investigate different bioadhesive processes because of its intrinsic surface specificity, excellent sensitivity and its ability to perform experiments in situ. SFG studies on the bioadhesion of fibrinogen, factor XII and mefp-3 on various surfaces will be discussed in this review.
Keywords: Bioadhesion, Sum Frequency Generation Vibrational Spectroscopy, Interfacial Proteins, Interfaces, Fibrinogen, Factor XII, Mussel Adhesive Protein
1. Introduction
The molecular structures of interfaces determine adhesion, including bioadhesion. Bioadhesion refers to the interfacial attachment between two biological surfaces or between a biological and a synthetic surface. Biological substrates can range from biological molecules, such as proteins, peptides and lipids, to cells and even tissues like bone. Synthetic materials are also diverse; some examples include biosensors, biomedical implants and drug delivery systems. Bioadhesion is a broad area that is pertinent to many applications in the pharmaceutical, industrial, medical, biological and various other related fields.[1–5] For example, in the medical field, controlling bioadhesion is crucial for the design of biocompatible clinical implants. Protein adsorption (governed by bioadhesion) is the first and pivotal event that occurs when synthetic implant materials come in contact with human tissue or blood, and this determines whether or not the material will be accepted or rejected by the body. Bioadhesion is also a key mechanism involved in marine biofouling, where oceanic organisms generate adhesive proteins that allow them to attach to ship hulls. Better knowledge of the interfacial structures can help us control (either by enhancing, avoiding or altering) the bioadhesive processes in their respective contexts.
Theories that were previously used to describe the adhesive behavior of glues and paints have been adapted and applied to bioadhesion. These theories relate adhesion to chemical bonding, intermolecular forces (i.e. hydrogen bonding and van der Waals forces), electrostatic attraction, wetting processes involving interfacial tensions that cause spreading and adhesion, and the intercalation as well as entanglement of the chains from each surface. Finally, a common and practical way of studying adhesion is by applying the fracture theory, which analyzes the amount of force required to detach one surface from another.[6] These theories have lead to excellent interpretations of bioadhesion in many cases. The underlying mechanisms of such interactions, however, are controlled by the molecular structures of the interfaces. Obtaining structural information about the interfaces would thus help in deducing and understanding the mechanism of bioadhesion at the molecular level.
For bioadhesion taking place between protein molecules and various synthetic surfaces, it is crucial to characterize interfacial structures, such as the orientation and conformation of proteins, in order to understand the adhesive mechanism. Deducing the detailed orientation and conformation of proteins at interfaces is, however, still a challenging task with the existing techniques. Optical spectroscopic techniques, for example, have been applied to study interfacial protein structures. The structures of macromolecules at interfaces (i.e. proteins or polymer chains) can be studied using linear spectroscopic techniques, such as Fourier-transform infrared spectroscopy with attenuated total reflectance (FTIR-ATR), Raman scattering, and circular dichroism (CD).[7–15] These techniques provide a wealth of information regarding interfacial structures of polymers and proteins, but they also have their own limitations: they are not intrinsically surface sensitive and only provide a restricted amount of information regarding orientation and other structural parameters.
Sum Frequency Generation (SFG) vibrational spectroscopy, which has been around since the 1980’s, has recently been applied to study interfacial protein structures.[16–34] This nonlinear vibrational spectroscopic technique provides important structural information that is complimentary to that obtained by the above-mentioned linear optical spectroscopic methods, regarding the structure of macromolecules at interfaces. Even though SFG is still in its infant stage in the field of peptide/protein study, it has proven to be a very powerful technique with which surface-sensitive measurements can be obtained. It has many advantages such as its excellent sensitivity (very low peptide/protein concentration is needed) and its ability to perform experiments in situ.
This article is written to give an overall introduction to SFG and its use in the study of the bioadhesive interactions between various surfaces and proteins. We will summarize SFG studies on fibrinogen, factor XII (FXII), and Mussel Adhesive protein (mefp-3) on different polymer surfaces.
2. Sum Frequency Generation (SFG)
2.1 SFG: Key Properties and Advantages
The theory behind SFG and a description of the experimental setups have been published extensively[35–46] and will not be reiterated here. In this review article, we only hope to emphasize some important properties of this technique to explain why SFG is an appropriate method for this particular kind of study on interfacial protein structures.
A typical SFG system consists of two input laser beams (a fixed visible beam and a tunable infrared beam) overlapping together spatially and temporally. When a molecular vibrational mode is in resonance with the IR beam energy, SFG is strongly enhanced and a peak for that particular vibration will appear in the spectrum.
The property that truly makes SFG a powerful technique to study surface chemistry comes from its selection rules, which dictates that SFG signals can only be detected from media with no inversion symmetry. The presence of an interface apart from the bulk will create an asymmetric plane that gives rise to SFG activity of interfacial molecules.[47] The contribution of the centro-symmetric media (i.e. the bulk) to the obtainable signal is usually negligible under the electric dipole approximation. Compared to other linear vibrational spectroscopic techniques, SFG is therefore an intrinsically surface-sensitive technique.
In addition to this unique and important property, SFG also has practical advantages. SFG can be used to study any surface or interface that can be accessed by laser light, and therefore in situ experiments can be performed using geometries that have been developed over the years (Figure 1).[34, 48] SFG also has very low detection limits, which allow for the investigation of systems with biologically-relevant concentrations of proteins. With the combination of both of these advantages, SFG can be used to study the structure of interfacial proteins at a solid/protein solution interface with the bulk concentration of the protein solution in the nanomolar range.
Figure 1.

The SFG “near” total reflection experimental geometry. Reproduced with permission from ref. 34. © 2003, American Chemical Society.
SFG is a second order non-linear spectroscopic method which may measure more structural parameters than linear vibrational spectroscopic techniques like FTIR or Raman. SFG experiments probe the second order nonlinear susceptibility tensor. This third rank tensor consists of a maximum of 27 non-zero elements that may be able to be measured independently. The non-zero elements, which are associated with molecular vibrational modes, may be measured using various corresponding polarization combinations of the IR, visible and SFG signal beams in the experiment. With this many number of possible SFG measurements, more structural information about interfacial proteins can be obtained. Furthermore, SFG measurements can be combined with the structural information acquired from linear spectroscopic studies to provide an even more complete picture of interfacial protein structure, such as the orientation, the orientation distribution, and the conformation of proteins at interfaces.[49, 50] Usually SFG signals are generated from an infinitely sharp interface. For an adsorbed protein layer, which is much thicker than an infinitely sharp interface, we have demonstrated using a thin film model that SFG signals can be treated as generated from the entire protein molecule (or the entire adsorbed protein layer) to deduce interfacial protein structure.
2.2 SFG: Structural and Orientational Analyses
Because side chains of proteins consist of methyl, phenyl and methylene groups, SFG signals in C-H stretching regime can be used to probe structures of protein hydrophobic side chains at interfaces. Interfacial protein backbone structure, on the other hand, can primarily be obtained from the amide I band as done with FTIR-ATR. A complication with FTIR-ATR studies on amide I bands arises from their overlap with the water bending mode at ~1645 cm−1.[51] This makes the data fitting and processing of FTIR-ATR amide I signal cumbersome. In SFG experiments, however, the water bending mode is found to make no detectable contribution to the amide I region of the spectrum.[34, 52] In addition, a near total reflection experimental geometry has been adopted for SFG studies; this enables us to obtain very strong SFG amide I signals of interfacial proteins. The lack of water bending mode contributions and the ability to obtain a strong amide I signal makes the data analysis more accurate.
SFG amide I signals can be affected by the surface coverage, orientation, and secondary structures of the adsorbed proteins.[34] The amide I mode contains predominately the peptide backbone C=O stretching modes. These C=O groups are held in an ordered arrangement by hydrogen bonds and the C=O stretch is sensitive to the secondary structure environment.
Whereas the surface coverage and orientation of proteins only have effects on the intensity of the SFG amide I signals, the secondary structures, on the other hand, determine the SFG signal peak centers. Our group has successfully performed experiments that demonstrated that SFG amide I signals can be reliably de-convoluted to distinguish α-helical and β-sheet structures of interfacial peptides and proteins. Through experiments done with antimicrobial peptides that are known to adopt α-helical structures in lipid bilayers, we can conclude that α-helical structures have SFG peak centers at around 1650 cm−1, as with FTIR or Raman studies.[34, 53] Using model β-sheet peptide tachyplesin I, we also showed that β-sheet structures have characteristic peaks at 1633 cm−1 and 1690 cm−1, corresponding to the B2 mode and B1/B3 modes, respectively.[25] Recent results in our laboratory on alamethicin (unpublished) show signatures of 310 helical structures with peak centers around 1630 cm−1 and 1660 cm-1.
After showing that SFG amide I signals generated from different secondary structures have different peak centers, our group developed methodologies to study the interfacial orientations of α-helical structures and applied such methods to study the orientation of α-helical melittin and G-proteins, which contain α-helical domains, in lipid bilayers.[49, 54] We are also working out similar methods to study the orientations of β-sheets and 310 helices at interfaces.
Protein structures can be quite complex, e.g., more complicated than a simple α-helix. It is therefore not always straightforward to deduce interfacial proteins’ structures, even with the SFG methods discussed above. We have shown that studies using a combination of various vibrational spectroscopic techniques can provide more detailed structural information about interfacial proteins than SFG alone. For example, even though SFG has some advantages over FTIR-ATR, it cannot completely replace the technique. These two methods provide complimentary information on the determination of protein orientation, e.g., the tilt angle θ of an α-helix (defined by the angle between the helical axis and the surface normal). SFG measures <cos3θ> and <cosθ>, while <cos2θ> can be deduced from FTIR-ATR studies. Solving these average cosines of various secondary structures can lead to the determination of interfacial proteins’ orientations. In the case in which the same interfacial species (e.g., a type of chemical functional group or secondary structure) orient in the same direction at the interface (delta distribution), measuring such an orientation is relatively trivial – only one parameter, the orientation angle, needs to be determined by measuring one of the average cosines using SFG or FTIR-ATR. This is, however, an ideal case and is not what is generally encountered in most situations. Interfacial species of the same type may not have the same orientation, and can instead have an orientation distribution, [55] or several distinctly different orientations (characterized by several delta functions). This will cause each order of the average cosines (i.e. <cos3θ> or <cosθ>) to become an individual parameter that needs to be determined. By performing more independent measurements, more parameters can be acquired to solve the complicated orientations of interfacial proteins. For complex situations, such as a protein with multiple α-helices that each adopts a unique orientation, different measurements can be combined to obtain the needed number of independent parameters. These measured parameters can include: the dichroic ratio of FTIR-ATR, the appropriate SFG intensity ratio measurement using different polarization combinations, and the absolute intensity of SFG signals.[41, 55, 56]
As mentioned above, a specific secondary structure may have an orientation distribution or adopt multiple delta distributions. In these types of situations, a trial distribution built on the theory of maximum entropy has been developed that can also be used to determine the orientation and orientation distribution of each secondary structure. In this method, a series of functions GN(x) needs to be established that satisfies both of these two conditions: it minimizes the entropy, S, of the system and converges to a real distribution as the number of the distribution moments, N, approaches infinity.[60–62]
| (1) |
| (2) |
To determine the complete orientation picture of interfacial proteins, we adopt the same methodology and solve for the average cosines using Equation 3, where λi is calculated from the experimental results of the average cosines.
| (3) |
Due to the limited number of independent measurements, the series needs to be truncated. For example, if we have measurements obtained from FTIR-ATR and SFG studies, the function only contains the first four terms of the series. The correlation between the number of remaining terms in the truncated expression of GN(θ) and the ability of GN(θ) to create a distribution that resembles the actual function is shown in Figure 2.
Figure 2.

Assumed distribution (top curve) and distributions deduced by using the maximum entropy function with various numbers of independent measurements: (a) at least two measurements are needed to closely resemble the assumed Gaussian distribution; (b) at least four measurements are needed to closely resemble the assumed distribution of the two-Gaussian function; and (c) at least nine measurements are needed to closely resemble the assumed distribution of a four-δ function. Reproduced with permission from ref. 55. © 2007, American Chemical Society.
We have successfully used this maximum entropy trial function to determine the orientation of melittin in a bilayer. The orientation distribution deduced using this method was in good agreement with the solution we obtained by assuming that melittin adopted two delta distributions of orientation angles. More recently, the maximum entropy results were shown to match the results attained by assuming a Gaussian distribution for fibrinogen adsorbed on a polystyrene surface.[49, 50]
Combining different vibrational spectroscopic methods to deduce orientation distributions of secondary structures is very advantageous when compared to only relying on one technique. Currently our group only uses a combination of SFG and FTIR-ATR studies, but with the advance of current laser technology, many higher order nonlinear spectroscopic techniques may be exploited in the near future. These techniques have been successfully used to measure higher order nonlinear susceptibilities: coherent anti-Stoke Raman scattering (CARS) and four wave mixing (FWM) measure χ(3), and recently χ(4) has been measured by fourth-order Raman experiments.[57–59, 63, 64] Combining these measurements with SFG and FTIR-ATR studies will result in the ability to obtain much clearer pictures of the interfacial systems.
SFG is a versatile technique that has been applied to study many surfaces and interfaces. In this article, we will only discuss examples in which SFG was used to study the bioadhesive interface between proteins and synthetic surfaces.
3. Applications of SFG to the Study of Bioadhesion
3.1 Fibrinogen
When a synthetic surface is placed in contact with blood, the first event that occurs is nonspecific adsorption of plasma proteins. It has been found that fibrinogen absorbs to synthetic surfaces in higher quantities than other proteins.[65–67] The conformation that fibrinogen adopts when bound to these polymer surfaces is thought to be intimately linked to the cascade of reactions that eventually leads to thrombosis. Many studies have shown that the conformation and orientation of adsorbed fibrinogen affects platelet adhesion and aggregation.[68–72] The adsorption of fibrinogen has also been known to turn inert biomaterials into thrombogenic ones.[73, 74] Because of the increased use of blood-contacting devices in the medical field, there is a great need to understand the manner in which fibrinogen interacts with biomaterials.
Fibrinogen is the third most prevalent plasma protein, after serum albumin and immunoglobulins.[75] Its structure is typically discussed in terms of three different domains. Its central unit is a globular hydrophobic E domain that is connected to two identical hydrophobic D domains. The E domain is linked to the D domains by three α-helical coiled coils on each side (Aα, Bβ and γ chains). The termini of the Aα chains form αC globular domains, which are believed to interact with the E domain.[76] See Figure 3 for a schematic diagram of the structure of fibrinogen.
Figure 3.
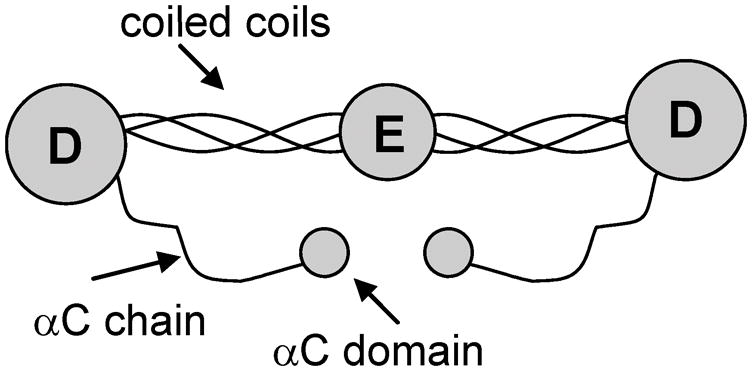
Structure of fibrinogen. Reproduced with permission from ref. 116. © 2005, American Chemical Society.
Fibrinogen and its interaction with various synthetic surfaces have been studied using an array of analytical and biological techniques for over 30 years. Atomic Force Microscopy (AFM) has been one of the techniques in the forefront in this field. With AFM, different model surfaces have been examined: mica, [77–84] graphite, [77, 78, 82, 84] silicon, [85–87] silicon dioxide, [18, 88] titanium oxide, [89] titanium, [90] stainless steel, [75, 91] carbon thin films, [92] surface-assembled monolayers, [84, 93–95] and different types of polymers.[80, 96–99] Other techniques used over the years have included: scanning probe microscopy, [95, 100] radioisotope labeling, [101–103] X-ray photoelectron spectroscopy, [90] ellipsometry, [92, 104] polarization-modulation infrared reflection-absorption spectroscopy, [75] immunogold staining for imaging, [105] field emission scanning electron microscopy, [106] ELISA,[107] etc. Even mass spectrometry has recently become involved in studying fibrinogen conformations at interfaces.[108] In addition, molecular dynamics simulations and other computer models have also been generated to predict how fibrinogen adsorbs onto different surfaces.[109, 110]
A myriad of publications have looked at different aspects of fibrinogen binding. Earlier studies focused on determining the kinetics of fibrinogen adsorption on hydrophobic versus hydrophilic substrates.[101, 111] More recent studies have looked at the correlation between the amount of fibrinogen adsorbed and the level of platelet adhesion, and have found that increased amounts of fibrinogen adsorbed did not always cause more platelet binding. These results and others have shown that conformational changes on different substrates could either expose or bury the platelet-binding epitopes of fibrinogen.[103, 112, 113] One of the studies published this year showed that fibrinogen underwent significant changes in secondary structure when adsorbing onto stainless steel in terms of its β-sheet and β-turns but not its α-helical structure.[75] Cremer’s group utilized AFM and fluorescence findings to discuss the orientation of the αC domains with a change in pH (SFG results from this article will be discussed below). At pH 7.4, the E and D domains of fibrinogen contain the highest concentration of negatively charged residues, while αC domains are positively charged. Because of this, the αC domains are strongly bound to the E domain. At pH 3.5, however, the two domains become reversibly detached.[4, 114] They proposed a mechanism in which the αC domains first, through electrostatic attraction, interacted with the silica surface at pH 8.0 (while bound to the E domain). When lowering the pH to 3.2, the αC domains became detached from the E domain, allowing other parts of the protein to interact with the silica interface, and when the pH was raised back up to 8.0, the αC domains then became attached once again to the E domain via the top (Figure 4).[18] The variety of techniques used to study these interactions has provided a wealth of information regarding fibrinogen absorption onto synthetic surfaces.
Figure 4.
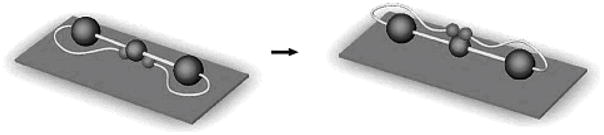
Proposed mechanism for interfacial human fibrinogen rearrangement upon pH cycling. Reproduced with permission from ref. 18. © 2003, American Chemical Society.
SFG has recently been added to the conglomeration of techniques used to study the interaction of fibrinogen with different polymer surfaces. The first SFG study was published by Chen et al. in 2002.[26] The authors looked at surfaces of polyurethanes with different end-group modifications such as silicone (BioSpan-S or BS), poly(ethylene glycol) (BioSpan-P or BP) and sulfonate group (BioSpan-SO or BSO). By looking at the C-H stretching region, they were able to see differences in the way that fibrinogen adsorbed to these surfaces. By noting the disappearance of the CH2 stretch when the fibrinogen solution was contacted with BS, which has PDMS end-groups that show thromboresistance, the authors deduced that fibrinogen only interacted with the backbone part of the BS surface and not the hydrophobic PDMS portion. This result suggested that BS had hydrophilic and hydrophobic domains. Fibrinogen was shown to adsorb onto BSO and BP surfaces, but longer contact time was needed for BP.
In 2003, Somorjai’s group published another paper where the molecular packing of fibrinogen, among other proteins, was studied on silica and deuterated polystyrene in the C-H stretching frequency range.[19] By observing changes in the SFG signal strength ratio of CH3 symmetric stretch and CH3 asymmetric stretch, they were able to show that as the number density increased (measured by fluorescence) on the silica surface, fibrinogen’s methyl groups became less tilted with respect to the surface normal. Adsorption of fibrinogen onto silica also exhibited concentration-dependent signal intensities and peak shape in the C-H range. Previous ellipsometry studies on silica surfaces stated that fibrinogen’s long axis was parallel to the surface at low concentrations and became perpendicular to the surface at high concentrations.[115] By combining these ellipsometry results with the SFG results on the methyl groups from this article, they illustrated this adsorption mechanism of fibrinogen via Figure 5. For hydrophobic polystyrene surfaces, although the number density of fibrinogen was higher than on the silica surfaces, the SFG signal was weaker indicating a more random distribution of orientations of the methyl groups on the polystyrene surfaces.
Figure 5.
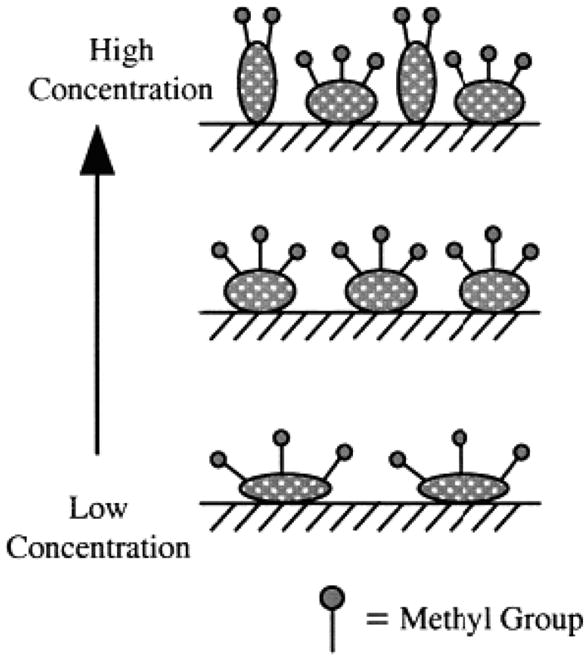
Proposed model for the orientation of methyl groups in fibrinogen adsorbed on hydrophilic silica surfaces with different surface concentrations. Adapted with permission from ref. 19. © 2003, American Chemical Society.
Using SFG, Cremer’s group was able to detect an N-H stretch signal, which indicated that lysine and arginine residues (of the αC domains) of fibrinogen were highly oriented at the silica interface at pH 8.0. This strongly correlated with the model they had derived from their AFM data (Figure 4), in which the αC domains were believed to be in contact with the silica surface at pH 8.0. They saw no SFG C-H stretch peaks, though, which meant that other residues in fibrinogen were not aligned.[18]
The first paper that studied the amide I frequency range of fibrinogen using SFG was published in 2005 by our group.[116] In it, we looked at three different types of surfaces: an aliphatic poly(ether urethane) (PEU), a silicone-poly(carbonate urethane) (SPCU) and a perfluorinated polymer (PFP). In fibrinogen, the net dipole of the two coiled coils goes from the E to the D domain. Because we were able to obtain strong amide I signal at 1650 cm−1, we deduced that fibrinogen must adopt a bent structure when binding to the substrates (Figure 6a). If fibrinogen were to adsorb in a linear fashion, no substantial SFG α-helical signal should be detected because the molecule would have more or less inversion symmetry. The intensity of the 1650 cm−1 peak changed in different manners for PEU, SPCU and PFP, as a function of time. For SPCU and PFP, the signal initially increased and then stabilized, whereas for PEU, the signal decreased over time. Because FTIR-ATR and quartz crystal microbalance (QCM) results showed that there were no large changes in secondary structure and in the number density of fibrinogen on the polymer surfaces over time, the signal changes were attributed to a change in orientation of the coiled coils. For PEU, the angle between the coiled coils was believed to become greater with time; whereas for SPCU and PFP, there was most likely a small decrease in that same angle (Figure 6b, c). The initial binding states of fibrinogen on SPCU and PFP versus PEU were also believed to be different. It is likely that fibrinogen interacts via the D domains on hydrophobic surfaces, such as SPCU and PFP, and via the αC domains for the hydrophilic polymer PEU (Figure 6). Based on the large intensity of the N-H stretching peak at 3275 cm−1 for PEU, when compared to SPCU and PFP, it could be said, much like in reference 18, that this signal originated from the side chains of lysine and arginine of the αC domains. This N-H signal decreased over time, which indicated some kind of restructuring of the αC domains causing them to become less ordered. This article was effectively able to point out the differences in the initial binding and post-adsorption changes of fibrinogen on these two types the surfaces.
Figure 6.

(a) Net transition dipole moments of fibrinogen in different configurations. Schematic of fibrinogen structural changes with time after adsorption onto (b) PEU and (c) SPCU and PFP. Reproduced with permission from ref. 116. © 2005, American Chemical Society.
Wang et al. studied both the C-H stretching region and amide I region of fibrinogen interacting with deuterated polystyrene.[117] By studying both a dilute and high concentration of fibrinogen, we were able to show that more C-H groups were able to orient themselves toward the interface at lower concentrations where the surface-protein interaction dominated. By looking at the amide I signal over time, it was seen that it first increased due to more fibrinogen adsorbing onto the surface, and then decreased most likely due to fibrinogen adopting a linear structure, similar to what happened on the PEU surface in reference 116. We were able to see that the changes in the hydrophobic side chains were localized, reaching an “equilibrium” shortly after adsorption; whereas the secondary structure reorientation took place over a longer period of time.
In the most recent paper by Wang et al., we quantitatively inspected the conformation of fibrinogen on the polystyrene surface by looking at the α-helical signal from the coiled coils.[50] We showed that the coiled coils of the adsorbed fibrinogen adopted a broad orientation distribution. The orientation distribution deduced by two SFG measurements assuming a Gaussian distribution was similar to the orientation distribution deduced by three measurements using SFG and FTIR-ATR assuming a maximum entropy function. Error analyses were also done to demonstrate the reliability of the calculated distribution. We believe that the broad orientation distribution was due to the disordered polystyrene surface onto which fibrinogen molecules adsorbed. This is different from the melittin case in a lipid bilayer, [49] where the environment is better defined and melittin-lipid interactions are more specific, thus causing melittin to adopt narrow distributions of orientations.
SFG studies on interfacial fibrinogen have successfully elucidated more detailed structural information of interfacial fibrinogen. By looking at the initial binding state and the consequent post-adsorption conformational changes, SFG studies have lead to a more in-depth understanding of fibrinogen bioadhesion.
3.2 Factor XII
Hageman factor (known as Factor XII (FXII)) is another protein that is extremely important in studying the biocompatibility of blood-contacting medical devices. It has been known since the 1950’s that FXII acts as an initiator of the intrinsic pathway that leads to blood coagulation, but a deficiency of it is not associated with excessive bleeding [118]. It is believed that FXII-mediated fibrin formation is crucial for pathological arterial thrombosis but not for hemostasis, suggesting that FXII is a safe target for anticoagulation.[119] Upon contacting with negatively charged surfaces, blood zymogen FXII becomes its activated form FXIIa. This activation starts the blood coagulation cascade in which the final step is the release of thrombin (FIIa), which hydrolyzes fibrinogen into fibrin. In the activation process of FXII (either by auto-activation or by kallikrein activation), the peptide bond between Arg353-Val354 breaks, cleaving FXII into a light and a heavy chain that are now only held together by a disulfide bond. The heavy chain consists of 353 amino acid residues and includes the positively charged fibronectin type II domain. This heavy chain is believed to be responsible for the binding of the protein to negatively charged surfaces.[120] There has been an extensive amount of research done on the activation of FXII by anionic surfaces, but the results of those studies are still controversial. It is generally believed that FXII becomes activated when it adsorbs onto negatively charged surfaces such as kaolin, glass, dextran sulfate, acidic phospholipids and sulfatides.[120–124] By using plasma coagulation time technique, however, Zhuo and coworkers recently showed that FXII contact activation is not specific to anionic hydrophilic surfaces. They were able to demonstrate that the activation of FXII in a neat-buffer solution is almost identical on hydrophobic and anionic hydrophilic procoagulant surfaces.[125, 126]
Our group has used SFG to study FXII contact activation and binding to charged and uncharged surfaces.[127] In this set of experiments, polystyrene (PS) was used as a model neutral surface, and sulfonated polystyrenes (sPS) of varied sulfonation degrees were used as model surfaces with different negative charge densities. The sPS samples studied had sulfonation levels ranging from 0 to a maximum of 37 percent. We did not use sPS surfaces with sulfonation levels higher than 37 percent because higher levels of sulfonation make the samples swell, making the interface difficult to study.
Our results indicated that SFG amide I signals collected from adsorbed FXII on sPS surfaces with higher sulfonation levels (higher negative charge densities) had stronger intensities (Figure 7). As discussed above, SFG amide I signal is dependent on the coverage, conformation, and orientation of absorbed proteins at the interface. The stronger intensities may therefore be due to higher surface coverage of FXII, substantial secondary structural changes of adsorbed FXII, or different orientations and orientation distributions of adsorbed FXII. In addition, the strong amide I signals may have contributions from higher order nonlinear optical processes that are enhanced on charged surfaces.
Figure 7.

SFG spectra of FXII adsorbed at solution/polymer interfaces (left panel) for several sulfonation levels. A solution concentration of 90 μg/mL FXII was used for all spectra. The background spectrum was taken from a PS/PBS interface without protein. Each spectrum was multiplied by the specified number to normalize its spectral intensity to facilitate comparison (right panel). Reproduced with permission from ref. 127. © 2007, American Chemical Society.
In order to determine the cause of the stronger SFG signal intensities, we investigated each of the above-mentioned possibilities. We first quantified the adsorbed amounts of FXII on PS and sPS surfaces using FTIR-ATR and QCM techniques. The measured adsorption amounts of FXII on the various PS and sPS surfaces were fairly similar. These results correlated very well with Zhuo’s conclusions125, 126 that the number of adsorbed FXII molecules is independent of the charge densities of the surfaces. Knowing this, we were able to conclude that any substantial difference in SFG amide I signals obtained between the various surfaces was not caused by the differences in the amount of FXII adsorbed. By using FTIR-ATR, we saw that the spectral features of adsorbed FXII were identical on the PS and various sPS surfaces. This indicated that the secondary structure content of FXII was independent of the charge densities of the surfaces. We also carried out some detailed calculations about the signal enhancement generated from the higher order nonlinear optical processes of charged surfaces. These calculations demonstrated that those types of signals are much weaker than SFG amide I signals. Based on these results, we concluded that the stronger SFG amide I signals of FXII on negatively charged surfaces were not caused by a higher protein adsorption amount, substantial secondary structure changes or higher nonlinear optical processes induced by the surface charge. The differences in SFG amide I signal intensities therefore had to be due to a change in orientation of the secondary structures within the protein, with the orientation of the secondary structures being affected by the degree of negative charge on the surfaces.
Studies on the secondary structure of FXII/FXIIa using techniques such as circular dichroism, fluorescence spectroscopy and ultraviolet difference spectroscopy have been carried out in the past, but due to their low resolution they have been unable to provide detailed orientation information of the adsorbed proteins.128–130 In this case, SFG was able to show that the orientation of the secondary structures within FXII was affected by the degree of negative surface charge. Stronger amide I signals from the more highly charged surfaces were due to better alignment of protein molecules on the surfaces, with more protein molecules adopting the same orientation (becoming more ordered on the surface). Because the FXII crystal structure is currently unknown and due to the likely complexity of the FXII molecular structure, we were, however, unable to quantitatively deduce the average orientation of FXII on PS and the various sPS surfaces.
Although in this particular case SFG itself cannot elucidate the exact orientation picture of adsorbed FXII, with the help of other techniques it can qualitatively unveil ordering information about the proteins. Correlation between the hemo-compatibility of surfaces and FXII’s ordering (and activation), as well as fibrinogen’s conformation, on these surfaces will undoubtedly prove to be helpful in designing more biocompatible blood-contacting devices that are thromboresistant.
3.3 Mefp-3
Mussel attachment to various surfaces in the marine environment was one of the earliest observations of bioadhesion, even before the word “bioadhesion” carried significance to medical applications.[131] Mussel attachment, which is widely encountered and easily observable, has been used as a model in studies of “general” protein adsorption and bioadhesion. Herbert Waite and his colleagues have made significant contributions to this field.[34, 131–166] It has been shown that mussels can attach to a wide variety of surfaces via byssi, which are extremely strong, quickly formed, and durable. Since adhesion occurs at the interface between two materials, research on adhesion has focused on studying the behavior of chemical functional groups available on the surfaces. Chemical characterization of the marine mussel (Mytilus edulis) foot has shown that there are at least five major adhesive protein families: mefp-1, mefp-2, mefp-3, mefp-4 and mefp-5.[162, 167] Each family is responsible for different parts of the adhesion process: mefp-1 forms a protective layer around the thread, the elastic rubber-like interior of the byssus primarily consists of mefp-2 and 4, and mefp-3 and 5 are responsible for the binding of the thread to the substrate.[168] All of these proteins contain 3,4-dihydroxy-L-phenylalanine (DOPA). Although DOPA’s role in mussel adhesion is not fully understood, it is generally believed that it plays a crucial role in the cross-linking process that solidifies the secreted adhesive proteinaceous liquid. It has been found that mefp-3 and mefp-5, which have the highest DOPA content among all of the mefp family (21% and 27%, respectively), appear to predominate at or near the interface between the plaque and substrate.[131, 155] Because of this, studies on the bioadhesive mechanism of mussel byssus focus on the interaction between surfaces and the high DOPA content proteins.[167, 169]
Extensive research on mefp proteins has been performed in various research laboratories. Mefp-1 and mefp-2 have been more widely examined due to their relatively easy sample separation. Spectroscopic methods that have been employed in the study of mussel adhesion include: surface enhanced Raman spectroscopy (SERS), FTIR-ATR, XPS, and ellipsometry. Even though these methods are powerful techniques for such studies, the detailed mechanism of mussel attachment still remains unclear.[154, 158, 165, 169–182]
SFG has recently been used in our laboratory to study mefp-3 adsorption onto surfaces of different hydrophobicities.[168] In this work, three different surfaces were studied: deuterated polystyrene (d-PS), deuterated poly(methyl methacrylate) (d-PMMA) and a fluorinated polymer (AF 2400). The hydrophobicity of these polymer surfaces was confirmed to be significantly different by contact angle measurements. SFG signals in the C-H stretching region and the amide I range were collected in situ at the polymer/mefp-3 solution interface. Because these surfaces were either deuterated or fluorinated, SFG C-H stretching signals should only stem from the interfacial proteins.
SFG C-H signals for mepf-3 can be characterized as the following: the 2850 cm−1, 2870 cm−1 and 2935 cm−1 peaks arise from methylene and methyl groups stretches, while the peaks beyond 3000 cm−1 (at 3055 cm−1 and 3120 cm−1) arise from aromatic C-H stretches. From SFG experiments, we observed no detectable C-H signal from mefp-3 on the d-PMMA surface (Figure 8). The absence of the C-H signal is not due to the lack of protein adsorption onto the d-PMMA surface; protein C-H signals can be observed after removing the surface from water and exposing it to air. In solution, however, because mefp-3 is a hydrophilic protein, its C-H groups (of the side chains) might not adopt any specific orientation while in contact with d-PMMA, which is also hydrophilic (its contact angle is 71°). The same type of argument, however, cannot be used to understand why SFG C-H signals from mefp-3 were a lot stronger when mefp-3 was adsorbed on the d-PS surface compared to the AF-2400 surface, because both surfaces are hydrophobic (Figure 8). To explain this, we had to take into account the structure of the adsorbed mefp-3 molecules, since SFG signal intensity is dependent on the conformation of the interfacial protein molecules. A possible explanation for this difference in intensity could be due to the fact that adsorbed mefp-3 molecules on AF-2400 may adopt a conformation that yields low SFG signal. This argument can be reinforced by noting the observed change in the SFG C-H signals of adsorbed protein molecules over time.[168] While the C-H stretch signals of adsorbed mefp-3 stabilized really quickly on the d-PS surface, the signals obtained from mefp-3 on AF-2400 dropped significantly over time.[168] This could be attributed to a slow conformational change of the interfacial protein molecules on AF 2400 surface and a very quick and efficient conformational change (or reordering) on the d-PS surface. These experiments were run in such a way that there were actually two interfaces: an air/protein solution interface and a polymer/protein solution interface once the polymer surface was brought into contact with the solution. In order to test whether this conformational change/reorientation of the proteins was a result of the initial ordering of proteins at the air interface and subsequent conformational changes as it interacted with the polymer, the air/protein solution interface was eliminated.[168] With this new setup, mefp-3 underwent a quick conformational change as soon as the solution was contacted to both AF-2400 and d-PS. This confirmed that our hypothesis to explain the SFG signal behavior of the previous setup was correct.[168]
Figure 8.
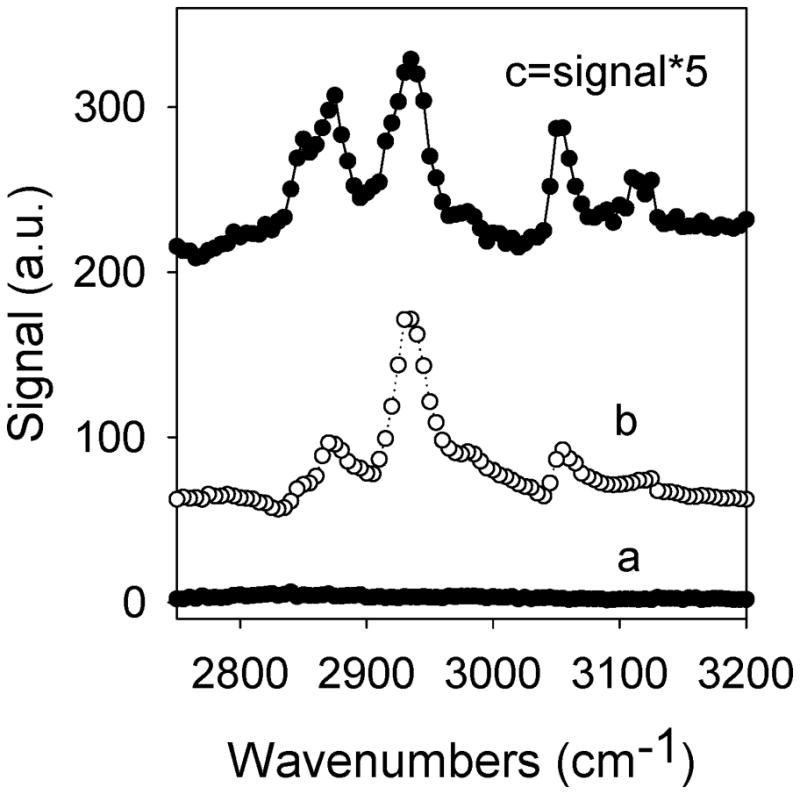
SFG spectra collected from (a) d-PMMA/Mefp-3 solution interface, (b) d- PS/Mefp-3 solution interface, and (c) AF2400/Mefp-3 solution interface. For comparison, the signal is multiplied by 5. Protein concentration: 10 μg/mL in D2O, ssp polarization. Reproduced with permission from ref. 168. © 2008, American Chemical Society.
Taking advantage of the various spectral features obtained from mefp-3 on the different surfaces, we were also able to qualitatively determine the behavior of certain interfacial amino acids using the peak assignments of the C-H stretches mentioned above. It was concluded that the interaction between mefp-3 and the d-PS surface was very strong because of ring-ring interactions (via aromatic rings from the d-PS surface and certain amino acids from mefp-3).
SFG signals of adsorbed mefp-3 in the amide I regime were also investigated. There was no observable amide I band for mefp-3 on d-PMMA surface (Figure 9), which may indicate that mefp-3′s backbone is randomly oriented on the d-PMMA surface. Because neither the C-H signals nor amide I band were detectable for mefp-3 on d-PMMA, it is likely that the whole protein adopts random orientations throughout the interface. Amide I signal from mefp-3/d-PS interface was much stronger than from mefp-3/AF-2400 interface (Figure 9). This also correlates very well to the results from the C-H signals discussed above about the ordering of the adsorbed protein molecules and it therefore appears that both the protein backbone and side chains adopt similar degrees of orientation on the two surfaces.
Figure 9.
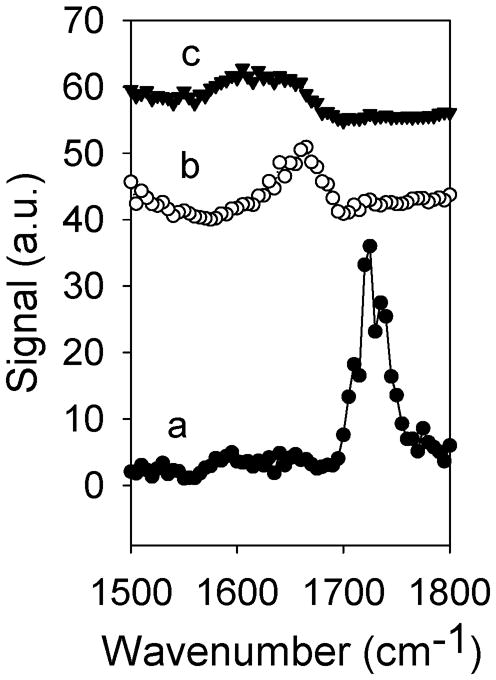
SFG spectra collected from (a) d-PMMA/Mefp-3 solution interface, (b) d- PS/Mefp-3 solution interface, and (c) AF2400/Mefp-3 solution interface. Protein concentration: 10 μg/mL in D2O, ssp polarization. Reproduced with permission from ref. 168. © 2008, American Chemical Society.
SFG spectroscopy in this study was able to qualitatively characterize the interaction between mefp-3 and surfaces of different hydrophobicities. Hydrophobic surfaces, d-PS and AF-2400, caused ordering of the proteins at the interface, whereas the hydrophilic surface d-PMMA did not. The d-PS surface appeared to be more favorable for byssus pads to bind to because of the strong ring-ring interaction between the polymer chains and selected protein amino acids. Both the type of surface (hydrophobic versus hydrophilic) and the availability of functional groups on the surface were shown to play important roles in understanding the interaction in terms of the degree of binding and the ordering/conformations of the adsorbed protein molecules at interfaces.
4. Summary and Conclusions
SFG has been applied to investigate the molecular interactions between various proteins and polymer surfaces in order to understand the molecular mechanisms of bioadhesion. For these types of experiments, both SFG signals in the C-H stretching and amide I frequency regions have been collected and analyzed. The C-H signals can be used to study the ordering and orientation of protein side chains, and the amide I signals lead to a better understanding of the conformation of the interfacial protein’s secondary structures.
With the help of the fibrinogen crystal structure, SFG studies have indicated that adsorbed fibrinogen molecules on different polymer surfaces adopt varied conformations and exhibit different post-adsorption structural changes. On a particular polymer (PS) surface, the side chains and backbones of adsorbed fibrinogen were shown to have separate time-dependent behaviors due to the different surface protein interactions (e.g., electrostatic vs. hydrophobic interactions). The angle between the two coiled coils of fibrinogen was found to change after adsorption onto different surfaces (either by becoming smaller or larger). It was also shown that fibrinogen can adopt a broad orientation distribution after becoming adsorbed onto a polymer surface.
Although the crystal structures of FXII and mefp-3 are unknown, SFG can provide some important qualitative results regarding the orientation and orientation distribution (or degree of order) of adsorbed FXII and mefp-3 on various polymer surfaces. For FXII, different surface charge densities were shown to greatly affect the adsorption order. For mefp-3, it was found that the general term “hydrophobicity” could not be used to interpret detailed interactions between surfaces and mefp-3, and that the adsorption of mefp-3 is controlled by specific interfacial functional groups (e.g. by ring-ring interactions). It is thus of great importance to characterize the adsorption of proteins to surfaces at the molecular level.
As mentioned in the introduction, adhesion processes may involve many factors, such as chemical bonding, hydrogen bonding, van der Waals interactions, electrostatic attraction and interfacial entanglement. The SFG studies summarized in this article elucidate how surface charge (electrostatic attraction) and surface hydrophobicity/hydrophilicity (e.g. hydrogen bonding and van der Waals interactions) can affect interfacial protein orientation and conformation (possibility related to interfacial entanglement). The continued success in this kind of research will greatly help in the understanding of molecular mechanisms of bioadhesion.
Acknowledgments
This research is supported by the Office of Naval Research (N00014-02-1-0832, N-00014-08-1-1211), the National Science Foundation (CHE-0449469), the National Institute of Health (1R01GM081655-01A2), and the University of Michigan.
Footnotes
One of a collection of papers honoring Herb Waite, 2009 recipient of The Adhesion Society Award for Excellence
References
- 1.Gray JJ. Curr Opin Struct Biol. 2004;14:110–115. doi: 10.1016/j.sbi.2003.12.001. [DOI] [PubMed] [Google Scholar]
- 2.Wynne KJ, Guard H. Nav Res Rev. 1997;49:1–3. [Google Scholar]
- 3.Brash JL, Horbett TA. Proteins at Interfaces: Physicochemical and Biochemical Studies. American Chemical Society; Washington, D.C: 1987. [Google Scholar]
- 4.Horbett TA, Brash JL. Proteins at Interfaces II: Fundamentals and Applications. American Chemical Society; Washington, D.C: 1995. [Google Scholar]
- 5.Zasloff M. Nature. 2002;415:389–395. doi: 10.1038/415389a. [DOI] [PubMed] [Google Scholar]
- 6.Chickering DE, III, Mathiowitz E. Bioadhesive Drug Derlivery Systems: Fundaementals, Novel Approaches, and Development. Chap 1. Marcel Dekker, Inc; New York: 1999. pp. 1–10. [Google Scholar]
- 7.Lenk TJ, Horbett TA, Ratner BD, Chittur KK. Langmuir. 1991;7:1755–1764. [Google Scholar]
- 8.Chittur KK. Biomaterials. 1998;19:357–369. doi: 10.1016/s0142-9612(97)00223-8. [DOI] [PubMed] [Google Scholar]
- 9.Magnani A, Busi E, Barbucci R. J Mater Sci: Mater Med. 1994;5:839–843. [Google Scholar]
- 10.Sethuraman A, Vedantham G, Imoto T, Przybycien T, Belfort G. Prot Struct Funct Bioinf. 2004;56:669–678. doi: 10.1002/prot.20183. [DOI] [PubMed] [Google Scholar]
- 11.McMillin CR, Walton AG. J Colloid Interf Sci. 1974;48:345. [Google Scholar]
- 12.Chen YL, Mao HB, Zhang XF, Gong YD, Zaho NM. Int J Biol Macromol. 1999;26:129. doi: 10.1016/s0141-8130(99)00073-2. [DOI] [PubMed] [Google Scholar]
- 13.Soderquist ME, Walton AG. J Colloid Interf Sci. 1980;75:386–397. [Google Scholar]
- 14.Ahern AM, Garrell RL. Langmuir. 1991;7:254–261. [Google Scholar]
- 15.Ooka AA, Garrell RL. Biopolymers. 2000;57:92–102. doi: 10.1002/(SICI)1097-0282(2000)57:2<92::AID-BIP6>3.0.CO;2-4. [DOI] [PubMed] [Google Scholar]
- 16.Wang J, Buck SM, Chen Z. J Phys Chem B. 2002;106:11666–11672. [Google Scholar]
- 17.Wang J, Buck SM, Even MA, Chen Z. J Am Chem Soc. 2002;124:13302–13305. doi: 10.1021/ja026881m. [DOI] [PubMed] [Google Scholar]
- 18.Jung SY, Lim SM, Albertorio F, Kim G, Gurau MC, Yang RD, Holden MA, Cremer PS. J Am Chem Soc. 2003;125:12782–12786. doi: 10.1021/ja037263o. [DOI] [PubMed] [Google Scholar]
- 19.Kim J, Somorjai GA. J Am Chem Soc. 2003;125:3150–3158. doi: 10.1021/ja028987n. [DOI] [PubMed] [Google Scholar]
- 20.Dreesen L, Humbert C, Sartenaer Y, Caudano Y, Volcke C, Mani AA, Peremans A, Thiry PA, Hanique S, Frere J. Langmuir. 2004;20:7201–7207. doi: 10.1021/la0488001. [DOI] [PubMed] [Google Scholar]
- 21.Doyle AW, Fick J, Himmelhaus M, Eck W, Graziani I, Prudovsky I, Grunze M, Maciag T, Neivandt DJ. Langmuir. 2004;20:8961–8965. doi: 10.1021/la0484220. [DOI] [PubMed] [Google Scholar]
- 22.Chen X, Clarke ML, Wang J, Chen Z. Int J Mod Phys B. 2005;20:691–713. [Google Scholar]
- 23.Wang J, Chen X, Clarke ML, Chen Z. Proc Natl Acad Sci USA. 2005;102:4978–4983. doi: 10.1073/pnas.0501206102. [DOI] [PMC free article] [PubMed] [Google Scholar]
- 24.Knoesen A, Pakalnis S, Wang M, Wise WD, Lee N, Frank CW. IEEE J Sel Top Quantum Electron. 2004;10:1154–1163. [Google Scholar]
- 25.Chen X, Wang J, Sniadecki JJ, Even MA, Chen Z. Langmuir. 2005;21:2262–2264. doi: 10.1021/la050048w. [DOI] [PubMed] [Google Scholar]
- 26.Chen Z, Ward R, Tian Y, Malizia F, Gracias DH, Shen YR, Somorjai GA. J Biomed Mater Res. 2002;62:254–264. doi: 10.1002/jbm.10075. [DOI] [PubMed] [Google Scholar]
- 27.Kim G, Gurau M, Kim J, Cremer PS. Langmuir. 2002;18:2807–2811. [Google Scholar]
- 28.Dreesen L, Sartenaer Y, Humbert C, Mani AA, Methivier C, Pradier CM, Thiry PA, Peremans A. Chem Phys Chem. 2004;5:1719–1725. doi: 10.1002/cphc.200400213. [DOI] [PubMed] [Google Scholar]
- 29.Clarke ML, Wang J, Chen Z. Anal Chem. 2003;75:3275–3280. doi: 10.1021/ac034417+. [DOI] [PubMed] [Google Scholar]
- 30.Wang J, Clarke ML, Chen Z. Anal Chem. 2004;76:2159–2167. doi: 10.1021/ac049887y. [DOI] [PubMed] [Google Scholar]
- 31.Koffas TS, Kim J, Lawrence CC, Somorjai GA. Langmuir. 2003;19:3563–3566. [Google Scholar]
- 32.Kim G, Gurau MC, Lim SM, Cremer PS. J Phys Chem B. 2003;107:1403–1409. [Google Scholar]
- 33.Dreesen L, Sartenaer Y, Humbert C, Mani AA, Lemaire JJ, Methivier C, Pradier CM, Thiry PA, Peremans A. Thin Sol Films. 2004;464–465:373–378. [Google Scholar]
- 34.Wang J, Even MA, Chen X, Schmaier AH, Waite JH, Chen Z. J Am Chem Soc. 2003;125:9914–9915. doi: 10.1021/ja036373s. [DOI] [PubMed] [Google Scholar]
- 35.Shen YR. The Principles of Nonlinear Optics. John Wiley & Sons; New York: 1984. [Google Scholar]
- 36.Shen YR. Annu Rev Phys Chem. 1989;40:327–350. [Google Scholar]
- 37.Bain CD. J Chem Soc, Faraday Trans. 1995;91:1281–1296. [Google Scholar]
- 38.Richmond GL. Chem Rev. 2002;102:2693–2724. doi: 10.1021/cr0006876. [DOI] [PubMed] [Google Scholar]
- 39.Buck M, Himmelhaus MJ. Vac Sci Technol. 2001;19:2717–2736. [Google Scholar]
- 40.Wang J, Chen C, Buck SM, Chen Z. J Phys Chem B. 2001;105:12118–12125. [Google Scholar]
- 41.Wang J, Paszti Z, Even MA, Chen Z. J Am Chem Soc. 2002;124:7016–7023. doi: 10.1021/ja012387r. [DOI] [PubMed] [Google Scholar]
- 42.Wang J, Paszti Z, Even MA, Chen Z. J Phys Chem B. 2004;108:3625–3632. [Google Scholar]
- 43.Baldelli S. J Phys Chem B. 2003;107:6148–6152. [Google Scholar]
- 44.Ye S, Morita S, Li GF, Noda H, Tanaka M, Uosaki K, Osawa M. Macromolecules. 2003;36:5694–5703. [Google Scholar]
- 45.Casford MTL, Davies PB. Langmuir. 2003;19:7386–7391. [Google Scholar]
- 46.Liu J, Conboy JC. J Am Chem Soc. 2004;126:8376–8377. doi: 10.1021/ja048245p. [DOI] [PubMed] [Google Scholar]
- 47.Lambert AG, Davies PB, Neivandt DJ. App Spec Rev. 2005;40:103–145. [Google Scholar]
- 48.Chen Z, Shen Y, Somorjai GA. Ann Rev Phys Chem. 2002;53:437–465. doi: 10.1146/annurev.physchem.53.091801.115126. [DOI] [PubMed] [Google Scholar]
- 49.Chen X, Wang J, Boughton AP, Kristalyn CB, Chen Z. J Am Chem Soc. 2007;129:1420–1427. doi: 10.1021/ja067446l. [DOI] [PubMed] [Google Scholar]
- 50.Wang J, Lee S, Chen Z. J Phys Chem B. 2008;112:2281–2290. doi: 10.1021/jp077556u. [DOI] [PubMed] [Google Scholar]
- 51.Tamm LK, Tatulian SA. Quart Rev Biophys. 1997;30:365–429. doi: 10.1017/s0033583597003375. [DOI] [PubMed] [Google Scholar]
- 52.Perry A, Neipert C, Space B, Moore PB. Chem Rev. 2006;106:1234–1258. doi: 10.1021/cr040379y. [DOI] [PubMed] [Google Scholar]
- 53.Chen X, Wang J, Kristalyn CB, Chen Z. Biophys J. 2007;93:866–875. doi: 10.1529/biophysj.106.099739. [DOI] [PMC free article] [PubMed] [Google Scholar]
- 54.Chen X, Boughton AP, Tesmer JJG, Chen Z. J Am Chem Soc. 2007;129:12658–12659. doi: 10.1021/ja075542w. [DOI] [PubMed] [Google Scholar]
- 55.Wang J, Paszti Z, Clarke ML, Chen X, Chen Z. J Phys Chem B. 2007;111:6088–6095. doi: 10.1021/jp070383o. [DOI] [PubMed] [Google Scholar]
- 56.Wang J, Chen C, Buck SM, Chen Z. J Phys Chem B. 2001;105:12118–12125. [Google Scholar]
- 57.Wei X, Zhuang X, Hong SC, Goto T, Shen YR. Phys Rev Lett. 1999;82:4256. [Google Scholar]
- 58.Moad AJ, Simpson GJ. J Phys Chem B. 2004;108:3548–3562. [Google Scholar]
- 59.Berkovic G, Superfine R, Guyot-Sionnest P, Shen YR. J Opt Soc Am B. 1988;5:668–673. [Google Scholar]
- 60.Mohammad-Djafari A. ArXiv Physics e-prints, physics/0111126. 2001. [Google Scholar]
- 61.Mohammad-Djafari A. Maximum Entropy and Bayesian Methods. Kluwer Academic Publishers; Norwell, MA: 1992. pp. 221–234. [Google Scholar]
- 62.Mead LR, Papanicolaou NJ. Math Phys. 1984;25:2404–2417. [Google Scholar]
- 63.Yamaguchi S, Tahara T. J Phys Chem B. 2005;109:24211–24214. doi: 10.1021/jp0542064. [DOI] [PubMed] [Google Scholar]
- 64.Fujiyoshi S, Ishibashi T, Onishi H. J Phys Chem B. 2004;108:10636–10639. [Google Scholar]
- 65.Brash JL, Davidson VJ. Thromb Res. 1976;9:249–259. doi: 10.1016/0049-3848(76)90214-0. [DOI] [PubMed] [Google Scholar]
- 66.Lee RG, Adamson C, Kim SW. Thromb Res. 1974;4:485–490. doi: 10.1016/0049-3848(74)90083-8. [DOI] [PubMed] [Google Scholar]
- 67.Vroman L, Adams AL, Klings M, Fischer G. ACS Advances in Chemistry Series, No 145. American Chemical Society; Washington, D.C: 1975. [Google Scholar]
- 68.Chinn JA, Horbett TA, Ratner BD. Thromb Haemost. 1991;65:608. [PubMed] [Google Scholar]
- 69.Moskowitz KA, Kudryk B, Coller BS. Thromb Haemost. 1998;79:824. [PubMed] [Google Scholar]
- 70.Lindon JN, McManama G, Kushner L, Merrill EW, Salzman EW. Blood. 1986;68:355–362. [PubMed] [Google Scholar]
- 71.Wertz CF, Santore MM. Langmuir. 2002;18:706–715. [Google Scholar]
- 72.Jandt KD. Surf Sci. 2001;491:303–332. [Google Scholar]
- 73.Bailly AL, Laurent A, Lu H, Elalami I, Jacob P, Mundler O, Merland JJ, Lautier A, Soria J, Soria C. J Biomed Mater Res. 1996;30:101. doi: 10.1002/(SICI)1097-4636(199601)30:1<101::AID-JBM13>3.0.CO;2-R. [DOI] [PubMed] [Google Scholar]
- 74.Lambrecht LK, Young BR, Stafford RE, Park K, Albrecht RM, Mosher DF, Cooper SL. Thromb Res. 1986;41:99–117. doi: 10.1016/0049-3848(86)90283-5. [DOI] [PubMed] [Google Scholar]
- 75.Desroches MJ, Omanovic S. Phys Chem Chem Phys. 2008;10:2502–2512. doi: 10.1039/b719371h. [DOI] [PubMed] [Google Scholar]
- 76.Feng L, Andrade JD. Proteins at Interfaces II: Fundamental and Applications. American Chemical Society; Washington D.C: 1995. [Google Scholar]
- 77.Ta TC, Sykes MT, McDermott MT. Langmuir. 1998;14:2435–2443. [Google Scholar]
- 78.Marchin KL, Berrie CL. Langmuir. 2003;19:9883–9888. [Google Scholar]
- 79.Drake B, Prater CB, Weisenhorn AL, Gould SAC, Albrecht TR, Quate CF, Cannell DS, Hansma HG, Hansma PK. Science. 1989;243:1586–1589. doi: 10.1126/science.2928794. [DOI] [PubMed] [Google Scholar]
- 80.Taatjes DJ, Quinn AS, Jenny RJ, Hale P, Bovill EG, McDonagh J. Cell Biol Int. 1997;21:715–726. doi: 10.1006/cbir.1997.0216. [DOI] [PubMed] [Google Scholar]
- 81.Sit PS, Marchant RE. Thromb Haemost. 1999;82:1053. [PubMed] [Google Scholar]
- 82.Agnihotri A, Siedlecki CA. Langmuir. 2004;20:8846–8852. doi: 10.1021/la049239+. [DOI] [PubMed] [Google Scholar]
- 83.Tsapikouni TS, Missirlis YF. Colloids Surf, B. 2007;57:89–96. doi: 10.1016/j.colsurfb.2007.01.011. [DOI] [PubMed] [Google Scholar]
- 84.Sit PS, Marchant RE. Surf Sci. 2001;491:421–432. [Google Scholar]
- 85.Tunc S, Maitz MF, Steiner G, Vázquez L, Pham R, Salzer MT. Colloids Surf B Biointerf. 2005;42:219–225. doi: 10.1016/j.colsurfb.2005.03.004. [DOI] [PubMed] [Google Scholar]
- 86.Ortega-Vinuesa JL, Tengvall P, Lundström I. Thin Sol Films. 1998;324:257–273. [Google Scholar]
- 87.Ortega-Vinuesa JL, Tengvall P, Lundström I. J Colloid Interf Sci. 1998;207:228–239. doi: 10.1006/jcis.1998.5624. [DOI] [PubMed] [Google Scholar]
- 88.Wigren R, Elwing H, Erlandsson R, Welin S, Lundström I. FEBS Lett. 1991;280:225–228. doi: 10.1016/0014-5793(91)80298-h. [DOI] [PubMed] [Google Scholar]
- 89.Cacciafesta P, Humphris ADL, Jandt KD, Miles MJ. Langmuir. 2000;16:8167–8175. [Google Scholar]
- 90.VanDeKeere I, Willaert R, Hubin A, Vereecken J. Langmuir. 2008;24:1844–1852. doi: 10.1021/la7016566. [DOI] [PubMed] [Google Scholar]
- 91.Gettens RTT, Gilbert JL. J Biomed Mater Res Part A. 2007;81A:465–473. doi: 10.1002/jbm.a.30995. [DOI] [PubMed] [Google Scholar]
- 92.Lousinian S, Kassavetis S, Logothetidis S. Diam Rel Mater. 2007;16:1868–1874. [Google Scholar]
- 93.Sethuraman A, Han M, Kane RS, Belfort G. Langmuir. 2004;20:7779–7788. doi: 10.1021/la049454q. [DOI] [PubMed] [Google Scholar]
- 94.Marchant RE, Barb MD, Shainoff JR, Eppel SJ, Wilson DL, Siedlecki CA. Thromb Haemost. 1997;77:1048. [PubMed] [Google Scholar]
- 95.Ishizaki T, Saito N, Sato Y, Takai O. Surf Sci. 2007;601:3861–3865. [Google Scholar]
- 96.Rasmusson JR, Erlandsson R, Salaneck WR, Schott M, Clark DT, Lundstrom I. Scan Microsc. 1994;8:481. [Google Scholar]
- 97.Chen X, Davies MC, Roberts CJ, Shakesheff KM, Tendler SJB, Williams PM. Anal Chem. 1996;68:1451–1455. [Google Scholar]
- 98.Green RJ, Davies J, Davies MC, Roberts CJ, Tendler SJB. Biomaterials. 1997;18:405–413. doi: 10.1016/s0142-9612(96)00141-x. [DOI] [PubMed] [Google Scholar]
- 99.Jandt KD, Finke M, Cacciafesta P. Colloids Surf, B. 2000;19:301–314. doi: 10.1016/s0927-7765(00)00139-9. [DOI] [PubMed] [Google Scholar]
- 100.Ohta R, Saito N, Ishizaki T, Takai O. Surf Sci. 2006;600:1674–1678. [Google Scholar]
- 101.Brash JL, Uniyal S. J Polym Sci: Polym Symp. 1979;66:377–389. [Google Scholar]
- 102.Massa TM, McClung WG, Yang ML, Ho JYC, Brash JL, Santerre JP. J Biomed Mater Res Part A. 2007;81A:178–185. doi: 10.1002/jbm.a.30936. [DOI] [PubMed] [Google Scholar]
- 103.Balasubramanian V, Grusin NK, Bucher RW, Turitto VT, Slack SM. J Biomed Mater Res. 1999;44:253–260. doi: 10.1002/(sici)1097-4636(19990305)44:3<253::aid-jbm3>3.0.co;2-k. [DOI] [PubMed] [Google Scholar]
- 104.Lousinian S, Logothetidis S. Phys Stat Sol (c) 2008;5:1295–1299. [Google Scholar]
- 105.Park K, Albrecht RM, Simmons SR, Cooper SL. J Colloid Interf Sci. 1986;111:197–212. [Google Scholar]
- 106.Koh LB, Rodriguez I, Zhou J. J Biomed Mater Res Part A. 2008;86A:394–401. doi: 10.1002/jbm.a.31605. [DOI] [PubMed] [Google Scholar]
- 107.Salim M, O’Sullivan B, McArthur SL, Wright P. Lab Chip. 2007;7:64–70. doi: 10.1039/b612521m. [DOI] [PubMed] [Google Scholar]
- 108.Scott EA, Elbert DL. Biomaterials. 2007;28:3904–3917. doi: 10.1016/j.biomaterials.2007.05.022. [DOI] [PMC free article] [PubMed] [Google Scholar]
- 109.Agashe M, Raut V, Stuart SJ, Latour RA. Langmuir. 2005;21:1103–1117. doi: 10.1021/la0478346. [DOI] [PubMed] [Google Scholar]
- 110.Gubskaya AV, Kholodovych V, Knight D, Kohn J, Welsh WJ. Polymer. 2007;48:5788–5801. doi: 10.1016/j.polymer.2007.07.007. [DOI] [PMC free article] [PubMed] [Google Scholar]
- 111.Oja PD, Holmes GW, Perkins HA, Love J. J Biomed Mater Res. 1969;3:165–174. doi: 10.1002/jbm.820030113. [DOI] [PubMed] [Google Scholar]
- 112.Grunkemeier J, Wan C, Horbett T. J Biomater Sci, Polym Ed. 1997;8:189–209. doi: 10.1163/156856296x00246. [DOI] [PubMed] [Google Scholar]
- 113.Horbett TA, Lew KR. J Biomater Sci, Polym Ed. 1995;6:15–33. doi: 10.1163/156856295x00724. [DOI] [PubMed] [Google Scholar]
- 114.Nieuwenhuizen W, Mosesson MW, De Maat MPM. Fibrinogen. New York: 2001. [Google Scholar]
- 115.Schaaf P, Dejardin P, Schmitt A. Langmuir. 1987;3:1131–1135. [Google Scholar]
- 116.Clarke ML, Wang J, Chen Z. J Phys Chem B. 2005;109:22027–22035. doi: 10.1021/jp054456k. [DOI] [PubMed] [Google Scholar]
- 117.Wang J, Chen X, Clarke ML, Chen Z. J Phys Chem B. 2006;110:5017–5024. doi: 10.1021/jp0534683. [DOI] [PubMed] [Google Scholar]
- 118.Renné T, Gailani D. Expert Rev Cardiovasc Ther. 2007;5:733–741. doi: 10.1586/14779072.5.4.733. [DOI] [PubMed] [Google Scholar]
- 119.Renne T, Nieswandt B, Gailani D. Blood Cells Mol Dis. 2006;36:148–151. doi: 10.1016/j.bcmd.2005.12.014. [DOI] [PubMed] [Google Scholar]
- 120.Schousboe I. Biochem Pharmac. 2008;75:1007–1013. doi: 10.1016/j.bcp.2007.10.003. [DOI] [PubMed] [Google Scholar]
- 121.Griffin JH. Proc Natl Acad Sci USA. 1978;75:1998–2002. doi: 10.1073/pnas.75.4.1998. [DOI] [PMC free article] [PubMed] [Google Scholar]
- 122.Silverberg M, Dun J, Garen L, Kaplan A. J Biol Chem. 1980;255:7281–7286. [PubMed] [Google Scholar]
- 123.Fuhrer G, Gallimore MJ, Heller W, Hoffmeister HE. Blut. 1990;61:258–266. doi: 10.1007/BF01732874. [DOI] [PubMed] [Google Scholar]
- 124.Pixley RA, Colman RW. Methods in Enzymology, Vol 222, Proteolytic Enzymes in Coagulation, Fibrinolysis, and Complement Activation Part A. Chap 4. Academic Press, Inc; San Diego: 1993. pp. 51–65. [Google Scholar]
- 125.Zhuo R, Siedlecki CA, Vogler EA. Biomaterials. 2006;27:4325–4332. doi: 10.1016/j.biomaterials.2006.04.001. [DOI] [PubMed] [Google Scholar]
- 126.Zhuo R, Siedlecki CA, Vogler EA. Biomaterials. 2007;28:4355–4369. doi: 10.1016/j.biomaterials.2007.06.019. [DOI] [PMC free article] [PubMed] [Google Scholar]
- 127.Chen X, Wang J, Paszti Z, Wang F, Schrauben JN, Tarabara VV, Schmaier AH, Chen Z. Anal Bioanal Chem. 2007;388:65–72. doi: 10.1007/s00216-006-0999-8. [DOI] [PubMed] [Google Scholar]
- 128.Tazi S, Tans G, Hemker HC, Nigretto J. Thromb Res. 1992;67:665–676. doi: 10.1016/0049-3848(92)90070-q. [DOI] [PubMed] [Google Scholar]
- 129.Samuel M, Samuel E, Villanueva GB. Thromb Res. 1994;75:259–268. doi: 10.1016/0049-3848(94)90237-2. [DOI] [PubMed] [Google Scholar]
- 130.Tans G, Griffin J. Blood. 1982;59:69–75. [PubMed] [Google Scholar]
- 131.Waite JH. Integr Comp Biol. 2002;42:1172–1180. doi: 10.1093/icb/42.6.1172. [DOI] [PubMed] [Google Scholar]
- 132.Waite JH. Chem Ind. 1991;17:607–611. [Google Scholar]
- 133.Williams TJ, Waite JH, Henkens R, Marumo K. FASEB Journal. 1988;2:A1339. [Google Scholar]
- 134.Benedict CV, Waite JH. J Morphol. 1986;189:261–270. doi: 10.1002/jmor.1051890305. [DOI] [PubMed] [Google Scholar]
- 135.Benedict CV, Waite JH. J Morphol. 1986;189:171–181. doi: 10.1002/jmor.1051890207. [DOI] [PubMed] [Google Scholar]
- 136.Waite JH, Housley TJ, Tanzer ML. Biochemistry. 1985;24:5010–5014. doi: 10.1021/bi00340a008. [DOI] [PubMed] [Google Scholar]
- 137.Waite JH. J Biol Chem. 1983;258:2911–2915. [PubMed] [Google Scholar]
- 138.Waite JH, Tanzer ML. Science. 1981;212:1038–1040. doi: 10.1126/science.212.4498.1038. [DOI] [PubMed] [Google Scholar]
- 139.Waite JH. Nat Mater. 2008;7:8–9. doi: 10.1038/nmat2087. [DOI] [PubMed] [Google Scholar]
- 140.Sagert J, Sun C, Waite JH. Biological Adhesives. Chap 7. Springer; Berlin, Germany: 2006. pp. 125–143. [Google Scholar]
- 141.Waite JH, Weaver JC, Vaccaro E. Bionanotechnol: Prot Nanodev. 2006:25–37. [Google Scholar]
- 142.Zhao H, Waite JH. Biochemistry. 2006;45:14223–14231. doi: 10.1021/bi061677n. [DOI] [PMC free article] [PubMed] [Google Scholar]
- 143.Sun CJ, Waite JH. J Biol Chem. 2005;280:39332–39336. doi: 10.1074/jbc.M508674200. [DOI] [PubMed] [Google Scholar]
- 144.Waite JH, Andersen NH, Jewhurst S. J Adhes. 2005;81:297–317. [Google Scholar]
- 145.Zhao H, Waite JH. Biochemistry. 2005;44:15915–15923. doi: 10.1021/bi051530g. [DOI] [PMC free article] [PubMed] [Google Scholar]
- 146.Lucas JM, Vaccaro E, Waite JH. J Exp Biol. 2002;205:1807–1817. doi: 10.1242/jeb.205.12.1807. [DOI] [PubMed] [Google Scholar]
- 147.Sun CJ, Lucas JM, Waite JH. Biomacromolecules. 2002;3:1240–1248. doi: 10.1021/bm0255903. [DOI] [PubMed] [Google Scholar]
- 148.Lucas JM, Waite JH. Amer Zool. 2001;41:1511–1511. [Google Scholar]
- 149.Vaccaro E, Waite JH. Biomacromolecules. 2001;2:906–911. doi: 10.1021/bm0100514. [DOI] [PubMed] [Google Scholar]
- 150.Waite JH. Amer Zool. 2001;41:1617–1618. [Google Scholar]
- 151.Waite JH, Qin XX. Biochemistry. 2001;40:2887–2893. doi: 10.1021/bi002718x. [DOI] [PubMed] [Google Scholar]
- 152.Coyne KJ, Waite JH. J Exp Biol. 2000;203:1425–1431. doi: 10.1242/jeb.203.9.1425. [DOI] [PubMed] [Google Scholar]
- 153.Floriolli RY, von Langen J, Waite JH. Marine Biotechnol. 2000;2:352–363. doi: 10.1007/s101269900032. [DOI] [PubMed] [Google Scholar]
- 154.Harder P, Grunze M, Waite JH. J Adhes. 2000;73:161–173. [Google Scholar]
- 155.Waite JH. Ann NY Acad Sci. 1999;875:301–309. doi: 10.1111/j.1749-6632.1999.tb08513.x. [DOI] [PubMed] [Google Scholar]
- 156.Warner SC, Waite JH. Mar Biol. 1999;134:729–734. [Google Scholar]
- 157.Deacon MP, Davis SS, Waite JH. Biochemistry. 1998;37:14108–14112. doi: 10.1021/bi9806192. [DOI] [PubMed] [Google Scholar]
- 158.Hansen DC, Corcoran SG, Waite JH. Langmuir. 1998;14:1139–1147. [Google Scholar]
- 159.Vreeland V, Waite JH, Epstein L. J Phycol. 1998;34:1–8. [Google Scholar]
- 160.Coyne KJ, Qin X, Waite JH. Science. 1997;277:1830–1832. doi: 10.1126/science.277.5333.1830. [DOI] [PubMed] [Google Scholar]
- 161.Taylor SW, Waite JH. Protein-Based Materials (Bioengineering of Materials) Chap 7. Birkhäuser Verlag; Basel, Switzerland: 1997. pp. 217–248. [Google Scholar]
- 162.Waite JH. Proc Annu Meet Adhes Soc. 1997;20:297–298. [Google Scholar]
- 163.Klug CA, Burzio LA, Waite JH, Schaefer J. Arch Biochem Biophys. 1996;333:221–224. doi: 10.1006/abbi.1996.0384. [DOI] [PubMed] [Google Scholar]
- 164.Papov VV, Diamond TV, Biemann K, Waite JH. J Biol Chem. 1995;270:20183–20192. doi: 10.1074/jbc.270.34.20183. [DOI] [PubMed] [Google Scholar]
- 165.Hansen DC, Luther GW, Waite JH. J Colloid Interf Sci. 1994;168:206–216. [Google Scholar]
- 166.Rzepecki LM, Chin S, Waite J, Lavin MF. Mol Mar Biol Biotechnol. 1991;1:78–88. [PubMed] [Google Scholar]
- 167.Lee H, Scherer NF, Messersmith PB. Proc Natl Acad Sci USA. 2006;103:12999–13003. doi: 10.1073/pnas.0605552103. [DOI] [PMC free article] [PubMed] [Google Scholar]
- 168.Even MA, Wang MA, Chen Z. Langmuir. 2008;24:5795–5801. doi: 10.1021/la800138x. [DOI] [PubMed] [Google Scholar]
- 169.Suci PA, Geesey GG. Colloids Surf, B. 2001;22:159–168. doi: 10.1016/s0927-7765(01)00149-7. [DOI] [PubMed] [Google Scholar]
- 170.Schnurrer J, Lehr C. Int J Pharm. 1996;141:251–256. [Google Scholar]
- 171.Ooka AA, Garrel RL. Biopolymers. 1999;57:92–102. [Google Scholar]
- 172.Suci PA, Geesey GG. J Colloid Interf Sci. 2000;230:340–348. doi: 10.1006/jcis.2000.7120. [DOI] [PubMed] [Google Scholar]
- 173.Haemers S, van der Leeden MC, Nijman EJ, Frens G. Colloids Surf, A. 2001;190:193–203. [Google Scholar]
- 174.Fant C, Sott K, Elwing H, Hook F. Biofouling. 2000;16:119–132. [Google Scholar]
- 175.Berglin M, Hedlund J, Fant C, Elwing H. J Adhes. 2005;81:805–822. [Google Scholar]
- 176.Gao Z, Bremer PJ, Barker ME, Tan EW, McQuillan A. J Appl Spectrosc. 2007;61:55–59. doi: 10.1366/000370207779701398. [DOI] [PubMed] [Google Scholar]
- 177.Olivieri MP, Rittle KH, Tweeden KS, Loomis RE. Biomaterials. 1992;13:201–208. doi: 10.1016/0142-9612(92)90185-q. [DOI] [PubMed] [Google Scholar]
- 178.Yamamoto H, Ogawa T, Ohkawa K. J Colloid Interf Sci. 1995;176:111–116. [Google Scholar]
- 179.Baty AM, Suci PA, Tyler BJ, Geesey GG. J Colloid Interf Sci. 1995;177:307–315. [Google Scholar]
- 180.Baty AM, Leavitt PK, Siedlecki CA, Tyler BA, Suci PA, Marchant RE, Geesey GG. Langmuir. 1997;13:5702–5710. [Google Scholar]
- 181.Frank BP, Belfort G. Langmuir. 2001;17:1905–1912. [Google Scholar]
- 182.Suci PA, Geesey GG. Langmuir. 2001;17:2838–2540. [Google Scholar]