Abstract
The mammalian APOBEC3 proteins are an important component of the cellular innate immune response to retroviral infection. APOBEC3G can extinguish HIV-1 infectivity by its incorporation into virus particles and subsequent cytosine deaminase activity that attacks the nascent viral cDNA during reverse transcription, causing lethal mutagenesis. It has been suggested, but not formally shown, that APOBEC3G can also induce sublethal mutagenesis, which would maintain virus infectivity and contribute to HIV-1 variation. To test this, we developed a novel model system utilizing an HIV-1 vector and a panel of APOBEC3G-expressing cells. We observed proviruses with single APOBEC3G-mediated mutations (in the presence or absence of Vif), occurring at distinct hot spots and which could be rescued and shown to have infectivity. These data indicate that APOBEC3G-dependent restriction of HIV-1 can result in viable viral progeny that harbor sublethal levels of G-to-A mutations. Such mutations have the potential to contribute significantly to HIV-1 evolution, pathogenesis, immune escape, and drug resistance.
HIV-1 variation is the primary cause behind the difficulty in developing an AIDS vaccine and why resistance to antiretroviral therapies can occur. HIV-1 variation is compounded by the fact that the virus has a high replication rate and a large population size. HIV-1 variation itself is due to several factors, including RNA polymerase II transcription errors (35, 45), minus- and plus-strand reverse transcription mistakes, and potentially direct contributions from cellular APOBEC3 (A3) proteins (34, 36). Nucleoside triphosphates and deoxynucleoside triphosphate (dNTP) levels also have direct effects on polymerase fidelities (2, 23). However, reverse transcription-dependent mutations are still generally regarded as the single largest source of HIV-1 variation.
The seven human A3 proteins, A3A to -H, are DNA cytosine deaminases that have the capacity to cause retroviral and retrotransposon guanine-to-adenine (G-to-A) hypermutations (reviewed in references 9, 13, and 29). APOBEC3G (A3G) is the best-studied member of the family. A3G has the capacity to specifically incorporate into HIV-1 particles, and Vif limits A3G virion incorporation via E3-mediated ubiquitination and degradation (7, 15, 39). During reverse transcription, A3G can deaminate viral cDNA cytosines to uracils (C to U). The completion of reverse transcription fixes these DNA lesions as genomic strand G-to-A mutations. Many studies have reported G-to-A mutations in patient-derived proviral DNA sequences, often occurring within the A3G 5′-GG-to-AG dinucleotide contexts (minus strand, 5′-CC-to-CU). These observations stand as the best indirect evidence that A3G can mutate HIV-1 in vivo, despite the fact that the viral auxiliary protein Vif can prevent A3G encapsidation by triggering its degradation.
Numerous studies have documented A3G-dependent HIV-1 hypermutation (for example, see references 18, 30, and 44). The sheer number of G-to-A mutations (often over 5% of the Gs) and the fact that these often result in stop codons, such as the tryptophan codon TGG mutating to TAG, TAA, or TGA) suggest that A3G may invariably lead to lethal mutagenesis of HIV-1 (an all-or-none model). However, on a larger population level, it is difficult to imagine that encapsidated A3G always leads to lethal levels of mutation. For instance, we have shown in long-term cell culture experiments that HIV-1 can evolve independently of Vif to tolerate high levels of A3G and that these viral isolates accumulate 10-fold more G-to-A changes per kilobase of proviral DNA than wild-type viruses (17). Here, we performed experiments to directly test an alternative hypothesis, that A3G encounters can also lead to sublethal levels of G-to-A mutations in HIV-1 (16). A panel of cell lines was established to express a 250-fold range of A3G, and we examined the infectivity and G-to-A mutation profiles of Vif+ and Vif− HIV-1. We observed (i) G-to-A mutations in the presence and absence of Vif, (ii) G-to-A mutations in distinct hot spot motifs, and (iii) G-to-A mutations at some of the same A3G-dependent hot spots in infectious viruses. These data indicate that A3G-mediated restriction of HIV-1 can result in replication-proficient viral progeny that contain sublethal levels of G-to-A mutations. It is possible that analogous A3G-dependent mutations contribute to HIV-1 variation in vivo.
MATERIALS AND METHODS
Plasmids.
An HIV-1 expression vector, pNL4-3.HSA.R+.E-, was obtained through the AIDS Research and Reference Reagent Program, Division of AIDS, NIAID, NIH, from Nathaniel Landau (10, 22). This construct does not express the envelope protein due to a frameshift and has the murine heat-stable antigen CD24 (HSA) inserted into the nef gene. An internal ribosome entry site (IRES)-enhanced green fluorescent protein (GFP) sequence was cloned directly after the HSA gene into the XhoI restriction site. The resulting plasmid was named pHIG, for the HSA-IRES-GFP vector cassette encoded by the resulting HIV vector. A Vif− version of this plasmid was constructed by deleting nucleotides 263 and 264 in Vif, resulting in a frameshift mutation. The G protein of vesicular stomatitis virus (VSV-G) envelope expression plasmid HCM-VG was used to pseudotype virions and was a kind gift from J. Burns (UCSD).
Cells.
Stable A3G-expressing cell lines were created by transfecting 293 cells with pRH702 (pcDNA3.1+-A3G-3×HA), selecting via G418 resistance, and screening for clones expressing A3G. Cells were maintained in Dulbecco's modified Eagle's medium (DMEM) with 10% FetalClone 3 (FC3; HyClone), 1% penicillin-streptomycin (Invitrogen), and 225 μg/ml G418 (original selection in 900 μg/ml). CEM-GFP cells were obtained through the AIDS Research and Reference Reagent Program from Jacques Corbeil and were maintained in RPMI medium with 10% FC3, 1% penicillin-streptomycin, and 500 μg/ml G418 (12). CEM and CEM-SS cells were a kind gift from Michael Malim. Peripheral blood mononuclear cells (PBMCs) were isolated from whole blood obtained from Memorial Blood Center (St. Paul, MN) using the Ficoll-Paque Plus reagent (Amersham Biosciences).
Transfections and infections.
Cells were transfected using the calcium phosphate method as previously described (11). Medium was changed 18 h later by adding DMEM with 10% FC3, 1% penicillin-streptomycin, and 20 mM HEPES. Twenty-four hours after this medium change, viral supernatants were harvested and passed through 0.2-μm filters. CEM-GFP cells were infected by adding 100 μl of viral supernatant with 2 μg/ml Polybrene. Eighteen hours postinfection, the medium was replaced with fresh medium, and the cells were incubated for an additional 48 h prior to harvesting. An HIV-1 capsid (p24) protein enzyme-linked immmunosorbent assay (ELISA) was conducted to normalize p24 levels used for infection with the remaining viral supernatant.
Flow cytometry.
Flow cytometry was used to detect viral infectivity (via GFP expression) and mutations (via lack of expression of the HSA reporter gene). To stain for HSA expression, infected cells were centrifuged and the cell pellet was resuspended in phosphate-buffered saline (PBS) with R-phycoerythin-conjugated anti-CD24 monoclonal antibody (BD Pharmingen). Following a 15-min incubation, cells were centrifuged and resuspended in PBS with 2% HyClone FC3 from Thermo Scientific and Alexa Fluor 647 goat anti-rat IgG (Invitrogen). After a second 15-min incubation, cells were pelleted and resuspended in PBS with 1% FC3 and 1% paraformaldehyde. A minimum of 10,000 gated cells were analyzed per sample using a BD FACScan flow cytometer (BD Biosciences).
HIV-1 capsid (p24) ELISA.
To normalize the infection data by the amount of virus added, a p24 ELISA protocol was performed on the viral supernatants. An overnight incubation of rabbit HIV-1sf2 p24 antiserum from the AIDS Research and Reference Reagent Program was used to coat the plates. The plates were then washed with PBST (PBS with 0.5% Tween 20) and blocked with 3% milk in PBST for 1 h. During this step, viral supernatants were mixed with PBS plus 0.1% Empigen and incubated at 56°C for 30 min. Viral samples and a protein standard obtained from the AIDS Research and Reference Reagent Program and HIV-1 SF2 p55 Gag from Chiron Corporation and the Division of AIDS, NIAID, were added, and the plate was incubated at 37°C for 1 h. After washing with PBST, HIV-1 p24 mouse monoclonal antibody from the AIDS Research and Reference Reagent Program through Bruce Chesebro and Kathy Wehrly was added with 1% milk (8, 40, 42). The plate was then incubated for 1 h at room temperature. After washing with PBST, anti-mouse IgG-peroxidase (Roche) in 1% milk was added and the plate was incubated for 30 min. This was followed by washes with PBST and washes with PBS. To develop the plates, 3,3′,5,5′-tetramethylbenzidine (TMB) was added to each well. This reaction was stopped with 1 M sulfuric acid, and the absorbance of the plates was then read at 450 nm.
Immunoblot analysis.
A3G expression in stably transfected 293 cells was determined by immunoblot analysis. Briefly, cell lysates were run on an SDS-PAGE gel and transferred to nitrocellulose. Anti-hemagglutinin (HA) antibodies (Covance) were used to detect A3G-HA levels, and detection of tubulin (antibody from Sigma) was used as a loading control with an anti-mouse IgG-peroxidase secondary antibody from Roche. A3G in primary cells was detected using an anti-A3G antibody obtained from the NIH AIDS Research and Reference Reagent Program via Jaisri Lingappa, and anti-rabbit Ig horseradish peroxidase-linked whole antibody (Amersham Biosciences) was used as the secondary antibody.
Isolation of proviral DNA.
CEM-GFP cells infected with single-round replication-competent virus were sorted at the University of Minnesota's Masonic Cancer Center on a FACSAria cell sorter. The HSA−/GFP+ population of cells was sorted into a new tube containing PBS with 2% FC3. An average of 7,000 to 14,000 cells per sample was collected. The cells were then transferred to 1.5-ml tubes, and 75,000 uninfected carrier cells were added. The samples were then centrifuged at 200 × g for 5 min, the supernatant was removed, and the cell pellets were resuspended in PBS. The Roche High Pure PCR template preparation kit was then used to isolate genomic and integrated proviral DNA.
Mutation detection in the HSA target gene from recovered proviral DNAs.
A nested PCR primer set was used to amplify the HSA target gene region in proviral DNAs recovered from infected cells. The outer primers used were +NL4-3 8400-20, GGCCCGAAGGAATAGAAGAAG, and −NL4-3 9000-20, TGGTCTTAAAGGTACCTGAGG; the inside primers were +HSA, ACTTGCTCAATGCCACAGCC, and −HSA, CAAACGCACACCGGCCTTATT.
First-round PCR products were purified using the GenElute PCR clean-up kit (Sigma) according to the manufacturer's instructions. Second-round PCR products were immediately cloned into the pCR2.1 vector (Invitrogen) or pGEM-T (Promega). Products were then sequenced at the University of Minnesota's Biomedical Genomics Center.
Infectivity analysis of HIV-1 vector proviruses exposed to A3G.
To determine if A3G-mutated proviruses were still capable of a second round of replication (sublethally mutated), single-round replication-competent virus was produced as described above and 293T cells were infected. Forty-eight hours postinfection, excess virus was removed by washing with PBS. Cells were then transfected with HCM-VG to complement integrated proviruses still capable of replication. Supernatant containing second-round infectious progeny was then added to fresh 293T cells and incubated for 24 h. Following a medium change, the cells were incubated for an additional 24 h prior to extracting genomic/proviral DNA as described above. Digestion with a restriction enzyme (SmaI) was performed prior to the first round of PCR to enrich for mutated sequences as described previously (20).
RESULTS
A3G expression levels correlate with virus infectivity.
Several studies have reported a dose-dependent relationship between A3G levels, virus infectivity, and hypermutation loads (18, 24, 32, 33, 43). We used this work as a foundation to establish a system to test for HIV-1 sublethal mutagenesis. We first constructed a panel of cell lines that stably express a range of A3G levels. Clonally expanded stable cell lines provide the benefit of near-homogeneous gene expression throughout the cell population and are better controlled and less variable than transient transfection.
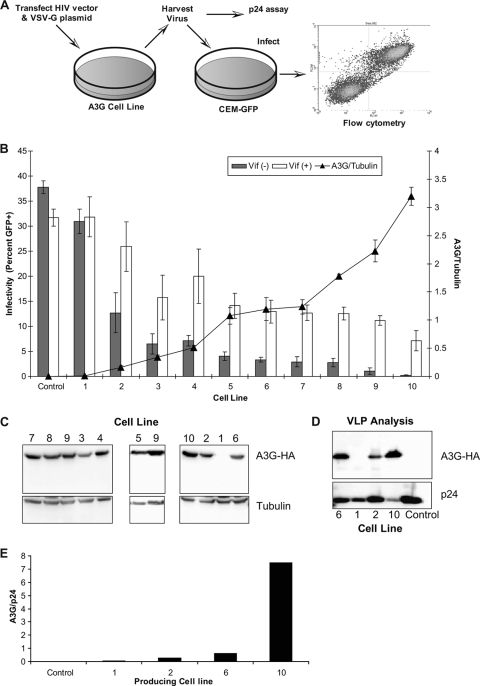
The A3G stable lines were used in a single replication cycle assay, depicted in Fig. 1A. This assay uses a vector virus with two reporter genes, HSA and GFP, which serve as markers for mutant frequency and infectivity, respectively. Figure 1B shows the results of these experiments, arranged in order from lowest expression to highest A3G expression, as determined by immunoblot analyses (Fig. 1C). Infectivity of both Vif+ HIV and Vif− HIV decreased as A3G levels in the producer cells increased, with an overall 4.4-fold decrease in intact HIV and a 200-fold decrease across the panel in Vif− HIV. Immunoblot analysis confirmed that levels of A3G packaged into viral particles correlated to expression levels of A3G in the stable cell lines (Fig. 1D and E).
FIG. 1.
Correlation of HIV-1 infectivity loss by increased APOBEC3G expression. (A) Single-round HIV-1 vector assay. Virus was generated by transfecting stable A3G-expressing cell lines (or 293T controls) with either Vif− or Vif+ HIV-1 vectors along with a VSV-G protein expression construct. Cell culture supernatants were collected, normalized for p24 levels, and then used to infect CEM-GFP cells. Infectivity was determined by flow cytometry as described in Materials and Methods. (B) Increased A3G expression levels reduce HIV-1 infectivity. A3G expression levels were determined for 10 stable cell lines and control 293T cells via immunoblot analysis. The mean infectivity of both Vif+ and Vif− vector virus produced from these cell lines is shown. The results are from three independent experiments and are shown as average values ± standard deviations. The histogram bars indicate the level of virus infectivity, based upon the percentage of GFP-expressing cells. The black triangles represent the relative level of A3G expression normalized to the expression level of tubulin. (C) Immunoblot of A3G-expressing cell lines summarized in panel B. Three immunoblots showing A3G-expressing cell lines 1 to 10 are shown (cell line 9 is repeated on two blots to show consistency). (D) Immunoblot analysis of HIV-1 particles. Vif− HIV-1 viral supernatants were purified and lysed, and A3G levels were determined by immunoblot analysis. A representative blot is shown. (E) Quantification of the immunoblot in panel D, normalized to p24 levels.
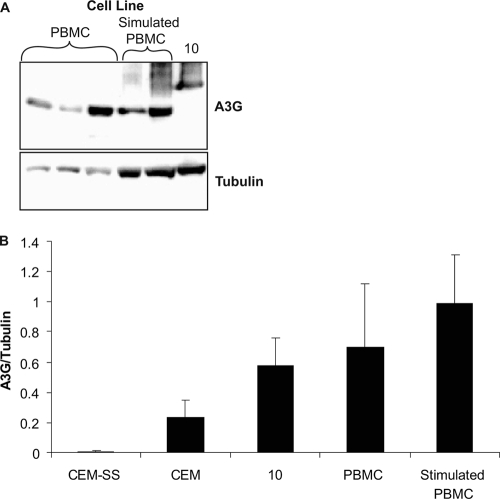
To determine if the stable cell line panel expressed A3G within a physiologically relevant range, the highest-expressing A3G cell line (i.e., cell line number 10) was compared to T-cell lines and PBMCs from multiple donors via Western blotting. As shown previously (38), the T-cell line CEM-SS did not express A3G at detectable levels, whereas CEM cells and PBMCs expressed levels of A3G similar (and not statistically different) to those of cell line number 10 (Fig. 2).
FIG. 2.
Comparison of A3G expression levels in stable cell lines to that of primary cells. (A) Representative immunoblot of A3G-expressing cell line 10 and stimulated and nonstimulated PBMCs. PBMCs were from three different donors. (B) Comparison of A3G expression levels in stable versus primary cells. Results are from three independent experiments, were normalized to tubulin, and are shown as average values ± standard deviations.
Mutant frequency and G-to-A point mutations correlate with A3G expression.
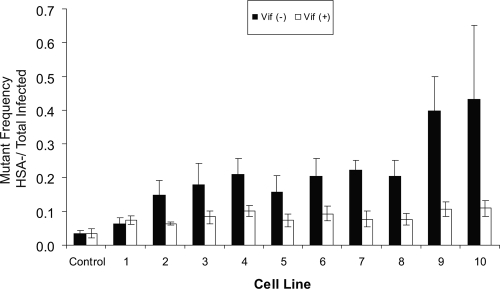
Since A3G produces G-to-A mutations in proviral DNA, we next examined if the expression level of A3G correlated with viral mutant frequency by using the single-cycle replication assay (Fig. 1). Mutant frequency was calculated by dividing the HSA−/GFP+ cells by the total number of GFP+ cells (i.e., mutant infected over total infected). This system scores for phenotypically HSA-negative mutants and is not a measure of total point mutations. Predictably, virus produced in the absence of Vif showed mutant frequencies that correlated with A3G expression levels (Fig. 3). In contrast, the Vif+ viruses did not show the same correlation and, interestingly, those expressed with any level of A3G had a modest 2-fold-higher mutant frequency than virus produced in the absence of A3G.
FIG. 3.
Mutant frequency analysis. The viral mutant frequency of vector virus produced from stable A3G-expressing cell lines is shown as the average of at least three separate experiments ± standard deviations. Expression levels of HSA and GFP in target cells were assayed by flow cytometry as described in Materials and Methods. Mutant frequency was calculated as follows: (HSA−/GFP+)/[(HSA−/GFP+) + (HSA+/GFP−) + (HSA+/GFP+)]. Data for both Vif− and Vif+ virus are shown.
The lack of direct correlation between the infectivity data in Fig. 1 and the mutant frequency data in Fig. 3 may be due to the HIV-1 reporter assay used, which relies upon HSA and GFP. As A3G expression increases, the likelihood of mutations eliminating expression of both markers increases. Such mutants and their infection events are not detected in the assay.
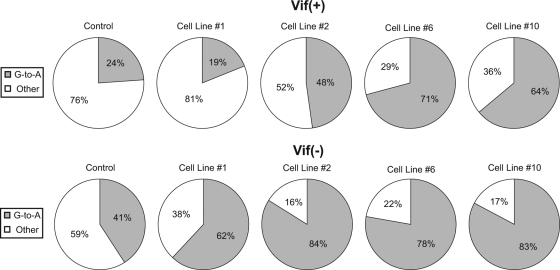
To determine if the increased mutant frequency is due to the cytidine deaminase activity of A3G, proviral DNA was isolated from HSA-negative target cells (i.e., HSA−/GFP+ infected cells). The HSA gene was amplified via nested PCR, cloned, and individually sequenced. Figure 4 shows that with increasing A3G levels in the producing cell line, a correlating increase in the percentage of G-to-A point mutations was observed, with the percentage reaching about 80% of the total point mutations. It is expected that at some mutational load, G-to-A mutations in the HSA gene of the HSA−/GFP+ population would be saturated, and beyond this point the mutational load would drive these viruses to the GFP−/HSA− cell population. Our data suggest that this occurred prior to cell line 6 in either the presence or absence of Vif, due to the saturation of G-to-A mutations at 80%. In proviruses produced from control 293T cells, G-to-A point mutations represented 40% of total mutations in Vif− provirus and 23% of the mutations in Vif+ provirus. The 40% G-to-A levels are similar to what has been previously reported and are attributed to G-to-A mutations likely generated by HIV-1 reverse transcriptase (1, 31, 41). It is unlikely that the G-to-A mutations in the proviruses produced from 293T cells are due to A3G (or any other APOBEC), since they were found at random locations not associated with the A3G hot spots. Vif has been shown to interact with reverse transcriptase (RT) during reverse transcription (5, 6, 25) and may explain the difference between the Vif+ and the Vif− controls. To account for the possible differences in the baseline mutant spectrum, Vif+ and Vif− proviruses exposed to A3G were compared to the corresponding Vif− or Vif+ controls.
FIG. 4.
G-to-A mutations in the HSA reporter gene. Stable A3G-expressing cell lines representing the low, middle, and high levels of expression were used. The percentages of G-to-A point mutations in the HSA gene (out of the total number of point mutations) for both Vif− and Vif+ virus are shown. Results are from three independent experiments, and identical sequences from the same PCR analysis were counted only once.
Identification of shared A3G hot spots in Vif+ and Vif− provirus.
Given that the expression of A3G correlated with an increase in the percentage of G-to-A mutations, we next examined whether A3G expression correlated with mutational load. In Fig. 5A, the total number of point mutations per individual 457-bp HSA sequence region was determined for Vif+ HIV. The mean number of point mutations in the control 293T cell line was 1.31, with a range of 1 to 3 mutations per sequence. This number reflects APOBEC3-independent mutations as well as those attributable to PCR and cloning. Although the average number of point mutations increased to near 2 (1.74, 1.71, 2.33, and 1.72) with as many as four point mutations identified in sequences from virus produced in the presence of A3G, this increase was not statistically different from the control.
FIG. 5.
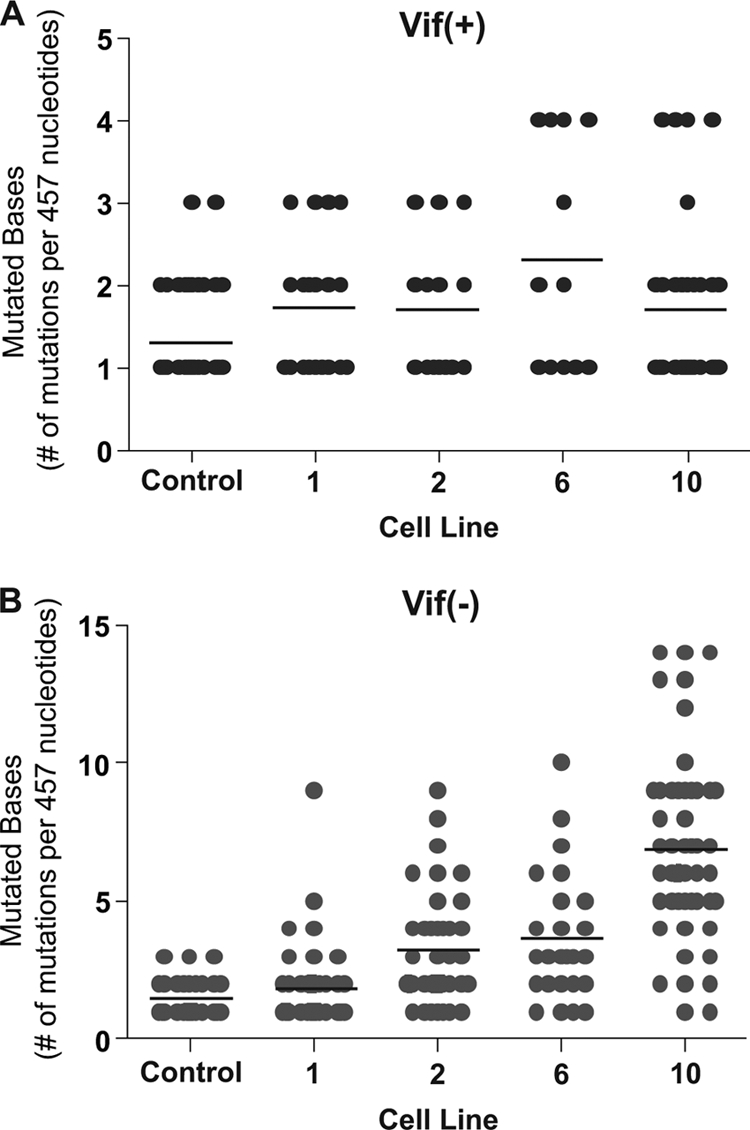
Analysis of mutational load. The total number of point mutations per sequence from Vif + vector proviruses (A) or from Vif − vector proviruses (B) was determined in the HSA reporter gene region. Individual sequences are represented as filled gray circles. The black horizontal bar represents the average number of mutations identified per sequence. The data are a summary of sequence data of at least 50 independent proviral sequences from each cell line and from a total of three independent experiments. Identical mutants from the same PCR were only counted once.
However, with Vif− HIV there was a statistically significant difference between the control (mean, 1.47 mutations per sequence; range, 1 to 3) and the A3G-exposed viruses (low-end mean, 1.87 mutations per sequence, and range, 1 to 9; high-end mean, 6.90 mutations per sequence, and range, 1 to 14) (Fig. 5B). Also, the average number of mutations per sequence increased as the amount of A3G in the producing cell line increased. Interestingly, some sequences contained as few as one mutation even under conditions of higher A3G expression or a Vif− viral background. This suggests that some proviruses may have been sublethally attacked. Many wild-type sequences are likely present in the HSA+/GFP+ cell population; however, one mutation was the lowest level identified, since we excluded wild-type provirus by sequencing the HSA− population only. By sequencing the HSA− population, this assay identifies mutations that result in a phenotypic loss of HSA. However, since the majority of mutant sequences analyzed contained more than one mutation, our data set likely includes many silent mutations as well.
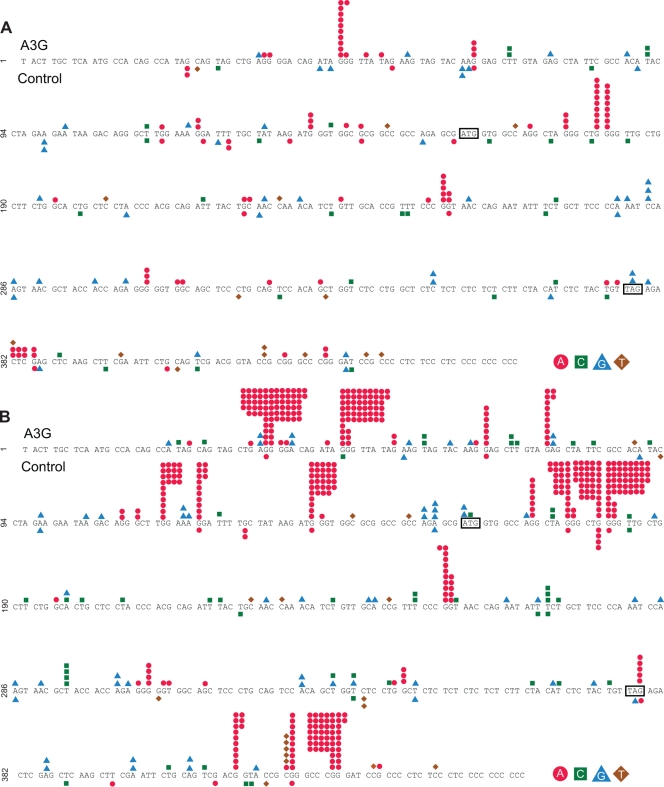
The locations of each point mutation for Vif+ HIV (Fig. 6A) and Vif− HIV (Fig. 6B) proviruses from the HSA region sequencing were analyzed. Multiple bases were identified that had more than five G-to-A point mutations when virus was produced from different A3G-expressing cell lines, and these were defined as hot spots. No mutation hot spots were observed in virus produced from the control 293T cells. Hot spots identified in Vif− provirus had as many as 54 individual point mutations occurring at the same site, while the greatest number quantified for the Vif+ provirus in this study was 11. Importantly, most of the hot spots were detected in both Vif− and Vif+ proviruses, with the Vif+ provirus mutated to an overall lesser extent. This result is consistent with partial protection by Vif (i.e., sublethal mutation). A total of 17 hot spots were identified in the 457-bp sequenced region. There were a total of 35 GG dinucleotides in the sequenced region, and thus 43% were A3G hot spots, while 57% (20 sites) were not mutated or were mutated less than five times.
FIG. 6.
G-to-A mutation locations in the HSA reporter gene region. Mutation locations are shown for Vif + vector viruses (A) and Vif − vector viruses (B). The start and stop codons of the HSA gene are indicated by sequences in boxes. Mutations observed in proviruses that were from infections of virus produced from A3G-expressing cell lines are shown above the sequence, while mutations in proviruses from infections of virus stocks made in the absence of A3G are shown below the sequence. Individual mutations are represented as colored dots.
A3G-mutated proviruses are replication proficient: direct evidence for sublethal mutation.
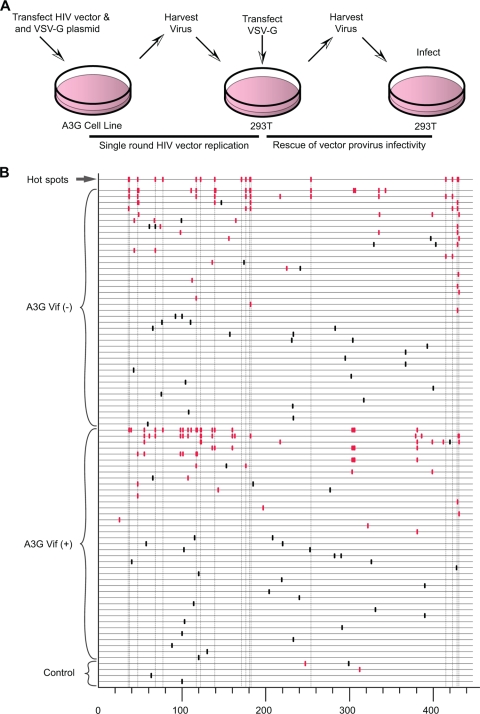
Sequences carrying as few as a single point mutation were identified across all A3G lines examined in detail, providing one line of evidence for A3G's ability to cause sublethal levels of mutation in the HIV-1 genome. To further investigate the ability of A3G to cause HIV-1 sublethal mutagenesis, we examined whether the mutated viruses were able to produce infectious progeny. Figure 7A shows the protocol used to generate virus capable of a second round of replication. As previously described, single-cycle replication-competent virus was produced from either 293T cells or from the stable A3G-expressing cell lines. Stock 293T cells were infected with the single-round virus, after which they were transfected with the VSV-G expression plasmid. This would effectively rescue the env− provirus and allow viable proviruses to produce progeny capable of a second round of infection. The second-round virus was then harvested and fresh 293T cells were infected. Proviral sequences were amplified to determine if any viable progeny carried G-to-A mutations at previously determined A3G hot spots. The sequence data generated from these experiments are shown in Fig. 7B. Viable viruses carrying single mutations at A3G hot spots were identified in multiple sequences. As expected, sequences containing other diverse single-nucleotide substitutions were also observed. Interestingly, multiple mutations at GG or GA dinucleotides were also identified in individual second round viral sequences, suggesting a complex spectrum of viable A3G mutations is present in this system. The most likely source of most of the G-to-A mutations, especially those clustered within a single sequence, is concentrated point mutations via APOBEC3G activity. Another conceivable source is the possibility of recombination between a lethally A3G-restricted provirus and a viable provirus from a coinfected target cell.
FIG. 7.
Rescue of HIV-1 vector infectivity after exposure to A3G. (A) Experimental protocol. Single-round replication-competent virus was generated as described in Materials and Methods and used to infect 293T cells. These cells were then transiently transfected with a VSV-G protein expression plasmid, and the cell culture supernatants were collected and used to infect fresh 293T cells. (B) Sequence analysis of the HSA reporter gene region from vector proviruses following the second round of viral replication. Individual sequences are displayed as horizontal lines. Eighty-three sequences with mutations are shown. The vertical dashes indicate mutation locations along the HSA gene sequence, as generated by the Hypermut program. Red vertical dashes represent G-to-A mutations, and black dashes represent all other point mutations. The first sequence line indicates the locations of all identified G-to-A hot spots from Fig. 6.
DISCUSSION
In this study, we investigated whether A3G is able to contribute to HIV-1 variation by sublethal mutation. To quantify the effects of A3G on HIV replication and genetic diversity, we used single-cycle env− HIV-1 produced from cell lines that stably expressed A3G at near-physiologic levels. A3G hot spots were identified and were identical within Vif + and Vif − viruses. These data strongly indicate that A3G can cause sublethal levels of G-to-A mutation in Vif+ viruses.
In addition to A3G-catalyzed editing, there are clearly other sources of G-to-A mutations in the HIV-1 replication cycle. This is evident in the virus produced in the absence of A3G, which had G-to-A transition mutations scattered among many sites (Fig. 6). These mutations were likely due to mistakes made during reverse transcription (31), although cellular RNA polymerase II may also cause a minor fraction (35, 45). Moreover, both RT and RNA polymerase II are clearly influenced by cellular dNTP concentrations (41).
In addition to deaminase-dependent G-to-A mutational activity, A3G can inhibit HIV-1 RT (3, 14), tRNA annealing or processing (15, 32), integration (28, 32), and/or DNA strand transfer (27, 32). The role of these alternative activities in preventing HIV-1 pathogenesis is still under investigation. However, regardless of these other potential functions, our data clearly support the role of cytosine deaminase activity as a major factor in diminishing viral infectivity by G-to-A hypermutation, which has been directly addressed elsewhere (4, 19, 33, 37). The mutational load in the HSA gene ranged from single base mutations to hypermutation (multiple G-to-A changes within the same sequence). A rescue experiment was done to determine if HIV could sustain an attack by A3G and maintain infectivity (Fig. 7). We found evidence of single and multiple G-to-A mutations at A3G hot spots that correlated with A3G exposure during the first round of vector virus replication. This was observed across a range of A3G expression levels and in the presence or absence of Vif. While other studies have shown the presence of A3G-mediated mutations in Vif− virus, their infectivity was not determined (34, 36).
Two models can be proposed to explain the hypermutated sequences identified in Fig. 7. First, the hypermutated sequences could have been introduced into the proviral sequence via recombination. A recent study showed that recombination could rescue hypermutated viral sequences and accelerate the rate of developing drug resistance (34, 36). Second, A3G may be processive in concentrated regions, such as the HSA reporter gene, which is located near the polypurine tract. This viral DNA region remains single stranded for a longer period of time during viral DNA synthesis. It has been proposed that A3G acts on particular areas of the DNA, which are flanked by regions which cause A3G to disengage (4). Also, in patients with predominantly hypermutated env sequences, vif was found to be largely normal, further suggesting that different sections of the viruses may be differentially susceptible to hypermutation (26). Nucleotide sequencing of larger regions of viable proviruses in our study may help provide further insight into the origins of the hypermutated genomes.
Computational modeling supports the ability of A3G to cause sublethal mutations (21). This is in contrast to reports that have suggested essentially an all-or-none model, whereby a single molecule (3) or dimer (4) of A3G causes hypermutation and loss of infectivity. The average A3G incorporation into Vif− virions produced from PBMCs is thought to be 7 ± 4 (mean ± standard deviation) molecules (with an A3G/Gag ratio of 1:439), a level known to extinguish replicating Vif− HIV-1 (43). Our results indicate that there is a wide range of mutational potential within a single HIV-1 replication cycle, such that all virions produced in the presence of A3G do not contain identical mutational loads. This suggests that either there is a range of A3G molecules incorporated per particle and/or that the A3G mutation efficiency differs in target cells during individual infection events. In summary, our data provide support for A3G-mediated sublethal mutagenesis of HIV-1. Further studies will be needed to evaluate the impact of sublethal mutagenesis on HIV-1 evolution, pathogenesis, drug resistance, and immune evasion.
Acknowledgments
We thank Christine Clouser for helpful comments on the manuscript and Brady Swanson for assisting with figures.
M.D.S. was supported in part by a 3M Graduate Fellowship and a Cancer Biology Training Grant (CA009138). This work was supported by grants from the National Institutes of Health, GM084797 (to L.M.M.) and AI064046 (to R.S.H.).
Footnotes
Published ahead of print on 12 May 2010.
REFERENCES
- 1.Bebenek, K., J. Abbotts, J. D. Roberts, S. H. Wilson, and T. A. Kunkel. 1989. Specificity and mechanism of error-prone replication by human immunodeficiency virus-1 reverse transcriptase. J. Biol. Chem. 264:16948-16956. [PubMed] [Google Scholar]
- 2.Bebenek, K., J. D. Roberts, and T. A. Kunkel. 1992. The effects of dNTP pool imbalances on frameshift fidelity during DNA replication. J. Biol. Chem. 267:3589-3596. [PubMed] [Google Scholar]
- 3.Bishop, K. N., M. Verma, E. Y. Kim, S. M. Wolinsky, and M. H. Malim. 2008. APOBEC3G inhibits elongation of HIV-1 reverse transcripts. PLoS Pathog. 4:e1000231. [DOI] [PMC free article] [PubMed] [Google Scholar]
- 4.Browne, E. P., C. Allers, and N. R. Landau. 2009. Restriction of HIV-1 by APOBEC3G is cytidine deaminase-dependent. Virology 387:313-321. [DOI] [PMC free article] [PubMed] [Google Scholar]
- 5.Cancio, R., S. Spadari, and G. Maga. 2004. Vif is an auxiliary factor of the HIV-1 reverse transcriptase and facilitates abasic site bypass. Biochem. J. 383:475-482. [DOI] [PMC free article] [PubMed] [Google Scholar]
- 6.Carr, J. M., C. Coolen, A. J. Davis, C. J. Burrell, and P. Li. 2008. Human immunodeficiency virus 1 (HIV-1) virion infectivity factor (Vif) is part of reverse transcription complexes and acts as an accessory factor for reverse transcription. Virology 372:147-156. [DOI] [PubMed] [Google Scholar]
- 7.Cen, S., F. Guo, M. Niu, J. Saadatmand, J. Deflassieux, and L. Kleiman. 2004. The interaction between HIV-1 Gag and APOBEC3G. J. Biol. Chem. 279:33177-33184. [DOI] [PubMed] [Google Scholar]
- 8.Chesebro, B., K. Wehrly, J. Nishio, and S. Perryman. 1992. Macrophage-tropic human immunodeficiency virus isolates from different patients exhibit unusual V3 envelope sequence homogeneity in comparison with T-cell-tropic isolates: definition of critical amino acids involved in cell tropism. J. Virol. 66:6547-6554. [DOI] [PMC free article] [PubMed] [Google Scholar]
- 9.Chiu, Y. L., and W. C. Greene. 2008. The APOBEC3 cytidine deaminases: an innate defensive network opposing exogenous retroviruses and endogenous retroelements. Annu. Rev. Immunol. 26:317-353. [DOI] [PubMed] [Google Scholar]
- 10.Connor, R. I., B. K. Chen, S. Choe, and N. R. Landau. 1995. Vpr is required for efficient replication of human immunodeficiency virus type-1 in mononuclear phagocytes. Virology 206:935-944. [DOI] [PubMed] [Google Scholar]
- 11.Dorweiler, I. J., S. J. Ruone, H. Wang, R. W. Burry, and L. M. Mansky. 2006. Role of the human T-cell leukemia virus type 1 PTAP motif in Gag targeting and particle release. J. Virol. 80:3634-3643. [DOI] [PMC free article] [PubMed] [Google Scholar]
- 12.Gervaix, A., D. West, L. M. Leoni, D. D. Richmond, F. Wong-Staal, and J. Corbeil. 1997. A new reporter cell line to monitor HIV infection and drug susceptibility in vitro. Proc. Natl. Acad. Sci. U. S. A. 94:4653-4658. [DOI] [PMC free article] [PubMed] [Google Scholar]
- 13.Goila-Gaur, R., and K. Strebel. 2008. HIV-1 Vif, APOBEC, and intrinsic immunity. Retrovirology 5:51. [DOI] [PMC free article] [PubMed] [Google Scholar]
- 14.Guo, F., S. Cen, M. Niu, J. Saadatmand, and L. Kleiman. 2006. Inhibition of formula-primed reverse transcription by human APOBEC3G during human immunodeficiency virus type 1 replication. J. Virol. 80:11710-11722. [DOI] [PMC free article] [PubMed] [Google Scholar]
- 15.Guo, F., S. Cen, M. Niu, Y. Yang, R. J. Gorelick, and L. Kleiman. 2007. The interaction of APOBEC3G with human immunodeficiency virus type 1 nucleocapsid inhibits tRNA3Lys annealing to viral RNA. J. Virol. 81:11322-11331. [DOI] [PMC free article] [PubMed] [Google Scholar]
- 16.Hache, G., L. M. Mansky, and R. S. Harris. 2006. Human APOBEC3 proteins, retrovirus restriction, and HIV drug resistance. AIDS Rev. 8:148-157. [PubMed] [Google Scholar]
- 17.Hache, G., K. Shindo, J. S. Albin, and R. S. Harris. 2008. Evolution of HIV-1 isolates that use a novel Vif-independent mechanism to resist restriction by human APOBEC3G. Curr. Biol. 18:819-824. [DOI] [PMC free article] [PubMed] [Google Scholar]
- 18.Harris, R. S., K. N. Bishop, A. M. Sheehy, H. M. Craig, S. K. Petersen-Mahrt, I. N. Watt, M. S. Neuberger, and M. H. Malim. 2003. DNA deamination mediates innate immunity to retroviral infection. Cell 113:803-809. [DOI] [PubMed] [Google Scholar]
- 19.Holmes, R. K., F. A. Koning, K. N. Bishop, and M. H. Malim. 2007. APOBEC3F can inhibit the accumulation of HIV-1 reverse transcription products in the absence of hypermutation. Comparisons with APOBEC3G. J. Biol. Chem. 282:2587-2595. [DOI] [PubMed] [Google Scholar]
- 20.Janini, M., M. Rogers, D. R. Birx, and F. E. McCutchan. 2001. Human immunodeficiency virus type 1 DNA sequences genetically damaged by hypermutation are often abundant in patient peripheral blood mononuclear cells and may be generated during near-simultaneous infection and activation of CD4(+) T cells. J. Virol. 75:7973-7986. [DOI] [PMC free article] [PubMed] [Google Scholar]
- 21.Jern, P., R. A. Russell, V. K. Pathak, and J. M. Coffin. 2009. Likely role of APOBEC3G-mediated G-to-A mutations in HIV-1 evolution and drug resistance. PLoS Pathog. 5:e1000367. [DOI] [PMC free article] [PubMed] [Google Scholar]
- 22.Jianglin He, S. C., R. Walker, P. Di Marzio, D. O. Morgan, and A. N. R. Landau. 1995. Human immunodeficiency virus type 1 viral protein R (Vpr) arrests cells in the G2 phase of the cell cycle by inhibiting p34cdc2 activity. J. Virol. 69:6705-6711. [DOI] [PMC free article] [PubMed] [Google Scholar]
- 23.Julias, J. G., and V. K. Pathak. 1998. Deoxyribonucleoside triphosphate pool imbalances in vivo are associated with an increased retroviral mutation rate. J. Virol. 72:7941-7949. [DOI] [PMC free article] [PubMed] [Google Scholar]
- 24.Kao, S., M. A. Khan, E. Miyagi, R. Plishka, A. Buckler-White, and K. Strebel. 2003. The human immunodeficiency virus type 1 Vif protein reduces intracellular expression and inhibits packaging of APOBEC3G (CEM15), a cellular inhibitor of virus infectivity. J. Virol. 77:11398-11407. [DOI] [PMC free article] [PubMed] [Google Scholar]
- 25.Kataropoulou, A., C. Bovolenta, A. Belfiore, S. Trabatti, A. Garbelli, S. Porcellini, R. Lupo, and G. Maga. 2009. Mutational analysis of the HIV-1 auxiliary protein Vif identifies independent domains important for the physical and functional interaction with HIV-1 reverse transcriptase. Nucleic Acids Res. 37:3660-3669. [DOI] [PMC free article] [PubMed] [Google Scholar]
- 26.Land, A. M., T. B. Ball, M. Luo, R. Pilon, P. Sandstrom, J. E. Embree, C. Wachihi, J. Kimani, and F. A. Plummer. 2008. Human immunodeficiency virus (HIV) type 1 proviral hypermutation correlates with CD4 count in HIV-infected women from Kenya. J. Virol. 82:8172-8182. [DOI] [PMC free article] [PubMed] [Google Scholar]
- 27.Li, X. Y., F. Guo, L. Zhang, L. Kleiman, and S. Cen. 2007. APOBEC3G inhibits DNA strand transfer during HIV-1 reverse transcription. J. Biol. Chem. 282:32065-32074. [DOI] [PubMed] [Google Scholar]
- 28.Luo, K., T. Wang, B. Liu, C. Tian, Z. Xiao, J. Kappes, and X. F. Yu. 2007. Cytidine deaminases APOBEC3G and APOBEC3F interact with human immunodeficiency virus type 1 integrase and inhibit proviral DNA formation. J. Virol. 81:7238-7248. [DOI] [PMC free article] [PubMed] [Google Scholar]
- 29.Malim, M. H., and M. Emerman. 2008. HIV-1 accessory proteins: ensuring viral survival in a hostile environment. Cell Host Microbe 3:388-398. [DOI] [PubMed] [Google Scholar]
- 30.Mangeat, B., P. Turelli, G. Caron, M. Friedli, L. Perrin, and D. Trono. 2003. Broad antiretroviral defence by human APOBEC3G through lethal editing of nascent reverse transcripts. Nature 424:99-103. [DOI] [PubMed] [Google Scholar]
- 31.Mansky, L. M., and H. M. Temin. 1995. Lower in vivo mutation rate of human immunodeficiency virus type 1 than predicted from the fidelity of purified reverse transcriptase. J. Virol. 69:5087-5094. [DOI] [PMC free article] [PubMed] [Google Scholar]
- 32.Mbisa, J. L., R. Barr, J. A. Thomas, N. Vandegraaff, I. J. Dorweiler, E. S. Svarovskaia, W. L. Brown, L. M. Mansky, R. J. Gorelick, R. S. Harris, A. Engelman, and V. K. Pathak. 2007. Human immunodeficiency virus type 1 cDNAs produced in the presence of APOBEC3G exhibit defects in plus-strand DNA transfer and integration. J. Virol. 81:7099-7110. [DOI] [PMC free article] [PubMed] [Google Scholar]
- 33.Miyagi, E., S. Opi, H. Takeuchi, M. Khan, R. Goila-Gaur, S. Kao, and K. Strebel. 2007. Enzymatically active APOBEC3G is required for efficient inhibition of human immunodeficiency virus type 1. J. Virol. 81:13346-13353. [DOI] [PMC free article] [PubMed] [Google Scholar]
- 34.Mulder, L. C., A. Harari, and V. Simon. 2008. Cytidine deamination induced HIV-1 drug resistance. Proc. Natl. Acad. Sci. U. S. A. 105:5501-5506. [DOI] [PMC free article] [PubMed] [Google Scholar]
- 35.O'Neil, P. K., G. Sun, H. Yu, Y. Ron, J. P. Dougherty, and B. D. Preston. 2002. Mutational analysis of HIV-1 long terminal repeats to explore the relative contribution of reverse transcriptase and RNA polymerase II to viral mutagenesis. J. Biol. Chem. 277:38053-38061. [DOI] [PubMed] [Google Scholar]
- 36.Russell, R. A., M. D. Moore, W. S. Hu, and V. K. Pathak. 2009. APOBEC3G induces a hypermutation gradient: purifying selection at multiple steps during HIV-1 replication results in levels of G-to-A mutations that are high in DNA, intermediate in cellular viral RNA, and low in virion RNA. Retrovirology 6:16. [DOI] [PMC free article] [PubMed] [Google Scholar]
- 37.Schumacher, A. J., G. Hache, D. A. Macduff, W. L. Brown, and R. S. Harris. 2008. The DNA deaminase activity of human APOBEC3G is required for Ty1, MusD, and human immunodeficiency virus type 1 restriction. J. Virol. 82:2652-2660. [DOI] [PMC free article] [PubMed] [Google Scholar]
- 38.Sheehy, A. M., N. C. Gaddis, J. D. Choi, and M. H. Malim. 2002. Isolation of a human gene that inhibits HIV-1 infection and is suppressed by the viral Vif protein. Nature 418:646-650. [DOI] [PubMed] [Google Scholar]
- 39.Sheehy, A. M., N. C. Gaddis, and M. H. Malim. 2003. The antiretroviral enzyme APOBEC3G is degraded by the proteasome in response to HIV-1 Vif. Nat. Med. 9:1404-1407. [DOI] [PubMed] [Google Scholar]
- 40.Toohey, K., K. Wehrly, J. Nishio, S. Perryman, and B. Chesebro. 1995. Human immunodeficiency virus envelope V1 and V2 regions influence replication efficiency in macrophages by affecting virus spread. Virology 213:70-79. [DOI] [PubMed] [Google Scholar]
- 41.Vartanian, J.-P., A. Meyerhans, M. Sala, and S. Wain-Hobson. 1994. G-A hypermutation of the human immunodeficiency virus type 1 genome: evidence for dCTP pool imbalance during reverse transcription. Proc. Natl. Acad. Sci. U. S. A. 91:3092-3096. [DOI] [PMC free article] [PubMed] [Google Scholar]
- 42.Wehrly, K., and B. Chesebro. 1997. p24 antigen capture assay for quantification of human immunodeficiency virus using readily available inexpensive reagents. Methods 12:288-293. [DOI] [PubMed] [Google Scholar]
- 43.Xu, H., E. Chertova, J. Chen, D. E. Ott, J. D. Roser, W. S. Hu, and V. K. Pathak. 2007. Stoichiometry of the antiviral protein APOBEC3G in HIV-1 virions. Virology 360:247-256. [DOI] [PubMed] [Google Scholar]
- 44.Zhang, H., B. Yang, R. J. Pomerantz, C. Zhang, S. C. Arunachalam, and L. Gao. 2003. The cytidine deaminase CEM15 induces hypermutation in newly synthesized HIV-1 DNA. Nature 424:94-98. [DOI] [PMC free article] [PubMed] [Google Scholar]
- 45.Zhang, J., and D. M. Webb. 2004. Rapid evolution of primate antiviral enzyme APOBEC3G. Hum. Mol. Genet. 13:1785-1791. [DOI] [PubMed] [Google Scholar]


