Abstract
Saccharopine dehydrogenase catalyzes the NAD-dependent oxidative deamination of saccharopine to give l-lysine and α-ketoglutarate. There are a number of conserved hydrophilic, ionizable residues in the active site, all of which must be important to the overall reaction. In an attempt to determine the contribution to binding and rate enhancement of each of the residues in the active site, mutations at each residue are being made, and double mutants are being made to estimate the interrelationship between residues. Here, we report the effects of mutations of active site glutamate residues, Glu78 and Glu122, on reactant binding and catalysis. Site-directed mutagenesis was used to generate E78Q, E122Q, E78Q/E122Q, E78A, E122A, and E78A/E122A mutant enzymes. Mutation of these residues increases the positive charge of the active site and is expected to affect the pKa values of the catalytic groups. Each mutant enzyme was completely characterized with respect to its kinetic and chemical mechanism. The kinetic mechanism remains the same as that of wild type enzymes for all of the mutant enzymes, with the exception of E78A, which exhibits binding of α-ketoglutarate to E and E·NADH. Large changes in V/KLys, but not V, suggest that Glu78 and Glu122 contribute binding energy for lysine. Shifts of more than a pH unit to higher and lower pH of the pKa values observed in the V/KLys pH-rate profile of the mutant enzymes suggests that the presence of Glu78 and Glu122 modulates the basicity of the catalytic groups.
Keywords: Enzyme Catalysis, Enzyme Kinetics, Enzyme Mechanisms, Enzyme Mutation, Isotope Effects, Acid-Base Chemistry, Lysine Biosynthesis, Saccharopine Dehydrogenase
Introduction
The α-aminoadipate pathway for lysine biosynthesis is unique to fungi and euglenoids (1–3). Lysine is an essential amino acid for most organisms. Human pathogenic fungi, including Candida albicans, Aspergillus fumigatus, and Cryptococcus neoformans and the plant pathogen Magnaporthe grisea, use this pathway for lysine biosynthesis (4–6). Knocking out the LYS1 gene is lethal to the fungal cells, suggesting that selective inhibition of one or more enzymes may help to control or completely eradicate these pathogens in vivo (5, 7).
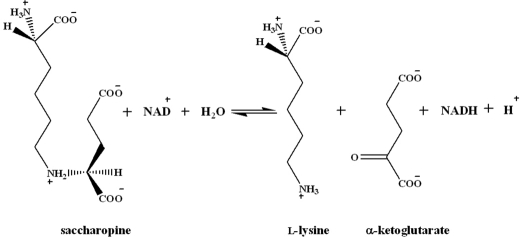
Saccharopine dehydrogenase (SDH)2 (N6-(glutaryl-2)-l-lysine:NAD oxidoreductase (l-lysine forming) (EC 1.5.1.7)) catalyzes the final step of the α-aminoadipate pathway, the reversible pyridine nucleotide-dependent oxidative deamination of saccharopine using NAD as the oxidizing agent, to produce α-ketoglutarate (α-Kg) and lysine (Scheme 1) (2). SDH from Saccharomyces cerevisiae is a monomer with a molecular mass of 41 kDa, with one active site (8).
SCHEME 1.
Reaction catalyzed by SDH.
On the basis of the pH dependence of the kinetic parameters (9), dissociation constants for the competitive inhibitors (1), and isotope effects (9), a chemical mechanism has been proposed for SDH (1, 10). In the direction of saccharopine oxidation, once NAD and saccharopine are bound, a group with a pKa of 6.2 accepts a proton from the secondary amine of saccharopine as it is oxidized. The imine of saccharopine is hydrolyzed via general base-catalyzed activation of a water molecule, via the intermediacy of carbinolamine intermediates. The base participating in the hydrolysis reaction has a pKa of 7.2. Finally, the ϵ-amine of lysine is protonated by the conjugate acid of the base with a pKa of 6.2, and products are released (1, 9, 10). Isotope effects suggest that hydride transfer and hydrolysis of the imine contribute to rate limitation (9).
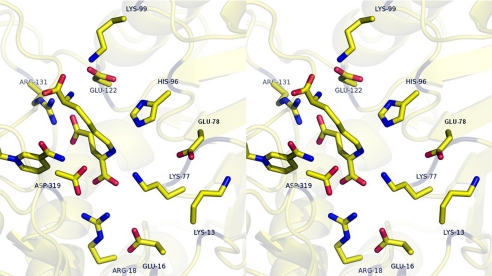
Structures of SDH have been solved in the apoenzyme form (11) and with either AMP or oxalylglycine (OG), analogues of NAD and α-Kg, bound (10). A semiempirical structure of the E·NAD·saccharopine ternary complex was generated on the basis of E·AMP and E·OG structures (Fig. 1) (10). Given the semiempirical nature of the model, the relative positions of reactants and active site groups are estimates, and the overall model represents an open form of the enzyme, e.g. the distance for hydride transfer from the Cα proton of the glutamyl moiety to the 4 position of the nicotinamide ring is 4.7 Å, much too long for hydride transfer. There are a number of ionizable residues in the active site, and a multiple sequence alignment of the SDH from C. albicans, Pichia guilliermondii, S. cerevisiae, A. fumigatus, and C. neoformans indicated that all are conserved in all five organisms, consistent with their importance in the mechanism. In the ternary complex, Arg131 and Arg18 are likely ion-paired to two of the carboxylates of saccharopine. In addition, however, there are three lysine residues, Lys99 in the vicinity of the α-carboxylate of saccharopine, Lys77 in the vicinity of the secondary amine of saccharopine, and Lys13 near Lys77; three glutamates, Glu122 near Lys99, Glu78 near Lys77 and Lys13, and Glu16 near Arg18; and an imidazole, His96. In the ternary complex, the nicotinamide ring of NAD is positively charged, but in the vicinity of Asp319, the secondary amine of saccharopine is positively charged given its pKa of about 10 (9). The active site is positively charged, and this will certainly affect the pKa values of all of the ionizable residues in the site.
FIGURE 1.
Stereoview of the E·NAD·saccharopine complex from a semiempirical model (10). The figure was obtained from the structures of SDH from S. cerevisiae with oxalylglycine bound (2QRL), and AMP bound (2QRK) (10). The nicotinamide ring of NAD is shown to the left of the figure near Asp319. The figure was constructed using PyMOL.
In this paper the role of Glu78 and Glu122 was studied by changing them to glutamine or alanine. Eliminating these negatively charged residues will increase the positive charge in the site and should affect the pKa values of the remaining residues, including the catalytic groups. In addition, previous studies suggest that there is a neutral acid in the vicinity of the secondary amine of saccharopine, and Glu78 and Glu122 are candidates for this residue (9). Mutant enzymes were characterized via the pH dependence of kinetic parameters and isotope effects. Data are discussed in terms of the proposed mechanism of SDH.
EXPERIMENTAL PROCEDURES
Materials
l-Saccharopine, l-lysine, α-Kg, ampicillin, chloramphenicol, phenylmethylsulfonyl fluoride, horse liver alcohol dehydrogenase, and bakers' yeast aldehyde dehydrogenase were obtained from Sigma. β-NADH, β-NAD, Luria-Bertani (LB) broth, LB-agar, and imidazole were purchased form U. S. Biochemical Corp. Ches, Hepes, Mes, Taps, Tris, and imidazole were from Research Organics. Ethanol-d6 (99% atom D) and D2O (99.9% atom D) were purchased from Cambridge Isotope Laboratories. Ethyl alcohol (absolute, anhydrous) was from Pharmaco-Aaper. Isopropyl-β-d-1-thiogalactopyranoside was from Invitrogen, and the GenElute plasmid miniprep kit was from Sigma. Ni-nitrilotriacetic acid (Ni-NTA)-agarose resin was from Qiagen. The QuikChange site-directed mutagenesis kit was from Stratagene, and the plasmid purification kit was from Sigma. Bradford reagent (protein assay dye reagent concentrate) was obtained from Bio-Rad. All chemicals were obtained commercially, were of the highest grade available and were used without further purification.
Site-directed Mutagenesis
Site-directed mutagenesis was performed using the plasmid sdhHX1, which contains the S. cerevisiae LYS1 gene (1), as a template to change Glu78 and Glu122 to Gln and Ala. The forward and reverse primers used to generate the E78Q, E122Q, E78A, and E122A are listed in the Table 1. Double mutant enzymes were prepared using the E78Q forward and reverse primers and the E122Q mutant gene to generate E78Q/E122Q, whereas E78A forward and reverse primers were used with the E122A mutant gene to generate E78A/E122A. The PCR procedure was as follows. The reaction mixtures were first heated to 94 °C for 1 min to activate the Pfu polymerase Turbo enzyme. Denaturation of double-stranded plasmid DNA was done at 94 °C for 1.5 min. Depending on the melting temperatures of the respective primers, annealing was set at 50–60 °C for 2 min. Extension of the new DNA was carried out at 68 °C for 8 min. The cycle was repeated 18 times, and completion of existing transcripts was done at 68 °C for 20 min. Original methylated plasmid was then digested using the DpnI restriction enzyme. The presence of the new plasmid was estimated by agarose gel electrophoresis, taking samples before and after addition of DpnI, from the PCR mixture. The XL-1-Blue competent cell strain of Escherichia coli was then transformed with the plasmids containing mutations. The transformed cells were grown overnight at 37 °C in LB medium supplemented with ampicillin, 100 μg/ml. Plasmids were isolated and purified using the GenElute plasmid minipreparation kit. The entire gene was then sequenced for all six mutations at the Sequencing Core of the Oklahoma Medical Research Foundation, Oklahoma City, OK.
TABLE 1.
DNA sequences of the forward and reverse PCR primers
| Primersa | DNA sequence from 5′ to 3′ |
|---|---|
| E78Q Forward | AGAATCATTATAGGTTTGAAGCAATGCCTGAAACCGATACTTTC |
| E78Q Reverse | GAAAGTATCGGTTTCAGGCATTGCTTCAAACCTATAATGATTCT |
| E122Q Forward | CGGTACTCTATATGATTTGCAATTTTTGGAAAATGACC |
| E122Q Reverse | GGTCATTTTCCAAAAATTGCAAATCATATAGAGTACCG |
| E78A Forward | CATTATAGGTTTGAAGCAAATGCCTGAAACCG |
| E78A Reverse | CGGTTTCAGGCATTTGCTTCAAACCTATAATG |
| E122A Forward | CACGGTACTCTATATGATTTGGCATTTTTGGAAAATGACCAAGGT |
| E122A Reverse | ACCTTGGTCATTTTCCAAAAATGCCAAATCATATAGAGTACCGTG |
a The mutated codon is indicated in bold letters.
Expression and Purification of Mutant Enzymes
E. coli BL21 (DE3) RIL cells were transformed with plasmids containing the E78Q, E122Q, E78A, E122A, E78Q/E122Q, or E78A/E122A mutant gene. All mutant proteins were expressed as described previously (1), using isopropyl β-d-1-thiogalactopyranoside for induction. Protein purification was also carried out as for wild type (WT) enzyme (1) with the exception that the imidazole concentration employed to elute the mutant protein depended on the mutant enzyme being purified. Proteins bound to the Ni-NTA column were eluted using an imidazole gradient, 30–300 mm, at pH 8. The E78Q mutant enzyme eluted at 150–180 mm imidazole, whereas remaining mutant proteins eluted at 180–300 mm imidazole. Purity of the proteins was assessed using SDS-PAGE with the gel stained with Coomassie Brilliant Blue G-250. Protein concentration was measured by Bradford assay, by measuring the absorbance at 595 nm (12).
Enzyme Assay
The SDH reaction was monitored via the appearance or disappearance of NADH at 340 nm (ϵ340 = 6220 m−1cm−1) using a Beckman DU 640 spectrophotometer. All assays were carried out at 25 °C, and the temperature was maintained using a Neslab RTE-111 water bath. Rate measurements were carried out in 0.5 ml of 100 mm Hepes, pH 7.2. Reactions were initiated by the addition of enzyme to a mixture containing all other reaction components, and the initial linear portion of the time course was used to calculate the initial velocity. The amount of enzyme added was determined using an enzyme concentration series (v versus [E]) for each mutant enzyme.
Initial Velocity Studies
Initial velocity patterns were obtained for both the E78Q and E122Q mutant enzymes in both reaction directions, but only in the direction of saccharopine formation for the E78A, E122A, E78Q/E122Q, and E78A/E122A mutant enzymes. All data were collected at 25 °C in 100 mm Hepes, pH 7.2. In the direction of lysine formation, initial rates were measured for E78Q and E122Q mutant enzymes, as a function of saccharopine concentration (0.5–10 Km) at different fixed levels of NAD (0.5–10 Km). In the direction of saccharopine formation, initial velocities for E78Q and E122Q were measured as a function of lysine concentration (0.5–10 Km) at different fixed levels of α-Kg (0.5–10 Km) with NADH maintained near saturation (≥10 Km). Additionally, initial velocity studies were also carried out for WT SDH as described previously (1). Lysine was added as the hydrochloride salt. As a result of the high concentrations of lysine used, as high as 1.2 m, the effect of added NaCl on the initial rate was tested; no effect was found.
Pairwise Analysis
Pairwise analyses were performed for E78A, E122A, E78Q/E122Q, and E78A/E122A, as described previously (1), in the direction of saccharopine formation. One substrate was varied (0.5–10 Km) at different fixed concentrations of the second one (0.5–10 Km), maintaining the third substrate near saturation (≥10 Km). This experiment was carried out for all reactant pairs: Lys/α-Kg, NADH/α-Kg, and NADH/Lys.
Dead-end Inhibition Studies
Inhibition patterns were measured for all mutant proteins at the extremes of pH (6 and 9) using OG, a structural analogue of α-Kg, as the dead-end inhibitor. Lysine was varied at different fixed concentrations of OG including zero, whereas NADH and α-Kg were maintained at saturation and at a low concentration (2 Km), respectively. To determine whether there was a change in the kinetic mechanism, a dead-end inhibition pattern was also obtained for the E78A/E122A mutant protein at pH 7.2. The initial rate was measured at different fixed levels of NADH (around Ki NADH), varying OG (0.5–5 Ki), with lysine and α-Kg maintained at 2 Km. A pattern was also obtained by varying Lys (0.5–10 Km), at different fixed levels of OG, at fixed α-Kg (1.5 Km) and with NADH near saturation (10 Km). The appKi for OG in all cases was first estimated by measuring the rate as a function of OG with other reactants fixed at Km, plotting 1/v versus I, and extrapolating 1/v to zero.
pH Studies
To determine whether the mutations affected the pKa values observed in the pH-rate profile of the WT SDH, initial velocity was measured in the direction of saccharopine formation as a function of pH at 25 °C. The pH dependence of V, the V/KLys, and V/Kα-Kg was measured as a function of pH (pH 5–10). The V/K values were obtained by measuring the initial rate as a function of one substrate with all others maintained at saturation. Experiments were carried out for only the single mutant proteins, varying α-Kg with the other two substrates fixed at saturation (≥10 Km). For both double mutant enzymes, lysine inhibited the reaction at low concentrations of α-Kg, and thus V/Kα-Kg was not determined. The pH was maintained using the same buffers over the same pH range, as before (1). No buffer effects were observed on any mutant enzyme. The pH was recorded before and immediately after measuring the initial velocity at 25 °C; no significant differences were detected.
Primary Substrate Deuterium Kinetic Isotope Effects
Isotope effects were measured for all mutant enzymes in the pH-independent region of their pH-rate profiles (pH 5 for E78A; pH 9.5 for E78Q, E122Q, E122A and E78A/E122A; and pH 7.2 for E78Q/E122Q). Effects were measured in the direction of saccharopine formation, using NADD as the deuterated substrate (1). DV2 and D(V2/KLys) were obtained for all mutant proteins, by measuring the initial rates in triplicate, as a function of lysine concentration (0.5–10 Km), at saturating levels of α-Kg (10 Km) and NADH(D) (10 Km).
4R-4-2H NADH and NADH were prepared as described previously (13). Briefly, ethanol-d6 (or ethanol) and NAD were incubated with alcohol and aldehyde dehydrogenases in 6 mm Taps, pH 9, at room temperature, for 1–2 h. The pH was maintained at pH 9 using 0.1 n KOH throughout the reaction time course. After 2 h, the reaction was quenched by vortexing with a few drops of carbon tetrachloride, and the aqueous layer was separated. The purity of the final NADH(D) was estimated by measuring the absorbance ratio at 260/340 nm; a ratio of 2.27 ± 0.06 was obtained similar to the value of 2.15 ± 0.05 for pure compound (13). The concentrations of NADH(D) were estimated using a ϵ340 of 6220 m−1cm−1. The initial rates measured using the same concentrations of commercial NADH and the NADH prepared as above, were similar. The NADH(D), was used immediately after preparation without further purification.
Solvent Deuterium Kinetic Isotope Effects
The isotope effects were obtained by direct comparison of initial rates, in triplicate, in D2O and H2O, in the pH(D)-independent region of the pH-rate profiles (14). For rates measured in D2O, substrate preparation and pH(D) adjustments were done as described previously (1). Initial rates were measured varying lysine at fixed saturating levels of NADH and α-Kg (≥10 Km). Reactions were initiated by adding a small amount of each of the mutant enzymes in H2O.
Multiple Solvent Deuterium/Substrate Deuterium Kinetic Isotope Effects
Multiple isotope effects were determined in the direction of saccharopine formation, for all mutant enzymes, by direct comparison of the initial rates in H2O and D2O as above, varying lysine at a fixed saturating concentration of NADD and α-Kg (≥10 Km).
Data Analysis
Initial rate data were first analyzed graphically, using double reciprocal plots of initial velocities versus substrate concentrations and suitable secondary and tertiary plots to determine the quality of the data and the proper rate equation for data fitting. Data were then fitted using the appropriate equations according to Cleland (15). and the Marquardt-Levenberg algorithm (16), supplied with the EnzFitter program from BIOSOFT, Cambridge, U.K. Kinetic parameters and their corresponding standard errors were estimated using a simple weighting method. Data obtained from the initial velocity patterns, in the absence of added products, were fitted using either Equation 1 for a sequential mechanism or Equation 2 with the constant term absent, or Equation 3 for competitive inhibition by B, in a sequential mechanism. Data obtained from dead-end inhibition patterns were fitted using Equations 4 and 5 for competitive and parabolic competitive inhibition by OG, respectively. Noncompetitive and uncompetitive inhibition data were fitted using Equations 6 and 7, respectively. Equations 1–7 are standard and can be found in Refs. 15, 17.
 |
In Equations 1–7, v and V are initial and maximum velocities, A, B, and I are substrate and inhibitor concentrations, Ka and Kb are Michaelis constants for substrates A and B, respectively. In Equations 1 and 3, Kia is the dissociation constant for A from the EA complex and KIB is the substrate inhibition constant for B. In Equations 4–7, Kis and Kii are the slope and intercept inhibition constants, respectively. Parabolic competitive inhibition requires two molecules of I to bind in sequence to E. Kis1 and Kis2 are the inhibition constants for E·I and E·I2 complexes, respectively.
Data for pH-rate profiles that decreased with a slope of 1 at low pH and a slope of −1 at high pH were fitted using Equation 8. Data for pH-rate profiles with a slope of +1 at low pH were fitted using Equation 9, whereas data for pH-rate profiles with a slope of −1 at high pH were fitted using Equation 10. Data for the E78A V2/Et pH-rate profile were fitted to Equation 11. Data for pH-rate profiles with a slope of +1 at low pH and a partial change at high pH were fitted using Equation 12. Similarly, data for pH-rate profiles with a slope of −1 at high pH and a partial change at low pH were fitted using Equation 13. Data for pH-rate profiles with limiting slopes of +1 and −1 at low and high pH, respectively, and with a partial change in the middle, were fitted using Equation 14. Equations 8–12 are standard and can be found in Refs. 15, 17. Equations 12 and 13 are derived from a combination of 9 and 11 and 10 and 11, respectively, whereas Equation 14 is derived from a combination of Equations 8 and 11.
 |
 |
 |
In Equations. 8–14, y is the observed value of the parameter (V or V/K) at any pH, C is the pH-independent value of y, H is hydrogen ion concentration, K1, K2, and K3 represent acid dissociation constants for enzyme or substrate functional groups, and YL and YH are constant values of V or V/K at the low and high pH, respectively.
Isotope effect data were fitted using Equations 15 and 16, which allow the isotope effects on V and V/K to be independent or equal, respectively. Equations 15 and 16 are standard and can be found in reference (15).
 |
 |
In Equations 15 and 16, Fi is the fraction of deuterium label in the substrate or D2O in the solvent, EV/K and EV are the isotope effects −1 on V/K and V, respectively, and Ev is the isotope effect −1 on V and V/K, when they are equal to one another. All other parameters are as defined above.
Molecular Graphics
The active site figure of SDH was prepared using PyMOL version 0.99 (18).
RESULTS
Cell Growth, Protein Expression, and Purification
Expression of the E78Q, E122Q, E78Q/E122Q, E78A, E122A, and E78A/E122A mutant enzymes was nearly three times lower than that of the WT SDH using the same conditions employed for WT. The E78Q mutant enzyme was eluted from the Ni-NTA column with buffer containing 150–180 mm imidazole at pH 8, whereas all others eluted at ≥180 mm imidazole. Purity of the proteins was assessed using SDS-PAGE, and all of the mutant proteins were estimated to be >98% pure. The amount of purified enzyme obtained from a 1-liter culture for E78Q, E122Q, E78A, E122A, E78Q/E122Q, and E78A/E122A was 1, 0.7, 4, 3, 2.7, and 3.7 mg, respectively. His-tagged mutant SDH proteins are active and stable for months when kept at 4 °C in 100 mm Tris and 300 mm KCl at pH 8.
Initial Velocity Studies of E78Q, E122Q, and E78Q/E122Q
Double reciprocal initial velocity patterns were obtained at pH 7, in both reaction directions, for the E78Q and E122Q mutant enzymes as discussed under “Experimental Procedures.” However, the cost of saccharopine prohibited measuring initial rate data for all of the mutant enzymes in the direction of Lys formation, and data were obtained only in the direction of saccharopine formation for the remaining mutant enzymes. Initial velocity patterns intersect to the left of the 1/v axis (data not shown), consistent with the sequential mechanism proposed for the WT enzyme. For the E78Q/E122Q mutant enzyme, the NADH/Lys pair exhibited a parallel double reciprocal plot, whereas the Lys/α-Kg pair illustrated inhibition by lysine at low α-Kg levels. The Michaelis constants for Lys and α-Kg increased 25- and 18-fold, respectively, for E78Q/E122Q. V2/KLysEt decreased about 60-fold for E122Q, whereas the V/K values for lysine and α-Kg decreased at least 22-fold for E78Q/E122Q. Kinetic parameters are summarized in Table 2.
TABLE 2.
Kinetic parameters for the E78Q, E122Q, and E78Q/E122Q
Kinetic parameters were determined in both reaction directions for E78Q and E122Q. For E78Q/E122Q mutant enzyme it was determined only in the direction of saccharopine formation. The reactions were monitored at 25 °C and at pH 7.2.
| Kinetic parameters at pH 7.2 | SDH-WT | E78Q | E122Q | E78Q/E122Q |
|---|---|---|---|---|
| Forward reaction | ||||
| V1/Et (s−1) | 1.1 ± 0.1 | 3.95 ± 0.01 | 0.76 ± 0.04 | NDa |
| Fold change | +3.6 | −1.45 | ||
| V1/KNADEt (m−1s−1) | (1.2 ± 0.1) × 103 | (3.62 ± 0.58) × 103 | (2.31 ± 0.3) × 102 | ND |
| Fold change | + 3.1 | −5.2 | ||
| V1/KSacEt (m−1s−1) | (1.6 ± 0.3) × 102 | (2.1 ± 0.4) × 103 | (5.5 ± 0.3) × 101 | ND |
| Fold change | +13 | −3 | ND | |
| KSac (mm) | 6.7 ± 1.4 | 2.0 ± 0.4 | 14.0 ± 0.8 | ND |
| Fold change | −3.4 | +2.1 | ||
| KNAD (mm) | 0.9 ± 0.1 | 1.1 ± 0.2 | 3.3 ± 0.4 | ND |
| Fold change | +1.2 | +3.7 | ||
| KiNAD (mm) | 1.1 ± 0.3 | 0.5 ± 0.3 | 1.9 ± 0.3 | ND |
| Fold change | −2.0 | +1.7 | ND | |
| Reverse reaction | ||||
| V2/Et (s−1) | 20.0 ± 1.0 | 11.2 ± 0.4 | 4.3 ± 0.1 | 24.7 ± 2.6 |
| Fold change | −1.2 | −4.6 | +1.2 | |
| V2/KNADHEt (m−1s−1) | (1.6 ± 0.2) × 106 | (8.0 ± 0.3) × 105 | (1.9 ± 0.2) × 105 | (2.0 ± 0.2) × 105 |
| Fold change | −2 | −8.4 | −8 | |
| V2/KLysEt (m−1s−1) | (2.5 ± 0.4) × 104 | (2.8 ± 0.2) × 103 | (4.100 ± 0.001) × 102 | (9.1 ± 0.9) × 102 |
| Fold change | −8.8 | −60.7 | −27.4 | |
| V2/Kα-KgEt (m−1s−1) | (2.8 ± 0.7) × 105 | (4.9 ± 0.3) × 104 | (1.50 ± 0.07) × 104 | (1.3 ± 0.1) × 104 |
| Fold change | −5.7 | −18 | −22 | |
| KNADH (mm) | 0.019 ± 0.002 | 0.014 ± 0.004 | 0.025 ± 0.002 | 0.12 ± 0.01 |
| Fold change | −1.4 | +1.3 | +6.3 | |
| KLys (mm) | 1.1 ± 0.2 | 4.0 ± 0.4 | 11.0 ± 0.6 | 27.1 ± 1.3 |
| Fold change | +3.6 | +10 | +24.5 | |
| Kα-Kg (mm) | 0.11 ± 0.03 | 0.23 ± 0.02 | 0.30 ± 0.01 | 2.0 ± 0.5 |
| Fold change | +2.1 | +2.7 | +17.8 | |
a ND, not determined.
Pairwise Analysis
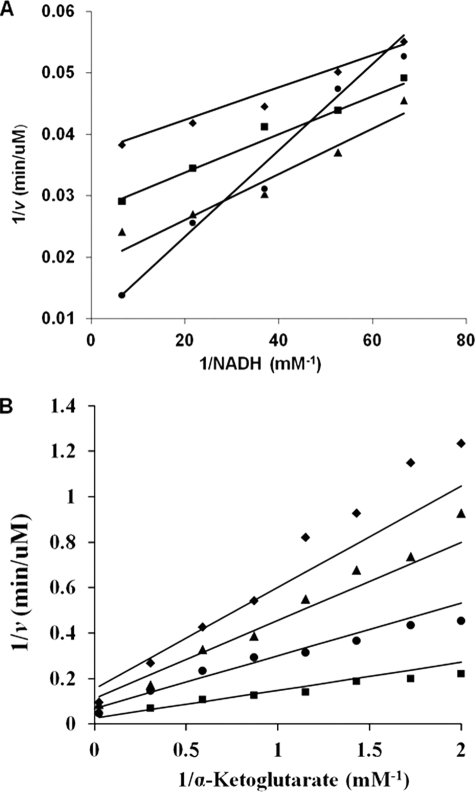
Initial velocity patterns for E78A, in the direction of saccharopine formation, for all three variable pairs, Lys/α-Kg, α-Kg/NADH, and NADH/Lys, are similar to WT (1). Patterns intersect to the left of the ordinate for Lys/α-Kg pair, whereas α-Kg/NADH and NADH/Lys gave a series of parallel lines (data not shown). For E122A, the double reciprocal plot for the Lys/α-Kg pair exhibited a parallel pattern (data not shown). Inhibition by α-Kg and lysine is observed at low NADH concentrations for α-Kg/NADH (data not shown) and the NADH/Lys pairs, respectively. The pattern, exhibiting competitive substrate inhibition by Lys for NADH/Lys pair is shown in Fig. 2A as an example. For E78A/E122A, the double reciprocal plot for α-Kg/NADH differed from that of the WT and exhibits a pattern that intersects to the left of the ordinate (Fig. 2B), suggesting there might be a change in kinetic mechanism. The Lys/α-Kg and NADH/Lys pairs, exhibited inhibition by lysine, at low concentrations of α-Kg or NADH, respectively. For the E122A and E78A/E122A mutant enzymes, KLys increased more than 30- and 170-fold, respectively, whereas Kα-Kg increased 40-fold for E78A/E122A. The V/K for lysine decreased for E122A and E78A/E122A by more than 45- and 190-fold, respectively, and the V/K for α-Kg decreased 55-fold for E78A/E122A. However, kcat did not show significant changes, compared with WT, for any of the mutant enzymes. Plots are not shown, but the kinetic parameters obtained at pH 7.2 and 25 °C for all mutant proteins are summarized in Tables 2 and 3.
FIGURE 2.
Initial velocity patterns for the E122A and E78A/E122A mutant enzymes. A, double reciprocal plot of initial rate (E122A) as a function of the concentration of NADH, as shown at different fixed levels of lysine: 20 mm (♦), 29.4 mm (■), 52.6 mm (▲), and 300 mm (●). The concentration of α-Kg was fixed at 5 mm (saturation). Data exhibit competitive substrate inhibition by lysine. The points are experimental, whereas the lines are based on a fit to Equation 3. B, double reciprocal plot of initial rate (E78A/E122A), as a function of the concentration of α-Kg as shown at different fixed levels of NADH: 0.025 mm (♦), 0.036 mm (▲), 0.068 mm (●), and 0.54 mm (■). The concentration of Lys was fixed at 1200 mm (saturation). The points are experimental, whereas the lines are based on a fit to Equation 1.
TABLE 3.
Kinetic parameters for E78A, E122A, and E78A/E122A mutant enzymes in the direction of saccharopine formation at 25 °C and pH 7.2
| Kinetic parameters at pH 7.2 | SDH-WT | E78A | E122A | E78A/E122A |
|---|---|---|---|---|
| V2/Et (s−1) | 20.0 ± 1.0 | 88.8 ± 4.7 | 19.4 ± 0.8 | 24.80 ± 0.04 |
| Fold change | +4.4 | ∼1 | +1.2 | |
| V2/KNADHEt (m−1s−1) | (1.6 ± 0.2) × 106 | (2.5 ± 0.1) × 106 | (3.1 ± 0.1) × 105 | (2.20 ± 0.03) × 105 |
| Fold change | +1.53 | −5.1 | −7.3 | |
| V2/KLysEt (m−1s−1) | (2.5 ± 0.4) × 104 | (1.43 ± 0.08) × 105 | (5.3 ± 0.2) × 102 | (1.300 ± 0.002) × 102 |
| Fold change | +5.7 | −47 | −192 | |
| V2/Kα-KgEt (m−1s−1) | (2.8 ± 0.7) × 105 | (4.9 ± 0.4) × 105 | (3.5 ± 0.2) × 104 | (5.11 ± 0.01) × 103 |
| Fold change | +1.8 | −8 | −55 | |
| KNADH (mm) | 0.019 ± 0.002 | 0.036 ± 0.003 | 0.062 ± 0.034 | 0.113 ± 0.001 |
| Fold change | +1.9 | +3.3 | +5.9 | |
| KLys (mm) | 1.1 ± 0.2 | 0.62 ± 0.01 | 36.5 ± 1.1 | 190.7 ± 1.4 |
| Fold change | −1.76 | +33.0 | +176 | |
| Kα-Kg (mm) | 0.11 ± 0.03 | 0.180 ± 0.002 | 0.556 ± 0.004 | 4.850 ± 0.001 |
| Fold change | +1.6 | +5.1 | +44.1 | |
| KiNADH (mm) | 0.017 ± 0.003 | 0.038 ± 0.001 | 0.019 ± 0.003 | 0.015 ± 0.002 |
| Fold change | +2.2 | N/Aa | N/A |
a N/A, not applicable.
Dead-end Inhibition Studies
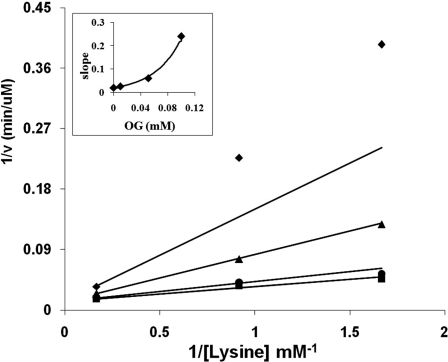
Dead-end inhibition data were obtained for all mutant proteins. With the exception of E78A, noncompetitive inhibition by OG against lysine was observed at pH 6 and 9. On the other hand, E78A gave competitive inhibition by OG against lysine. At pH 9, linear competitive inhibition was observed, whereas parabolic competitive inhibition was observed at pH 6 (Fig. 3). Data are summarized in Table 4.
FIGURE 3.
Parabolic competitive inhibition by OG against lysine. Double reciprocal plot of initial rate as a function of lysine concentration is shown at different fixed levels of OG: 0 mm (■), 0.01 mm (●), 0.05 mm (▲), and 0.1 mm (♦). The concentrations of NADH and α-Kg were fixed at 0.4 mm (saturation) and 0.4 mm (2 Km), respectively. The points are experimental, whereas the lines are theoretical on the basis of a fit to Equation 5. The inset shows a plot of slope versus OG, illustrating the parabolic slope effect. The curve is determined using Equation 5.
TABLE 4.
Inhibition constants for OG at pH 6 and 9
| Mutant enzyme | pH | Kis | Kii | Patterna |
|---|---|---|---|---|
| mm | mm | |||
| E78Q | 6 | 0.06 ± 0.01 | 0.12 ± 0.03 | NC |
| 9 | 0.48 ± 0.09 | 0.6 ± 0.10 | NC | |
| E122Q | 6 | 0.056 ± 0.010 | 0.28 ± 0.07 | NC |
| 9 | 0.26 ± 0.07 | 0.13 ± 0.01 | NC | |
| E78Q/E122Q | 6 | 0.53 ± 0.08 | 1.52 ± 0.2 | NC |
| 9 | 0.47 ± 0.08 | 0.27 ± 0.06 | NC | |
| E78A | 6 | Kis1 = 0.030 ± 0.008 | C-Parabolic | |
| Kis2 = 0.005 ± 0.003 | ||||
| 9 | 0.40 ± 0.01 | C | ||
| E122A | 6 | 0.07 ± 0.01 | 0.28 ± 0.07 | NC |
| 9 | 1.08 ± 0.22 | 0.24 ± 0.02 | NC | |
| E78A/E122A | 6 | 0.71 ± 0.10 | 1.88 ± 0.6 | NC |
| 9 | 1.60 ± 0.08 | 2.03 ± 0.06 | NC |
a NC, noncompetitive; C, competitive.
To determine whether the kinetic mechanism of the E78A/E122A mutant enzyme remains the same as WT, inhibition by OG versus NADH was obtained at pH 7.2. For E78A/E122A, at pH 7.2, OG was an uncompetitive inhibitor versus NADH with a Kii of 0.50 ± 0.03 mm, whereas it was noncompetitive against lysine, with Kis and Kii values of 0.70 ± 0.05 and 1.40 ± 0.06 mm, respectively, suggesting binding of OG after NADH as found for WT.
pH Studies
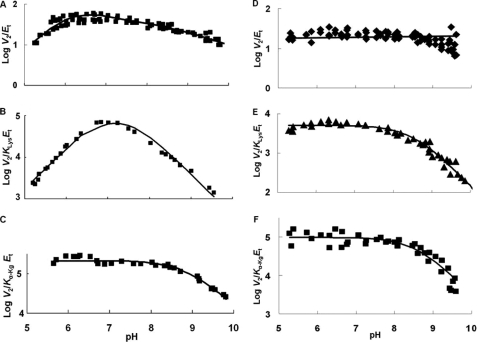
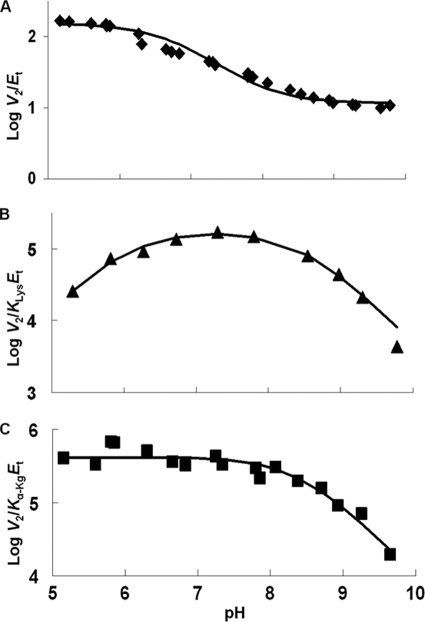
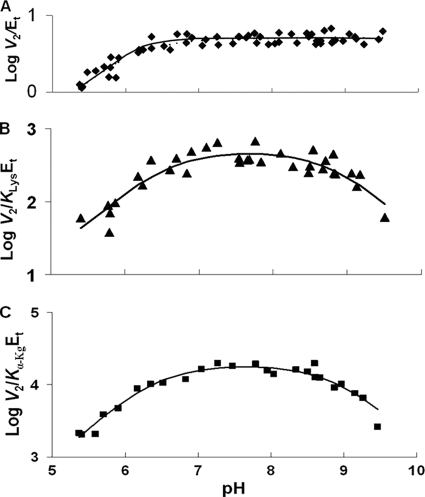
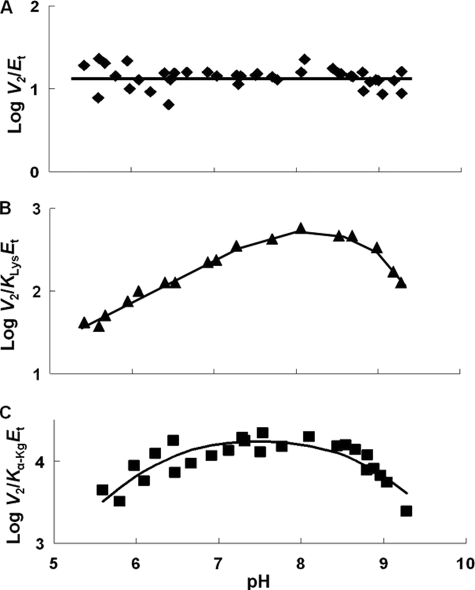
The pH dependence of kinetic parameters was determined, for all of the mutant enzymes, in the direction of saccharopine formation, at 25 °C. Results are shown in Figs. 4–9. All mutant enzymes were active and stable over the pH range 5–10. pKa values and pH-independent values of parameters are summarized in Table 5.
FIGURE 4.
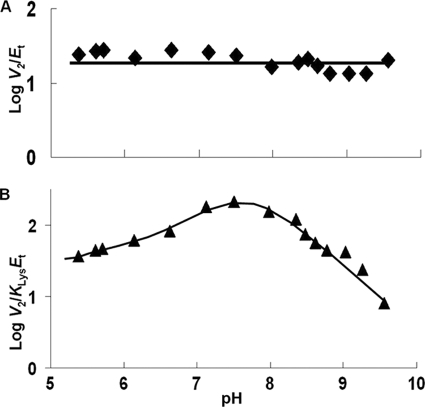
pH dependence of kinetic parameters for the SDH E78Q mutant enzyme in the direction of saccharopine formation. Data were obtained at 25 °C for V2/Et (D), V2/KLysEt (E), and V2/Kα-KgEt (F). Data for WT SDH are included for comparison (V2/Et (A), V2/KLysEt (B), and V2/Kα-KgEt (C)) (9). The points are the experimentally determined values, whereas the curves are theoretical based on fits of the data using Equation 7 for E and F; V2/Et is pH-independent, and an average value is given.
FIGURE 5.
pH dependence of kinetic parameters for the SDH E78A mutant enzyme in the direction of saccharopine formation. Data were obtained at 25 °C for V2/Et (A), V2/KLysEt (B), and V2/Kα-KgEt (C). The points are the experimentally determined values, whereas the curves are theoretical based on fits of the data using Equation 9 for A and Equation 8 for B and C.
FIGURE 6.
pH dependence of kinetic parameters for the SDH E122Q mutant enzyme in the direction of saccharopine formation. Data were obtained at 25 °C for V2/Et (A), V2/KLysEt (B), and V2/Kα-KgEt (C). The points are the experimentally determined values, whereas the curves are theoretical based on fits of the data using Equation 9 for A and Equation 8 for B and C.
FIGURE 7.
pH dependence of kinetic parameters for the SDH E122A mutant enzyme in the direction of saccharopine formation. Data were obtained at 25 °C for V2/Et (A), V2/KLysEt (B), and V2/Kα-KgEt (C). The points are the experimentally determined values, whereas the curves are theoretical based on fits of the data using Equation 8 for C. The curve for B was drawn by eye, and an average value is given for A.
FIGURE 8.
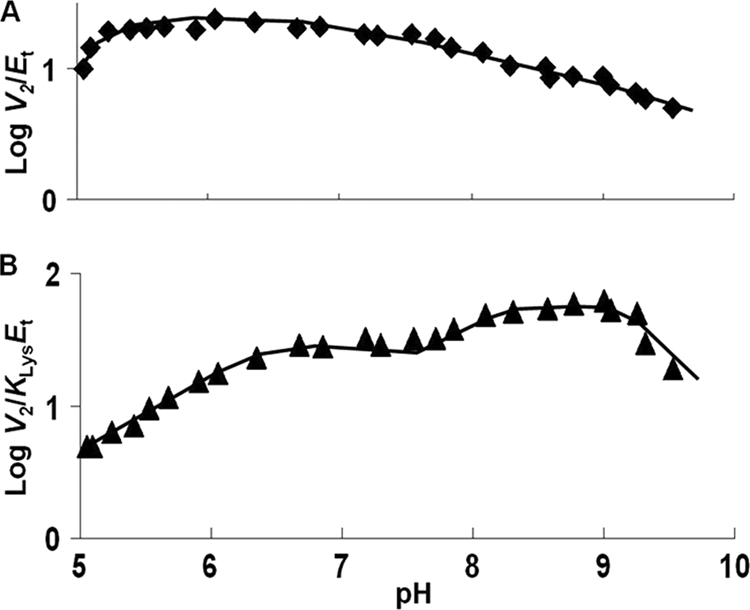
pH dependence of kinetic parameters for the SDH E78Q/E122Q mutant enzyme in the direction of saccharopine formation. Data were obtained at 25 °C for V2/Et (A) and V2/KLysEt (B). The points are the experimentally determined values, whereas the curves are theoretical drawn by eye, and pKa values were estimated graphically.
FIGURE 9.
pH dependence of kinetic parameters for the SDH E78A/E122A mutant enzyme in the direction of saccharopine formation. Data were obtained at 25 °C for V2/Et (A) and V2/KLysEt (B). The points are the experimentally determined values, whereas curves are drawn by eye. An average value is given for V2/Et.
TABLE 5.
Data obtained from pH rate profiles
V and V/K represent the pH-independent values in the respective profile; VH and V/KH represent the highest pH-independent value, VL and V/KL represent the lower pH-independent value, and VL0 and V/KL0 represent the lowest pH-independent values, for the respective pH profile. Units of V and V/K are s−1 and m−1 s−1, respectively. pK1 indicates the pKa of the group involved in the acid side of the profile whereas pK2 and pK3 indicate the pKa values of the groups involved, in the base side of the profiles.
| Enzyme | V2/Et | V2/KLysEt | V2/Kα-KgEt |
|---|---|---|---|
| WT | V = (5.8 ± 0.3) × 101 | V/K = (1.44 ± 0.07) × 105 | V/K = (2.16 ± 0.08) × 105 |
| pK1 = 5.8 | (pK1 + pK2)/2 = 7.2 | pK2 = 8.9 | |
| pK2 = 8.4 | |||
| E78Q | V = (2.00 ± 0.05) | V/K = (5.2 ± 0.2) × 103 | V/K = (9.92 ± 0.15) × 104 |
| pK2 = 8.45 ± 0.03 | pK2 = 8.50 ± 0.01 | ||
| E122Q | V = 5.09 ± 0.03 | V/K = (5.05 ± 0.07) × 102 | V/K = (1.9 ± 0.4) × 104 |
| pK1 = 5.90 ± 0.03 | pK1 = 6.50 ± 0.04 | pK1 = 6.30 ± 0.04 | |
| pK2 = 8.80 ± 0.05 | pK2 = 8.95 ± 0.10 | ||
| E78Q/E122Q | VH = 20.9 ± 0.5 | V/KH = 75.6 ± 5.3 | |
| VL = 5.24 ± 0.33 | V/KL = 29.2 ± 1.6 | NDa | |
| pK2 = (8.20 ± 0.07)b | V/KL0 = 2.06 ± 0.60 | ||
| pK1 = 6.05 ± 0.07b | |||
| pK2 = 8.01 ± 0.14 | |||
| pK3 = 9.21 ± 0.18 | |||
| E78A | VH = (1.5 ± 0.1) × 102 | V/K = (1.8 ± 0.1) × 105 | V/K = (4.2 ± 0.3) × 105 |
| VL = 11.6 ± 0.6 | pK1 = 6.1 ± 0.1 | pK2 = 8.4 ± 0.1 | |
| pK1 = 6.8 ± 0.06 | pK2 = 8.5 ± 0.1 | ||
| V/KH = (4.9 ± 0.2) × 102 | V/K = (1.96 ± 0.23) × 104 | ||
| E122A | V = 14.12 ± 0.14 | V/KL = (2.8 ± 0.4) × 101 | pK1 = 6.3 ± 0.12 |
| pK1 = (6.98 ± 0.06)b | pK2 = 8.7 ± 0.12 | ||
| pK2 = 8.7 ± 0.1 | |||
| V/KH = (2.19 ± 0.03) × 102 | |||
| E78A/E122A | V = 22.4 ± 0.2 | V/KL = (2.7 ± 0.1) × 101 | ND |
| pK1 = 6.66 ± 0.03b | |||
| pK2 = 8.4 ± 0.1 |
a ND, not determined.
b Groups that were important but not essential for catalysis/binding. Wild type data are also included for comparative purposes.
V2/Et of E78Q, E122A, and E78A/E122A is independent of pH over the range used. V2/KLysEt is bell-shaped for E122Q, E78A, and E122A as for WT, but the pKa values of the groups involved in binding and or catalysis have been shifted to lower and higher pH compared with WT. The exception is E122A, which exhibits a partial change on the acid side. On the acid side of the E78Q V2/KLysEt pH-rate profile, the pKa of the group observed for the WT enzyme is absent. The V2/Kα-KgEt pH-rate profiles for E122Q and E122A are bell-shaped, giving a pKa on the acid side of the profile, not observed for WT.
Substrate Deuterium Kinetic Isotope Effects
Primary deuterium kinetic isotope effects were measured by direct comparison of initial rates as a function of Lys concentrations at pH 7.2 for E78A, E78Q, and E122Q; at pH 5 and 9 for E78A; and at pH 7.0 for E78A/E122A and E78Q/E122Q. Experiments were carried out at 25 °C, using A-side NADD as the labeled substrate. With one exception, mutant enzymes exhibited finite isotope effects on both V and V/K. The exception is E78A, which gave a D(V) of 0.9 ± 0.1. Given isotope effects larger than WT, hydride transfer appears to contribute to rate limitation somewhat more for the E78A/122A, E122A, and E122Q mutant enzymes. Data obtained for all mutant enzymes are summarized in Tables 6 and 7.
TABLE 6.
Isotope effects data obtained for the E78Q, E122Q, and E78Q/E122Q
All isotope effects were measured in the direction of saccharopine formation. Lysine was varied while maintaining NADH and α-Kg at saturation (>10 Km) at 25 °C. Data were measured at the following pH values: 7.2 for E78Q and E122Q and 7 for E78Q/E122Q. Wild type data are included for comparative purposes.
| Parameter | Wild type SDH | E78Q | E122Q | E78Q/E122Q |
|---|---|---|---|---|
| D(V) | 1.50 ± 0.07 | 1.48 ± 0.04 | 1.60 ± 0.01 | 1.30 ± 0.03 |
| D(V/KLys) | 1.60 ± 0.05 | 1.48 ± 0.04 | 2.30 ± 0.04 | 1.30 ± 0.03 |
| D2O(V) | 2.2 ± 0.1 | 2.5 ± 0.1 | 1.96 ± 0.04 | 2.01 ± 0.06 |
| D2O(V/KLys) | 1.9 ± 0.1 | 2.5 ± 0.1 | 1.96 ± 0.04 | 2.01 ± 0.06 |
| D2O(V)D | 1.76 ± 0.08 (80% D2O) | 2.40 ± 0.04 | 1.60 ± 0.01 | 1.200 ± 0.001 |
| D2O(V/KLys)D | 1.86 ± 0.08 (80% D2O) | 1.60 ± 0.03 | 1.60 ± 0.01 | 1.400 ± 0.003 |
TABLE 7.
Isotope effects for the E78A, E122A, and E78A/E122A mutant enzymes
| Parameter | Wild type SDH | E78A | E122A | E78A/E122A |
|---|---|---|---|---|
| D(V) | 1.50 ± 0.07 | (pH 5) 0.9 ± 0.1 | 2.1 ± 0.1 | 2.24 ± 0.10 |
| (pH 9) 1.13 ± 0.03 | ||||
| D(V/KLys) | 1.60 ± 0.05 | (pH 5) 1.9 ± 0.1 | 1.5 ± 0.1 | 2.24 ± 0.10 |
| (pH 9) 1.13 ± 0.03 | ||||
| D2O(V) | 2.2 ± 0.1 | (pH 9) 1.43 ± 0.05 | 1.8 ± 0.1 | 2.40 ± 0.05 |
| D2O(V/KLys) | 1.9 ± 0.1 | (pH 9) 1.43 ± 0.05 | 2.6 ± 0.2 | 2.40 ± 0.05 |
| D2O(V)D | 1.76 ± 0.08 (80% D2O) | (pH 5) 2.90 ± 0.02 | 2.10 ± 0.04 | 3.6 ± 0.1 |
| (pH 9) 1.20 ± 0.01 | ||||
| D2O(V/KLys)D | 1.86 ± 0.08 (80% D2O) | (pH 5) 2.90 ± 0.02 | 2.50 ± 0.08 | 3.6 ± 0.1 |
| (pH 9) 1.20 ± 0.01 |
Solvent Kinetic Deuterium Isotope Effects
Isotope effects were measured by direct comparison of the initial rates as a function of Lys concentration in H2O and D2O in the pH(D)-independent range of the V and V/K pH-rate profiles. For E78A, solvent isotope effects could only be measured at pH 9; different α-Kg concentrations were required in D2O and H2O. E78Q, E122A, E122Q, E78Q/E122Q, and E78A/E122A had solvent isotope effects similar to those of WT, whereas E78A had relatively small but significant solvent isotope effects. Data are summarized in Tables 6 and 7.
Multiple Solvent Deuterium/Substrate Kinetic Deuterium Isotope Effects
Multiple isotope effects were measured in H2O and D2O using NADD as the dinucleotide substrate to examine whether the substrate and solvent isotope effects reflect the same or different steps. E78A/E122A exhibited the largest multiple isotope effect, approximately 3.5, on V and V/K. E78A also exhibited larger multiple isotope effects, approximately 2.7, relative to a value of about 1.6 for WT. Data obtained for all mutant enzymes are summarized in Tables 6 and 7.
DISCUSSION
On the basis of the semiempirical model of the E·NAD·saccharopine ternary complex of the S. cerevisiae SDH (10), there are a number of ionizable residues in the active site, as discussed in the Introduction. Although all cannot participate in general base catalysis, they are all completely conserved in all of the enzymes for which a sequence is available. As a result, they must be important for the overall reaction. Our long term goal is to obtain an estimate of the contribution of each of the residues in the active site to reactant binding and catalysis, directly or indirectly. This will require estimates of the reactant Kd values, microscopic rate constants for the catalytic steps, and pH-rate profiles to show whether the residues changed have an effect on pKa values. In this paper we have looked at the effect of Glu78 and Glu122 on the overall reaction. Elimination of either or both of the glutamate side chains increases positive charge in the site, and the effect of mutating these side chains is discussed below. With the exception of the E78Q and E122Q mutant enzymes, all other mutant enzymes were only characterized in the reverse reaction direction due to the expense of saccharopine.
Kinetic Mechanism
The kinetic mechanism of SDH from S. cerevisiae is ordered in the direction of lysine formation with NAD bound before saccharopine, whereas in the reverse reaction direction NADH binds to E, but lysine and α-Kg bind in random order (1). In addition, above pH 8 the mechanism in the reverse reaction direction changes to ordered with α-Kg binding after NADH and before lysine (9). With the exception of E78A mutant enzyme, data indicate that the kinetic mechanism of all mutant enzymes is the same as WT. In agreement, OG dead-end inhibition patterns at pH 6 and 9 are noncompetitive against lysine, for all mutant enzymes with the exception of E78A. The largest changes in Kis and Kii for OG are observed for the double mutant enzymes, E78Q/E122Q and E78A/E122A, and the E122A single mutant enzyme. The noncompetitive inhibition by OG versus α-Kg is indicative of binding of OG to E·NADH and E·NADH·Lys complexes. The increase in the values of Kis and Kii is consistent with the observed decrease in affinity for α-Kg to the mutant enzymes, compared with the WT. Data are consistent with the change in kinetic parameters (Tables 2 and 3). Most changes are small, but those for V/KLys are the largest for E122Q, E122A, and the double mutants E78Q/E122Q and E78A/E122A; changes in V are small (<5-fold), but high values for KLys were observed, suggesting that Glu122 contributes to lysine binding.
However, in the case of E78A, at both pH 6 and 9, OG exhibits competitive inhibition, indicating that OG competes with Lys and binds to the same binding site as Lys. OG is somewhat structurally similar to Lys, so the subtle changes occurring in the active site due to mutagenesis likely permit this. At pH 6, E78A exhibits parabolic competitive inhibition, indicating that OG binds to both E·NADH and E·NADH·OG complexes. The dissociation constants for OG suggest that binding OG to E·NADH makes it much more favorable for binding the second OG.
At pH 7, for E78A/E122A, uncompetitive dead-end inhibition by OG versus NADH indicates that α-Kg binds after NADH is bound to the enzyme, whereas noncompetitive inhibition from OG versus Lys suggests binding of α-Kg to both E·NADH and E·NADH·Lys complexes. The kinetic mechanism of this enzyme at pH 7 remains the same as that of WT. The intersecting pattern observed in the initial velocity pattern when α-Kg and NADH are varied (Fig. 2B) is likely a result of a lysine concentration that is not sufficiently saturating.
Isotope Effect Data
The kinetic mechanism of SDH in the direction of saccharopine formation at neutral pH can be written as shown in Scheme 2. In Scheme 2, A, B, C, P, and Q represent NADH, α-Kg, Lys, saccharopine, and NAD, respectively. The rate constants k1 and k2 are for binding and dissociation of NADH. k3, k4, k7, and k8 are for binding and dissociation of α-Kg; and k5, k6, k9, and k10 are for binding and dissociation of lysine; k11 and k12 are the forward and reverse net rate constants for the catalytic pathway; and k13 and k15 are for the release of saccharopine and NAD, respectively.
SCHEME 2.
Kinetic mechanism proposed for SDH from S. cerevisiae.
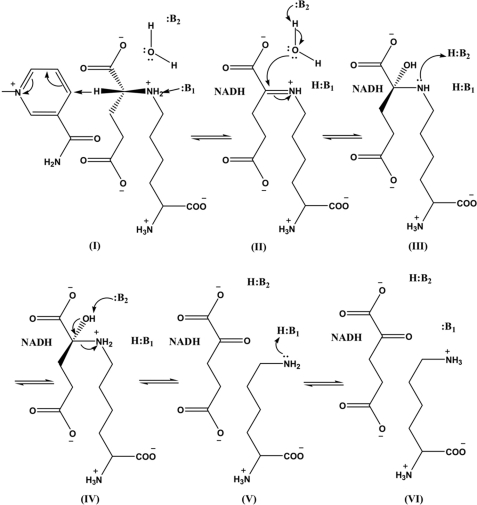
The substrate deuterium-sensitive step, hydride transfer, contained in k11, the net rate constant for catalysis, may exhibit an isotope effect upon deuteration of NADH at the C-4 pro-R hydrogen of the dihydronicotinamide ring if the transition state for reduction of the imine (II in Scheme 3) contributes to rate limitation. The solvent isotope effect reflects protons in flight in the transition state for formation of the imine (Scheme 3, II) from the carbinolamine (Scheme 3, III) and to a lesser extent, proton transfer in the transition state for the hydride transfer step (1).
SCHEME 3.
Chemical mechanism proposed for SDH. I, Michaelis E·NAD·saccharopine complex with NAD and saccharopine bound; II, imine intermediate; III, neutral carbinolamine intermediate; IV, protonated carbinolamine intermediate; V, product E·NADH·α-Kg·Lys complex with a neutral lysine ϵ-amine; VI, product E·NADH·α-Kg·Lys complex with a protonated lysine ϵ-amine.
All of the mutant enzymes exhibited finite substrate deuterium isotope effects on V and V/K. In addition, all values are similar to those of WT. Data suggest that hydride transfer contributes to rate limitation of the SDH reaction. The value of D(V) for the E122A and E78A/E122A mutant enzymes is greater than that of WT, as is D(V/K) for E78A/E122A, suggesting that Glu122 is catalytically important but not essential.
In the case of the Gln mutant enzymes, the isotope effects are very similar to those of WT (Table 6). Data suggest that only minor changes in the relative rates of steps along the reaction pathway result from the E78Q and E122Q single mutations or from the E78Q/E122Q double mutation. Thus, the glutamine side chain can effectively replace the glutamate side chain at neutral pH, i.e. the negative charge is not critical to the overall reaction. However, when Glu78 and Glu122 are changed to A, the isotope effects differ from those of WT. For the E78A mutant enzyme, the first and second order rate constants, V and V/K, are slightly higher than WT at high pH, whereas the isotope effects are close to unity for primary substrate deuterium, solvent and multiple kinetic isotope effects at high pH. Thus, it appears that steps other than chemistry limit this mutant enzyme. (The low pH effect will be discussed below when pH-rate profiles are considered.) In the case of E122A and E78A/E122A mutant enzymes, results are similar; isotope effects are either the same as those of WT or higher. Overall data suggest that the chemical steps contribute more to rate limitation, and this is especially true in the case of the E78A/E122A double mutant, where the multiple isotope effect is the largest observed for SDH thus far. Of the two residues considered, Glu122 appears to be important for the overall integrity of the catalytic machinery, although it is almost certainly not a catalytic group given the small changes in V/Et observed. To obtain quantitative estimates of the contribution of the two residues to catalysis, estimates of microscopic rate constants must be obtained. Although obtaining these estimates is planned, they require extensive multiple isotope effects including primary 15N, and α- and β-secondary isotope effects, and these studies are beyond the scope of this paper. Enough information is provided for the reader to know that the plan of procedure, although labor-intensive, will ultimately provide a comprehensive and quantitative description of how the active site of the enzyme catalyzes the oxidative deamination reaction.
Lysine Binding
The kinetic parameter most affected by mutation of Glu78 and Glu122 is V/KLys, and as a result KLys. The dissociation constants for Lys from the E·NADH·α-Kg·Lys complex can be calculated from the isotope effects according to Klinman and Matthews (19); [DV−1]/[D(V/K)−1] = Km/Kd. If the isotope effects are equal to one another, Km = Kd; but if they are not, Kd can be estimated from the remaining known values. Kd values estimated in this way are given in Table 8.
TABLE 8.
Kd values for lysine calculated from DV and D(V/K) and KLys
| Enzyme | Kd |
|---|---|
| mm | |
| WT-SDH | 1.32 ± 0.17 |
| E78Q | 4.0 ± 0.4 |
| E122Q | 23.85 ± 1.53 |
| E78Q/E122Q | 27.1 ± 1.3 |
| E78A | 0.62 ± 0.01 |
| E122A | 16.5 ± 2.3 |
| E78A/E122A | 190.7 ± 1.1 |
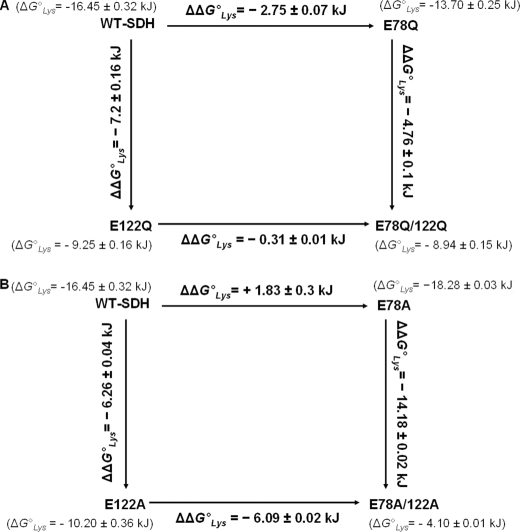
From the dissociation constants in Table 8, the contribution of Glu78 and Glu122 to lysine binding can be calculated, and a thermodynamic cycle can be constructed to show the interaction between the two residues (20). The free energy of binding lysine to the E·NADH·α-Kg complex is calculated from ΔG0 = −RT ln(1/Kd) and the change resulting from the mutation is estimated from the expression
It is known that
 |
where ΔΔGWT-E78/E1220 is the total change from WT to double mutant enzyme independent of whether Glu78 or Glu122 is changed first, ΔΔGWT-E780 and ΔΔGWT-E1220 are the changes resulting from the single mutations, and ΔΔGE78-E1220 and ΔΔGE122-E780 are the changes from the single to the double mutant enzymes. If there is a synergistic interaction between the two residues,
 |
where ΔΔGcoupling0 is the interaction energy between Glu78 and Glu122. Thermodynamic cycles for the Gln and Ala mutant enzymes, respectively, are shown in Scheme 4.3 In the case of the Gln and Ala mutant enzymes, the following estimates are obtained (20),
 |
 |
and thus Glu78 and Glu122 cooperate in the binding of lysine. The difference in the coupling free energies for Gln and Ala mutations suggests that the effect includes contributions from charge (2.4 kJ/mol) and other (including dipolar and perhaps steric) interactions (5.5 kJ/mol). The charge effect is expected given the negatively charged glutamate side chains and the positively charged α- and ϵ-amines of lysine (lysine is net positively charged as it binds to enzyme). The E78A mutant enzyme has a slightly lower Kd compared with the WT, indicative of a slightly tighter binding of lysine, perhaps because of a better accommodation of the lysine side chain. However, the effect is small (0.4 kcal/mol) and does not affect the interpretation of the role of Glu78. The larger effect of replacing the side chain suggests changes to the overall site, including an increase in volume, and perhaps an increase in proximity of like-charged residues; there are a number of lysines in the site (Fig. 1).
SCHEME 4.
Thermodynamic analysis of lysine binding in Glu78 and Glu122 glutamine and alanine mutant enzymes. Binding free energies and estimated ΔΔG0 values for lysine binding in the E78Q, E122Q, and E78Q/E122Q mutant enzymes (A) and E78A, E122A, and E78A/E122A mutant enzymes (B). ΔG0 values were calculated using the dissociation constant for lysine from the E·NADH·α-Kg·Lys complex, and ΔΔG0 values are the difference in the ΔG0 values.
pH Rate Profiles
As suggested above and in Scheme 2, SDH exhibits random addition of lysine and α-Kg from pH 5 to 8.5, whereas outside this range the mechanism becomes ordered with α-Kg binding prior to lysine (1). The V/KLys pH-rate profile exhibits groups in the E·NADH·α-Kg complex and free lysine over the entire pH range, whereas V/Kα-Kg exhibits groups in the E·NADH·lysine complex and free α-Kg from pH 5–8.5 and the E·NADH complex and free α-Kg outside this pH range. The V pH-rate profile exhibits groups on enzyme in central complexes (chemical steps contribute to rate limitation) (9) over the pH range 5–8.5.
Changes in kinetic parameters and isotope effects are not consistent with a direct catalytic role for Glu78 and Glu122. The pH-rate profiles provide the best evidence for how the glutamate side chains function in the reaction. The E78Q and E78A mutant enzymes exhibit a V/Kα-Kg pH-rate profile that is nearly identical to that of WT, suggesting that there is no effect on the rate processes in the pathway where α-Kg binds to the E·NADH·lysine complex, including all steps to release of the saccharopine product. There are changes in V at pH values <6, specifically, the group with a pKa of about 6 is not observed for either E78Q or E78A, and in addition, the partial change observed at high pH is suppressed in the E78Q mutant enzyme. The biggest change, however, is in the V/KLys. The pKa values observed for the WT enzyme, an average of 7.2 (9), and reflecting enzyme side chains in the E·NADH·α-Kg complex, are perturbed to lower and higher pH in the E78Q and E78A mutant enzymes. On average, they are perturbed by ∼1.5 pH units in E78Q and by ∼1.2 in E78A. Data suggest that both glutamate side chains contribute to setting the pKa values of the catalytic groups near neutrality, likely a result of their effective charge and/or direct interaction with the catalytic group(s). The active site of SDH is net neutral when NADH and α-Kg are bound, given an equal number of lysine and glutamate residues and His96, which is likely neutral (Fig. 1).
The changes observed when Glu122 is mutated are similar in some respects and differ in others. The V pH-rate profile for E122A is missing the partial change at high pH that was indicative of a change in kinetic mechanism from random addition of lysine and α-Kg at neutral pH to ordered addition of α-Kg prior to lysine at high pH. Data suggest that the kinetic mechanism is random over the entire pH range. In agreement, the E122Q and E122A pH-rate profiles for V/Kα-Kg and V/KLys both exhibit pKa values for the acid and base catalysts as is true for the WT V/KLys pH-rate profile. However, as is true for the E78Q and E78A mutant enzymes, the pKa values are perturbed outward. The group with the base side pKa in the V/KLys pH-rate profile is more sensitive to the substitution at Glu122 and is perturbed ∼1.6 pH units higher, whereas that on the acid side is decreased by slightly less than 1 pH unit. In addition, the decrease in the V/KLys pH-rate profile appears to be partial at low pH, and this may indicate the influence of one of the other active site residues on binding of lysine. As for the Gln mutant enzymes the explanation is likely similar, with Glu122 closer to one of the catalytic residues than the other. It is tempting to say the residue that is closest to Glu122 is His96, but the ternary complex pictured in Fig. 1 is semiempirical, and this aspect will have to await future studies.
The pH-rate profiles for the double mutant enzymes appear to be a sum of those of the single mutant enzymes. However, they are weighted toward the effect of mutating Glu122, which exhibits larger effects than mutating Glu78.
Considering all of the data, Glu78 and Glu122 do not play a direct role in catalysis, but their presence provides a modulation of the basicity of the catalytic groups in the active site of SDH, i.e. the pK values of the acid-base catalysts are tuned to a pH near neutrality. Additional residues in the active site are now being considered to further evaluate potential catalytically important groups in the SDH active site.
This work was supported, in whole or in part, by National Institutes of Health Grant GM 071417 (to P. F. C. and A. H. W.). This work was also supported by the Grayce B. Kerr Endowment to the University of Oklahoma (for P. F. C.).
A similar analysis can be carried out for V and V/K, but the interpretation is not straightforward. These are macroscopic rate constants that include contributions from a number of steps, and it is thus difficult to determine which of the several rate processes contribute to the change. The analysis should be restricted to cases in which chemistry limits the overall reaction, and isotope effects are invaluable in establishing the steps that contribute to rate limitation.
- SDH
- saccharopine dehydrogenase
- α-Kg
- α-ketoglutarate
- OG
- oxalylglycine
- WT
- wild type
- D2O
- deuterium oxide
- Ni-NTA
- nickel-nitrilotriacetic acid
- Ches
- 2-(cyclohexylamino)ethanesulfonic acid
- Mes
- 2-(N-morpholino)ethanesulfonic acid
- Taps
- 3-[tris(hydroxymethyl)methyl]aminopropanesulfonic acid
- NADD
- reduced nicotinamide adenine dinucleotide with deuterium in the 4R position.
REFERENCES
- 1.Xu H., West A. H., Cook P. F. (2006) Biochemistry 45, 12156–12166 [DOI] [PubMed] [Google Scholar]
- 2.Xu H., Andi B., Qian J., West A. H., Cook P. F. (2006) Cell Biochem. Biophys. 46, 43–64 [DOI] [PubMed] [Google Scholar]
- 3.Zabriskie T. M., Jackson M. D. (2000) Nat. Prod. Rep. 17, 85–97 [DOI] [PubMed] [Google Scholar]
- 4.Bhattacharjee J. K. (1985) Crit. Rev. Microbiol. 12, 131–151 [DOI] [PubMed] [Google Scholar]
- 5.Garrad R. C., Bhattacharjee J. K. (1992) J. Bacteriol. 174, 7379–7384 [DOI] [PMC free article] [PubMed] [Google Scholar]
- 6.Johansson E., Steffens J. J., Lindqvist Y., Schneider G. (2000) Structure 8, 1037–1047 [DOI] [PubMed] [Google Scholar]
- 7.Ye Z. H., Bhattacharjee J. K. (1988) J. Bacteriol. 170, 5968–5970 [DOI] [PMC free article] [PubMed] [Google Scholar]
- 8.Ogawa H., Fujioka M. (1978) J. Biol. Chem. 253, 3666–3670 [PubMed] [Google Scholar]
- 9.Xu H., Alguindigue S. S., West A. H., Cook P. F. (2007) Biochemistry 46, 871–882 [DOI] [PMC free article] [PubMed] [Google Scholar]
- 10.Andi B., Xu H., Cook P. F., West A. H. (2007) Biochemistry 46, 12512–12521 [DOI] [PubMed] [Google Scholar]
- 11.Burk D. L., Hwang J., Kwok E., Marrone L., Goodfellow V., Dmitrienko G. I., Berghuis A. M. (2007) J. Mol. Biol. 373, 745–754 [DOI] [PubMed] [Google Scholar]
- 12.Bradford M. M., Williams W. L. (1976) Fed. Proc. 35, 274 [Google Scholar]
- 13.Viola R. E., Cook P. F., Cleland W. W. (1979) Anal. Biochem. 96, 334–340 [DOI] [PubMed] [Google Scholar]
- 14.Schowen K. B., Schowen R. L. (1982) Methods Enzymol. 87, 551–606 [PubMed] [Google Scholar]
- 15.Cleland W. W. (1979) Methods Enzymol. 63, 103–138 [DOI] [PubMed] [Google Scholar]
- 16.Bishop C. M. (1995) in Neural Networks for Pattern Recognition, pp. 290–291, Oxford University Press, Oxford, UK [Google Scholar]
- 17.Cook P. F., Cleland W. W. (2007) Enzyme Kinetics and Mechanism, Garland Science, New York [Google Scholar]
- 18.Delano W. L. (2004) The PyMOL Molecular Graphics System, Delano Scientific, San Carlos, CA [Google Scholar]
- 19.Klinman J. P., Matthews R. G. (1985) J. Am. Chem. Soc. 107, 1058–1060 [Google Scholar]
- 20.Chen Y. I., Chen Y. H., Chou W. Y., Chang G. G. (2003) Biochem. J. 374, 633–637 [DOI] [PMC free article] [PubMed] [Google Scholar]


