Abstract
Accumulated evidence indicates that oxidative stress causes and/or promotes insulin resistance; however, the mechanism by which this occurs is not fully understood. This study was undertaken to elucidate the molecular mechanism by which oxidative stress induced by paraquat impairs insulin-dependent glucose uptake in 3T3-L1 adipocytes. We confirmed that paraquat-induced oxidative stress decreased glucose transporter 4 (GLUT4) translocation to the cell surface, resulting in repression of insulin-dependent 2-deoxyglucose uptake. Under these conditions, oxidative stress did not affect insulin-dependent tyrosine phosphorylation of insulin receptor, insulin receptor substrate (IRS)-1 and -2, or binding of the phosphatidylinositol 3′-OH kinase (PI 3-kinase) p85 regulatory subunit or p110α catalytic subunit to each IRS. In contrast, we found that oxidative stress induced by paraquat inhibited activities of PI 3-kinase bound to IRSs and also inhibited phosphorylation of Akt, the downstream serine/threonine kinase that has been shown to play an essential role in insulin-dependent translocation of GLUT4 to the plasma membrane. Overexpression of active form Akt (myr-Akt) restored inhibition of insulin-dependent glucose uptake by paraquat, indicating that paraquat-induced oxidative stress inhibits insulin signals upstream of Akt. Paraquat treatment with and without insulin treatment decreased the activity of class Ia PI 3-kinases p110α and p110β that are mainly expressed in 3T3-L1 adipocytes. However, paraquat treatment did not repress the activity of the PI 3-kinase p110α mutated at Cys90 in the p85 binding region. These results indicate that the PI 3-kinase p110 is a possible primary target of paraquat-induced oxidative stress to reduce the PI 3-kinase activity and impaired glucose uptake in 3T3-L1 adipocytes.
Keywords: Adipocyte, Glucose Transport, Insulin Resistance, Oxidative Stress, PI 3-Kinase
Introduction
Reactive oxygen species (ROS)2 are generated in organisms during metabolic reactions that use oxygen. Increased ROS production causes oxidative stress, which is frequently associated with various disorders such as hypertension, inflammation, and diabetes (1, 2). For example, it is well known that in many diabetic patients and animal models of diabetes, increased generation of ROS and the onset of diabetes are closely associated with oxidative stress (2). Antioxidants such as α-lipoic acid and vitamins C and E have been shown to improve insulin sensitivity in diabetic models, further evidence that oxidative stress is associated with insulin resistance (3–5).
In general, the intracellular insulin signal is initiated by insulin binding to its receptor (IR), resulting in activation of the intrinsic tyrosine kinase of the receptor. This leads to the recruitment and tyrosine phosphorylation of intracellular insulin receptor substrates (IRS) 1–4 (6). Phosphorylated IRS proteins bind signaling molecules possessing the Src homology 2 domain such as the class Ia PI 3-kinases that are heterodimers of a p85 regulatory subunit and a p110 catalytic subunit. Three isoforms of p110 catalytic subunit, α, β, and δ, have been identified. Both the p110α and β isoforms are widely expressed, whereas p110δ is primarily found in leukocytes (7). Phosphorylated IRS proteins bind the Src homology 2 domain of a p85 regulatory subunit of class Ia PI 3-kinases through the specific pYXXM motif (8) leading to activation of the catalytic subunit. Previous studies have shown that p110β but not p110α plays an important role in insulin action in 3T3-L1 adipocytes (9, 10), but recent reports have demonstrated that p110α is more important in insulin-induced glucose metabolism (11, 12). Thus, the role of p110α and p110β in insulin action is controversial. Once PI 3-kinase is activated, it produces the lipid second messenger phosphatidylinositol 3,4,5-trisphosphate, which then activates the downstream serine/threonine kinases such as phosphoinositide-dependent protein kinase and Akt (13), which would lead to glucose transporter 4 (GLUT4) translocation and subsequent glucose uptake (14).
Exactly how oxidative stress causes insulin resistance remains an important question to be solved in diabetes research. Previous studies have demonstrated that oxidative stress induced by hydrogen peroxide disrupts subcellular localization of IRSs, and PI 3-kinase causes insulin resistance in cultured adipocytes (15). Although hydrogen peroxide is often utilized to induce oxidative stress, oxidative stress induced by other agents through varying mechanisms results in different oxidative damage to proteins or gene expression compared with changes caused by hydrogen peroxide (16, 17). A series of results suggests that the specific effects of ROS generators on insulin signaling are dependent on the quantity, duration, and location of ROS generation (16, 17).
In this study, we induced oxidative stress by utilizing 1,1-dimethyl-4,4-bipyrimidyl chloride (paraquat) in 3T3-L1 adipocytes, a widely used model system to study insulin action. Paraquat has been used previously to induce oxidative stress in various cell lines such as hepatocytes and retinal pigmented epithelial cells (16–19). Paraquat is not itself an ROS but is capable of generating oxygen radicals through the redox cycling mechanism (20, 21). Paraquat has been used experimentally to research the effects of oxidative stress on intracellular signaling and also on various bioactivities, including cell apoptosis (17, 22–26). Here, we report that paraquat-induced oxidative stress impairs PI 3-kinase activity, resulting in repression of insulin-dependent glucose uptake in 3T3-L1 adipocytes.
EXPERIMENTAL PROCEDURES
Materials
Dulbecco's modified Eagle's medium (DMEM), Hanks' balanced salt solution, and fetal bovine serum (FBS) were obtained from Nissui Pharmaceutical Co., Ltd. (Ibaraki, Japan). Calf serum was from Invitrogen; penicillin was obtained from Banyu Pharmaceutical Co. Ltd. (Ibaraki, Japan); recombinant human insulin, paraquat, bovine serum albumin (BSA), and α-lipoic acid were obtained from Sigma; and SB203580 and dipotassium bisperoxo(picolinato)oxovanadate (V) were purchased from Merck. ECL reagents were from PerkinElmer Life Sciences. Wheat germ agglutinin (WGA)-agarose was obtained from Seikagaku Corp. (Tokyo, Japan). Protein A-Sepharose, protein G-Sepharose, 2-deoxy-d-[3H]glucose, and [γ-32P]ATP were purchased from GE Healthcare; and Vectashield was obtained from Vector Laboratories (Burlingame, CA). Phosphatidylinositol was obtained from Avanti Polar Lipids, Inc. (Alabaster, AL). Silica-coated thin layer chromatography plate was from Merck. Unless otherwise noted, other chemicals and reagents were obtained from Nacalai Tesque, Inc. (Kyoto, Japan).
Antibodies
Horseradish peroxidase-conjugated secondary anti-rabbit and anti-mouse IgG antibody was obtained from GE Healthcare. Polyclonal anti-IRS-1 and anti-IRS-2 antibodies and anti-GLUT4 antibody were raised in rabbit as described previously (27, 28). Polyclonal anti-insulin receptor β subunit antibody, anti-PI 3-kinase p110α subunit antibody, anti-PI 3-kinase p110β subunit antibody, anti-p38 MAPK antibody, and anti-β-actin antibody were obtained from Santa Cruz Biotechnology, Inc. (Santa Cruz, CA). Anti-phospho-IRS-1 Ser307, anti-Myc tag antibody (clone 9E10), anti-phosphotyrosine antibody (clone 4G10), and anti-PI 3-kinase p85 subunit antibody were from Upstate Biotechnology, Inc. (Lake Placid, NY). Anti-FLAG antibody was from Sigma. Anti-Akt antibody, anti-phospho-Akt Thr308, anti-phospho-Akt Ser473 antibody, and anti-phospho-p38 MAPK antibody were purchased from Cell Signaling Technology, Inc. (Danvers, MA). Texas Red-conjugated anti-mouse IgG antibody was obtained from Jackson ImmunoResearch. Antibody against PI 3-kinase p85α, p85β. p55α, p55γ, or p50α subunit was raised in rabbit as described previously (29, 30).
Construction of Plasmids
The mammalian expression plasmid pFLAG-p110α for expressing N-terminally 3×FLAG-tagged p110α was constructed by cloning FLAG-p110α cDNA into pcDNA 3.1(+) vector (Invitrogen). pFLAG-p110α-Δp85 for expressing N-terminally 3×FLAG-tagged p110α deleting the PI 3-kinase p85 binding region (amino acids 1–126 of the p110α) was prepared by digesting pFLAG-p110α with EcoRI followed by self-ligation. The plasmid (pCMV5–2×myc-p110α) used to express the Myc-tagged p110α was obtained by cloning Myc-tagged bovine p110α into pCMV5 vector (Addgene). In addition, the plasmid expressing Myc-tagged p110α mutant, in which Cys90 was substituted with a Ser residue, was prepared as follows. PCRs were carried out between CMV sequence primer (5′-AATGTCGTAATAACCCCGCCCCGTTGACGC-3′) and C90S antisense primer (5′-AAAAAGCCGAAGGTCAGAAAGTCGTCTTGTTTC-3′) or pCMV5-myc 3′-sequence primer (5′-ACTGGAGTGGCAACTTCCAGG-3′) and C90S sense primer (5′-GAAACAAGACGACTTTCTGACCTTCGGCTTTTT-3′) utilizing pCMV5–2×myc-p110α as a template. Purified products were mixed with CMV sequence primer and pCMV5-myc 3′-sequence primer, and additional PCR was performed. Site-directed mutated Myc-tagged p110α after BamHI digestion was ligated into pCMV5-myc vector. pMyc-p85α for expressing N-terminally Myc-tagged rat p85 was constructed by cloning myc-p85α cDNA into pCMV5 vector. pEGFP-C1 vector was obtained from Clontech.
Cell Culture and Treatment
3T3-L1 preadipocytes were maintained in DMEM containing 10% calf serum and antibiotics mixture (50 μg/ml streptomycin, penicillin, and 100 μg/ml kanamycin). To differentiate into adipocytes, preadipocytes were grown for 2 days after reaching confluency, and the medium was then changed to DMEM containing 10% FBS, 1.7 μm insulin, 1 μm dexamethasone, 112 μg/ml isobutylmethylxanthine, and antibiotics mixture. After 4 days, cells were then maintained in DMEM containing 10% FBS, 1.7 μm insulin, and antibiotics mixture for an additional 2 days. Finally, the medium was replaced with DMEM containing 10% FBS and antibiotics mixture for 2–4 days. Cells were used when at least 90% of the cell population displayed the adipocyte phenotype with the expected accumulation of lipid droplets.
Differentiated 3T3-L1 adipocytes were then serum-starved for 18 h in DMEM containing 0.1% BSA. In certain specific experiments, various concentrations of α-lipoic acid were added during serum starvation. Paraquat treatment was performed for 3 h by incubating the cells in DMEM containing the indicated concentrations of paraquat after serum starvation.
Transient Transfection of 3T3-L1 Adipocytes and HEK293T Cells
3T3-L1 adipocytes were transfected with expression plasmids using electroporation as described before (31). HEK293T cells were transiently transfected with expression plasmids by calcium phosphate precipitation method as described before (32).
Measurement of Cellular Redox Potential
Mitochondrial ROS production was detected using RedoxSensor Red CC-1 (Invitrogen). Once this unique probe passively enters live cells, the nonfluorescent probe is oxidized to a red fluorescent product that accumulates in mitochondria in an oxidative environment (33). Differentiated 3T3-L1 adipocytes on coverslips were serum-starved for 18 h with or without 500 μm α-lipoic acid and were then treated with 10 mm paraquat for 3 h. Cells were then incubated with 5 μm RedoxSensor Red CC-1 and 1 μm MitoTracker Green FM (Invitrogen, a fluorescent stain for mitochondria) at 37 °C for 10 min. Labeled cells were washed with ice-cold PBS, followed by fixation with 4% paraformaldehyde (Wako Pure Chemical Industries, Ltd., Osaka, Japan) in PBS at room temperature for 10 min. Coverslips were mounted in Vectashield and examined using 60× oil immersion objectives on a confocal laser-scanning microscope (Olympus Corp., Tokyo, Japan).
Glucose Transport Assay
3T3-L1 adipocytes in a 24-well culture plate were serum-starved for 18 h in DMEM containing 0.1% BSA, and glucose-free incubation was performed for 10 min in glucose transport assay buffer (Krebs-Ringer/phosphate (KRP) buffer: 20 mm Hepes, 140 mm NaCl, 5 mm KCl, 2.5 mm MgSO4, 1 mm CaCl2, 1% BSA, pH 7.4). Cells were then incubated with or without 10 nm insulin for 20 min, and 2-deoxy-d-[3H]glucose uptake was measured as described previously (34).
GLUT4 Translocation Assay
To quantify cell surface exposure of GLUT4, adipocytes were accomplished by transfection with exofacial Myc-tagged GLUT4-EGFP cDNA as described previously (35, 36). Briefly, adipocytes were prepared in suspension by mild trypsinization and then electroporated with plasmids using Bio-Rad Gene Pulser II at a setting of 0.15 kV and 950 microfarads. Cells were immediately mixed with fresh medium, allowed to adhere to coverslips for 24 h, and then serum-starved for 18 h prior to experiments.
After appropriate treatment, cell immunofluorescence was performed by washing the cells twice with ice-cold PBS, followed by fixation with 4% paraformaldehyde in PBS at room temperature for 10 min. Cells were then blocked with 3% BSA in PBS for 1 h at room temperature; next, cells were incubated with primary anti-Myc tag mouse monoclonal antibodies diluted 1:100 in blocking solutions for 60 min at 37 °C. Primary antibodies were detected by utilizing Texas Red dye-conjugated anti-mouse IgG antibody for 40 min at 37 °C. Coverslips were mounted in Vectashield, and cells were examined using 40× oil immersion objectives on a confocal laser-scanning microscope (Olympus Corporation, Tokyo, Japan). Quantification of cells displaying Myc plasma membrane fluorescence was determined by counting 100 cells expressing GLUT4-EGFP fluorescence in three independent experiments.
Semi-purification of Insulin Receptor and Immunoprecipitation of Various Proteins for Immunoblotting
Following appropriate treatment, cells were rinsed three times with Hanks' balanced salt solution and incubated for 5 min with or without 10 nm insulin. The cells were lysed at 4 °C with ice-cold lysis buffer (1% Nonidet P-40, 50 mm Tris-HCl, pH 7.4, 150 mm NaCl, 1 mm EDTA, 1 mm NaF, 10% glycerol, 20 μg/ml phenylmethylsulfonyl fluoride, 5 μg/ml pepstatin, 10 μg/ml leupeptin, 100 KIU/ml aprotinin, 1 mm Na3VO4, and 10 mg/ml p-nitrophenyl phosphate), and insoluble materials were removed by centrifugation at 15,000 × g for 10 min at 4 °C. Semi-purification of IR was performed as described previously (37). Briefly, 1 mg of cell lysate was incubated with 20 μl of WGA-agarose for 2 h at 4 °C. For immunoprecipitation, 1 mg of protein of cell lysate was incubated with the indicated antibody for 2 h at 4 °C, and the immunocomplexes were precipitated with 20 μl of protein A-Sepharose for polyclonal antibody or 20 μl of protein G-Sepharose for monoclonal antibody.
Immunoblotting
These precipitates described above were extensively washed three times with ice-cold lysis buffer. The precipitates or total cell lysates were boiled in 1× Sample buffer (10 mm Tris-HCl, pH 7.8, 3% SDS, 5% glycerol, 2% β-mercaptoethanol, and 0.02% bromphenol blue) for 5 min. Precipitates or total cell lysates were then subjected to SDS-PAGE and transferred to nitrocellulose membranes; immunoblotting was performed with the indicated antibodies. Following incubation with horseradish peroxide-conjugated secondary antibodies, peroxidase labeling was visualized using ECL, according to instructions provided by the manufacturer. Developed films were scanned, and the pixel volumes of the bands were determined using ImageJ software (National Institutes of Health).
PI 3-Kinase Activity Assay
Immunoprecipitation with the indicated antibody was performed as described above except 0.5 mg of protein of cell lysates was used. Immunoprecipitates were then washed once each with lysis buffer, LiCl buffer (100 mm Tris-HCl, pH 7.5, 500 mm LiCl), distilled water, TNE buffer (10 mm Tris-HCl, pH 7.5, 150 mm NaCl, 1 mm EDTA), and reaction buffer (20 mm Tris-HCl, pH 7.5, 100 mm NaCl, 0.5 mm EGTA). The PI 3-kinase assay was carried out as described previously (38) with slight modifications as noted herein. Briefly, the PI 3-kinase assay was initiated by incubation of immunocomplex in 40 μl of reaction buffer with 10 μl of [γ-32P]ATP/MgCl2/phosphatidylinositol for 15 min at 25 °C to give a final concentration of 20 μm [γ-32P]ATP (4 μCi/mmol), 20 mm MgCl2, and 20 μg of phosphatidylinositol. After incubation, 100 μl of chloroform/methanol/HCl (10:20:1, by volume) was added to stop the reaction. Lipid products were extracted, spotted onto a silica gel plate, and developed with chloroform/methanol/NH4OH/water (43:38:6:6, by volume). 32P radioactivity incorporated into phosphatidylinositol was measured by autoradiography as PI 3-kinase activity.
Adenoviral Gene Transduction
Recombinant adenoviruses Adex1CAlacZ and Adex1CAmyr-Akt, which encode Escherichia coli lacZ and Myc-tagged myr-Akt, respectively, were constructed by homologous recombination of the expression cosmid cassette and the parental virus genome as described previously (34). 3T3-L1 adipocytes were incubated with DMEM containing the adenoviruses for 6 h at 37 °C, at which time growth medium was added. Experiments were performed 3 days after infection. When the adenovirus Adex1CAlacZ was applied at a multiplicity of infection of 200 plaque-forming units/cell, lacZ gene expression was observed in more than 90% of 3T3-L1 adipocytes on post-infection day 3. Infection with Adex1CAlacZ or Adex1CAmyr-Akt did not affect differentiation into adipocytes, numbers of differentiated adipocytes, or morphological features in 3T3-L1 adipocytes, as compared with untreated cells.
Statistical Analysis
Results are expressed as means ± S.E. For comparisons, data were analyzed utilizing two- or three-way analysis of variance followed by Fisher protected least significant difference post hoc test using StatView software (Abacus Concepts, Inc., Berkeley, CA). Bars with different superscript letters are significantly different at p < 0.05. Differences between two groups were tested by Student's t test. Differences were considered to be statistically significant at p < 0.05.
RESULTS
Paraquat Increases ROS Generation
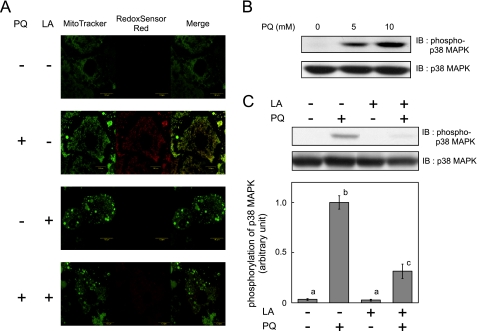
To evaluate whether paraquat increases intracellular and mitochondrial ROS generation in 3T3-L1 adipocytes, we loaded cells with the fluorescent probes MitoTracker Green and RedoxSensor Red. As shown in Fig. 1A, RedoxSensor Red demonstrated increased intracellular ROS production around mitochondria when cells were treated with paraquat. When α-lipoic acid (which functions as an antioxidant to scavenge ROS such as hydrogen peroxide, hydroxyl radical, singlet oxygen, nitric oxide, and peroxynitrite) (39) was added during paraquat treatment, RedoxSensor Red signals were not detected. Because endogenous oxidative stress is reported to stimulate p38 MAPK (40), we investigated whether phosphorylation of p38 MAPK, which reflects its activation, increased after paraquat treatment (Fig. 1B). Paraquat increased phosphorylation of p38 MAPK, and addition of α-lipoic acid during paraquat treatment inhibited this activation (Fig. 1C), indicating that paraquat treatment increased ROS generation thereby inducing oxidative stress in 3T3-L1 adipocytes.
FIGURE 1.
Effect of paraquat on ROS generation and p38 MAPK activation. 3T3-L1 adipocytes were serum-starved for 18 h with or without 500 μm α-lipoic acid (LA); cells were then treated with 0 or 10 mm PQ (A and C) or various concentrations of PQ (B) for 3 h. A, mitochondrial ROS generation was detected with MitoTracker or RedoxSensor Red. Representative results of three independent experiments are shown. B and C, cells were solubilized, and immunoblotting (IB) using indicated antibodies was performed. The inserted graph indicates densitometric analysis of the immunoblotting. Experiments were performed in triplicate, and the values were expressed as means ± S.E. There are significant differences between values with different superscript characters (p < 0.05).
Paraquat Impairs Insulin-dependent Glucose Uptake through Inhibition of GLUT4 Translocation to Plasma Membrane
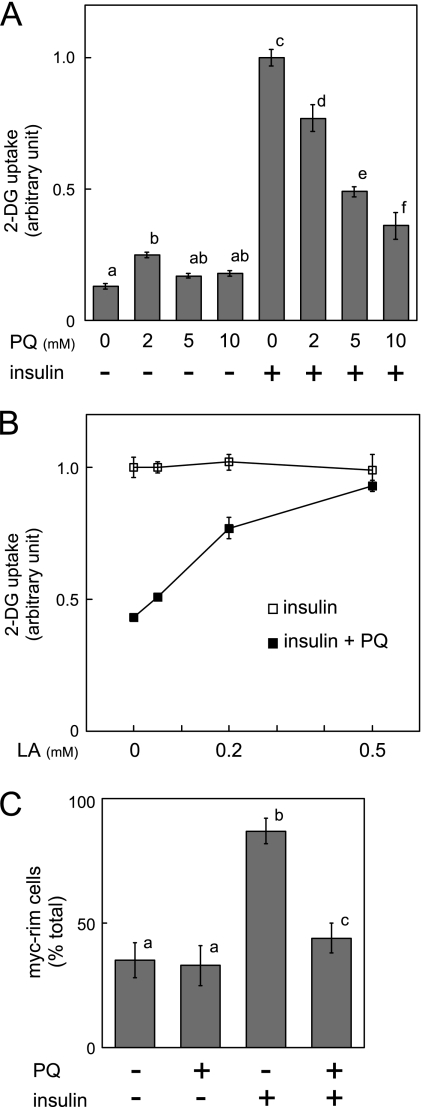
To investigate the effect of paraquat on insulin-dependent glucose uptake, 3T3-L1 adipocytes were treated with the indicated concentrations of paraquat for 3 h, and then stimulated with insulin, followed by measurement of 2-deoxyglucose (2-DG) uptake into cells. As shown in Fig. 2A, paraquat treatment decreased insulin-dependent glucose uptake in a concentration-dependent manner. The inhibitory effect of paraquat on insulin-dependent 2-DG uptake was abolished by α-lipoic acid as shown in Fig. 2B, a result clearly indicating that the inhibitory effect of paraquat on insulin-dependent 2-DG uptake is due to ROS generated by paraquat. Furthermore, the effect of paraquat on insulin-dependent GLUT4 translocation was then examined by counting the number of cells expressing Myc-tagged GLUT4 on the cell surface (Fig. 2C). Paraquat treatment reduced the number of Myc tag-expressing cells and therefore decreased insulin-dependent GLUT4 translocation to the plasma membrane.
FIGURE 2.
Effect of paraquat on insulin-dependent 2-DG uptake and GLUT4 translocation to plasma membrane. A, 3T3-L1 adipocytes were serum-starved for 18 h, and cells were then treated with indicated concentrations of PQ for 3 h followed by incubation with 10 nm insulin for 20 min. Uptake of 2-DG was then measured as described under “Experimental Procedures.” The experiment was performed in triplicate, and the results shown are the means ± S.E. There are significant differences between values with different superscript characters (p < 0.05). B, 3T3-L1 adipocytes were cultured with serum-free medium containing 0, 50, 200, or 500 μm α-lipoic acid (LA) for 18 h, and cells were then treated with 0 or 10 mm paraquat for 3 h, followed by incubation with 10 nm insulin. Uptake of 2-DG was then measured. The experiment was performed in quadruplicate, and the results shown are the means ± S.E. C, 3T3-L1 adipocytes were electroporated with expression vector containing exofacial Myc-tagged GLUT4-EGFP cDNA. Electroporated 3T3-L1 adipocytes were serum-starved for 18 h, and cells were then treated with 0 or 10 mm paraquat for 3 h followed by incubation with 10 nm insulin for 20 min. GLUT4 translocation to plasma membrane was assayed as described under “Experimental Procedures.” Graph represents the percentage of cells expressing Myc fluorescence on the cell surface. The results shown are the means ± S.E. of three independent experiments. There are significant differences between values with different superscript characters (p < 0.05).
Paraquat Does Not Markedly Affect the Quantities of Insulin Signaling Molecules
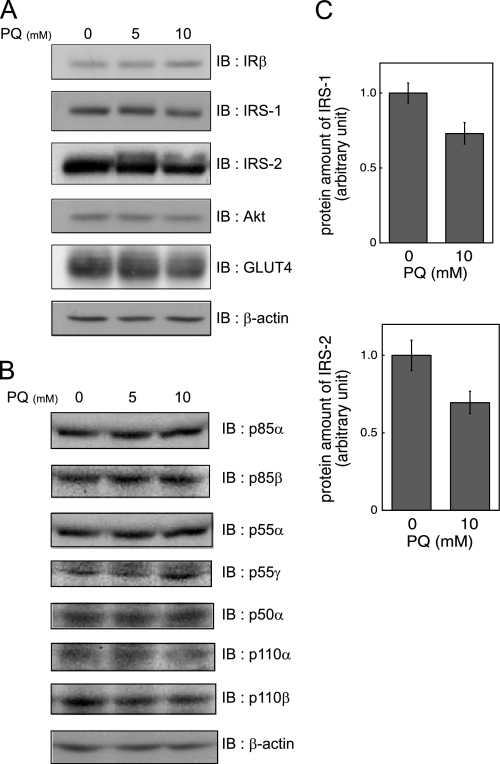
Before studying the effects of paraquat on insulin signaling, we examined the quantities of insulin signaling molecules. Paraquat treatment did not reduce the protein levels of IR, PI 3-kinase p85α, p85β, p55α, p55γ, and p50α, PI 3-kinase p110α, and p110β, Akt, or GLUT4 (Fig. 3, A and B), indicating that impairment of insulin-dependent glucose uptake is not explained by reduction of these molecules. However, the levels of IRS-1 and IRS-2 showing a smear pattern in response to paraquat treatment appeared slightly but not significantly decreased (Fig. 3, A and C).
FIGURE 3.
Effect of paraquat on expression of insulin signaling molecule. A and B, 3T3-L1 adipocytes were serum-starved for 18 h and were then treated with indicated concentrations of PQ for 3 h. Cells were then solubilized. Equal amounts of protein were subjected to SDS-PAGE, and immunoblotting (IB) was performed with indicated antibodies. Representative results of three independent experiments are shown. C, levels of IRS-1 or IRS-2 in triplicate cells after treatment with 0 or 10 mm PQ for 3 h as described above. The results shown are the mean ± S.E. after quantitative analysis of immunoblotting. The significant difference with p < 0.05 between cells with and without paraquat treatment was not observed.
Paraquat Does Not Affect Insulin-dependent Tyrosine Phosphorylation of IR and IRS or Binding of IRS to PI 3-Kinase
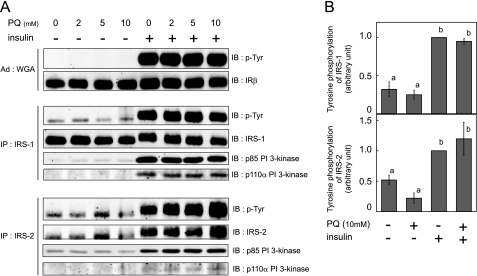
IR was semi-purified using WGA-agarose, and IRSs were immunoprecipitated from cell lysates, followed by immunoblotting analysis using anti-phosphotyrosine antibody. Tyrosine phosphorylation of IR, IRS-1, and IRS-2 was not decreased by paraquat pretreatment even at 5 or 10 mm, although we observed inhibition of insulin-dependent 2-DG uptake with these concentrations (Fig. 4, A and B). These results are consistent with those of previous studies using glucose oxidase to induce oxidative stress (15).
FIGURE 4.
Effect of paraquat on insulin-stimulated tyrosine phosphorylation and PI 3-kinase association with IRS. A, 3T3-L1 adipocytes were serum-starved for 18 h, and cells were then treated with the indicated concentration of PQ for 3 h followed by incubation with 10 nm insulin for 5 min at which time cells were solubilized. IR was precipitated with WGA-agarose from whole cell lysate. IRS-1 or IRS-2 was immunoprecipitated (IP) with anti-IRS-1 or anti-IRS-2 antibody from whole cell lysate. These precipitates were subjected to SDS-PAGE, and immunoblotting (IB) was then performed with the indicated antibodies. Representative results of three independent experiments are shown. B, quantitative analysis of tyrosine phosphorylation (p-Tyr) of IRS-1 or IRS-2 was performed in triplicate, and the results shown are the means ± S.E. There are significant differences between values with different superscript characters (p < 0.05).
Next, to evaluate whether paraquat affected downstream insulin signaling after IRS tyrosine phosphorylation, we investigated the binding of PI 3-kinase to IRSs in response to insulin stimulation. IRS-1 or IRS-2 was immunoprecipitated from cell lysates, and immunoblotting was performed using anti-PI 3-kinase p85 antibody and anti-PI 3-kinase p110α antibody. As shown in Fig. 4A, association of both p85 and p110α with IRS-1 or IRS-2 induced by insulin was not affected by paraquat pretreatment, a finding consistent with the changes in tyrosine phosphorylation of IRSs.
Paraquat Inhibits Insulin-dependent PI 3-Kinase Activation as Well as Akt Phosphorylation
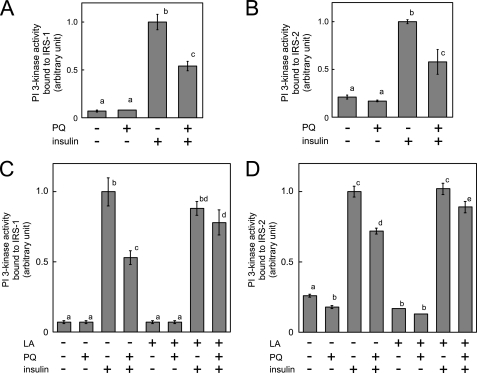
We then measured PI 3-kinase activity bound to IRS-1 and IRS-2. Surprisingly, insulin-dependent activation of PI 3-kinase associated with IRS-1 and IRS-2 was reduced by paraquat pretreatment as shown in Fig. 5, A and B. This inhibitory effect of paraquat on PI 3-kinase activity bound to IRSs was abolished when cells were treated with α-lipoic acid (Fig. 5, C and D) indicating that paraquat-induced oxidative stress impaired PI 3-kinase activity without inhibiting tyrosine phosphorylation of IRS or association between IRSs and PI 3-kinase.
FIGURE 5.
Effect of paraquat on PI 3-kinase activity bound to IRS. A and B, 3T3-L1 adipocytes were serum-starved for 18 h, and cells were then treated with 0 or 10 mm PQ for 3 h followed by incubation with 10 nm insulin for 5 min at which time cells were solubilized. Whole cell lysates were immunoprecipitated with anti-IRS-1 or anti-IRS-2 antibody, and PI 3-kinase activity in these immunoprecipitates was measured. C and D, 3T3-L1 adipocytes were serum-starved for 18 h with or without 500 μm α-lipoic acid (LA), and cells were then treated with 0 or 10 mm paraquat for 3 h followed by incubation with 10 nm insulin for 5 min. Cells were then solubilized, and PI 3-kinase activity in immunoprecipitates of IRS-1 or IRS-2 was measured. The experiments were performed in triplicate, and the results shown are the means ± S.E. There are significant differences between values with different superscript characters (p < 0.05).
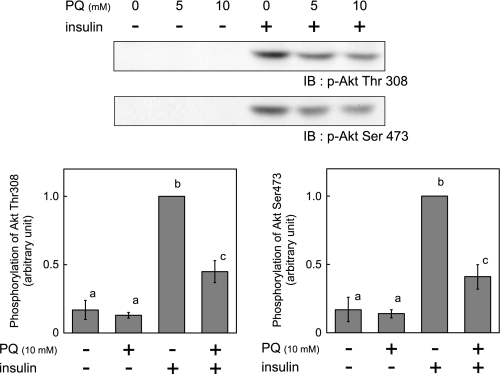
We next evaluated the effect of paraquat treatment on insulin-dependent Akt phosphorylation at Thr308 and Ser473. Insulin-dependent Akt phosphorylation was reduced by paraquat (Fig. 6), consistent with the reduction of PI 3-kinase activity, GLUT4 translocation to plasma membrane, and 2-DG uptake.
FIGURE 6.
Effect of paraquat on phosphorylation of Akt. 3T3-L1 adipocytes were serum-starved for 18 h, and cells were then treated with the indicated concentration of PQ for 3 h followed by incubation with 10 nm insulin for 5 min at which time cells were solubilized. Equal amounts of protein were resolved by SDS-PAGE, and immunoblotting (IB) was performed with anti-phospho-Akt Thr-308 or Ser-473 antibody. The values were expressed as the means ± S.E. of three independent experiments. There are significant differences between values with different superscript characters (p < 0.05).
Paraquat Does Not Inhibit Myr-Akt-induced Glucose Uptake and GLUT4 Translocation to Plasma Membrane
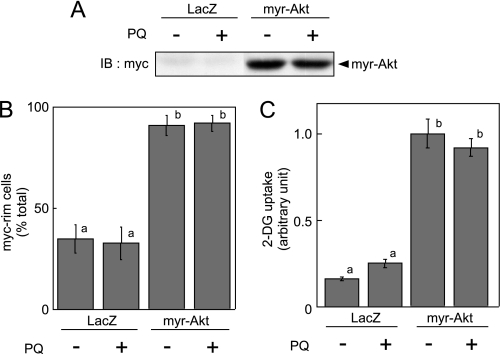
We infected 3T3-L1 adipocytes with recombinant adenoviruses encoding E. coli LacZ or the active form of Akt (myr-Akt). Two days after infection, cells were serum-starved, and GLUT4 translocation to plasma membrane and 2-DG uptake was then measured. We confirmed expression of myr-Akt (Fig. 7A), which remarkably increased both 2-DG uptake and GLUT4 translocation to plasma membrane, as reported previously (41); paraquat treatment affected neither myr-Akt-dependent GLUT4 translocation to the plasma membrane nor 2-DG uptake (Fig. 7, B and C). These data clearly show that paraquat-induced oxidative stress does indeed inhibit insulin signals upstream of Akt.
FIGURE 7.
Effect of paraquat on myr-Akt-dependent GLUT4 translocation to plasma membrane and 2-DG uptake. 3T3-L1 adipocytes were infected with recombinant adenovirus encoding Myc-tagged myr-Akt or LacZ. A, 2 days after infection, adipocytes were serum-starved for 18 h, and cells were then treated with 0 or 10 mm PQ for 3 h, and cells were solubilized. Equal amounts of protein were resolved by SDS-PAGE, and immunoblotting (IB) was performed with anti-Myc tag antibody. B, 2 days after infection, adipocytes were electroporated with expression vector containing exofacial Myc-tagged GLUT4-EGFP cDNA. Electroporated 3T3-L1 adipocytes were serum-starved for 18 h, and cells were then treated with 0 or 10 mm paraquat for 3 h. GLUT4 translocation to plasma membrane was assayed as described under “Experimental Procedures.” The graph represents the percentage of cells expressing Myc fluorescence on the cell surface. The results shown are the means ± S.E. of three independent experiments. C, 2 days after infection, adipocytes were serum-starved for 18 h, and cells were then treated with 0 or 10 mm paraquat for 3 h. Uptake of 2-DG was then measured. The experiment was performed in triplicate, and the results shown are the means ± S.E. There are significant differences between values with different superscript characters (p < 0.05).
Paraquat Inhibits Insulin-dependent Activation of PI 3-Kinase p110α and p110β
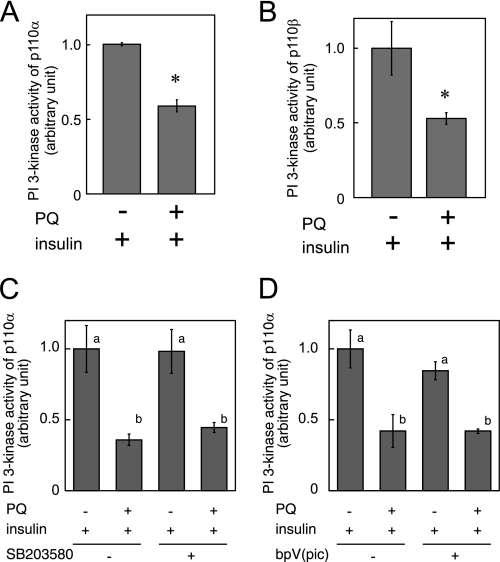
It has been previously reported that, in 3T3-L1 adipocytes, mainly two isoforms of class Ia PI 3-kinase catalytic subunit, p110α and p110β, are expressed (9, 10). We measured PI 3-kinase activity in p110α and p110β immunoprecipitates and found that PI 3-kinase activity of both p110α and p110β was inhibited by paraquat pretreatment (Fig. 8, A and B).
FIGURE 8.
Effect of paraquat on insulin-dependent activation of PI 3-kinase p110α and p110β. 3T3-L1 adipocytes were serum-starved for 18 h, and then cells were treated with 0 or 10 mm paraquat for 3 h followed by incubation with 10 nm insulin for 5 min at which time cells were solubilized. PI 3-kinase activity in immunoprecipitates by anti-p110α antibody (A and D) or anti-p110β antibody (B) was measured. C, 3T3-L1 adipocytes were serum-starved for 18 h, and then cells were treated with 0 or 10 mm paraquat in the presence or absence of 10 mm SB203580 for 3 h followed by incubation with 10 nm insulin for 5 min. PI 3-kinase activity in immunoprecipitates by anti-p110α antibody was measured. D, 200 nm dipotassium bisperoxo(picolinato)oxovanadate (V) (bpV(pic)) was added in the in vitro PI 3-kinase reaction mixture. The experiments were performed in triplicate, and the results shown are the mean ± S.E. * indicates the difference between cells with and without paraquat treatment is significant with p < 0.05 in A and B. There are significant differences between values with different superscript characters (p < 0.05) in C and D.
To identify the signaling pathway that inhibits PI 3-kinase activation in response to paraquat, we pretreated cells with paraquat followed by insulin treatment in the presence or absence of SB2035380, a specific inhibitor of p38 MAPK (Fig. 8C). Repression of insulin-dependent PI 3-kinase p110α activation by paraquat was not rescued by the inhibitor, indicating that p38 MAPK is not involved in paraquat-induced inhibition of PI 3-kinase. Next, to investigate whether the phosphatase and tensin homolog (PTEN) interacts with PI 3-kinase and dephosphorylates phosphatidylinositol phosphate produced by PI 3-kinase derived from paraquat-treated cells, we added bpV (pic), a specific inhibitor of PTEN, into the PI 3-kinase reaction (Fig. 8D). The result indicated that PTEN is not involved in paraquat-induced inhibition of PI 3-kinase.
Paraquat Decreases the Basal Activity of PI 3-Kinase p110, and This Inhibition Is Not Observed in the p110α Mutant at Cys90 in the p85 Binding Region
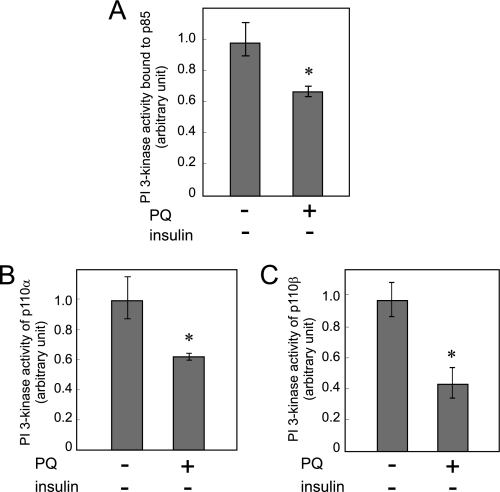
We then measured the activity of PI 3-kinase p110 treated with paraquat without insulin treatment. Surprisingly, the basal activity of PI 3-kinase bound to p85 regulatory subunit and p110α or p110β was decreased by paraquat treatment (Fig. 9, A–C). Because insulin stimulus induces association of PI 3-kinase with IRSs after its tyrosine phosphorylation (Fig. 4A), these results indicated that association of PI 3-kinase with IRSs is not necessary for paraquat-induced inhibition of PI 3-kinase.
FIGURE 9.
Effect of paraquat on the basal PI 3-kinase activity without insulin stimulation. A–C, 3T3-L1 adipocytes were serum-starved for 18 h and then treated with or without 10 mm PQ for 3 h at which time cells were solubilized. PI 3-kinase activity in the immunoprecipitates by anti-p85 antibody (A), anti-p110α antibody (B), or anti-p110β antibody (C) was measured. The experiments were performed in triplicate, and the results shown are the means ± S.E. * indicates the difference between cells with and without paraquat treatment is significant with p < 0.05.
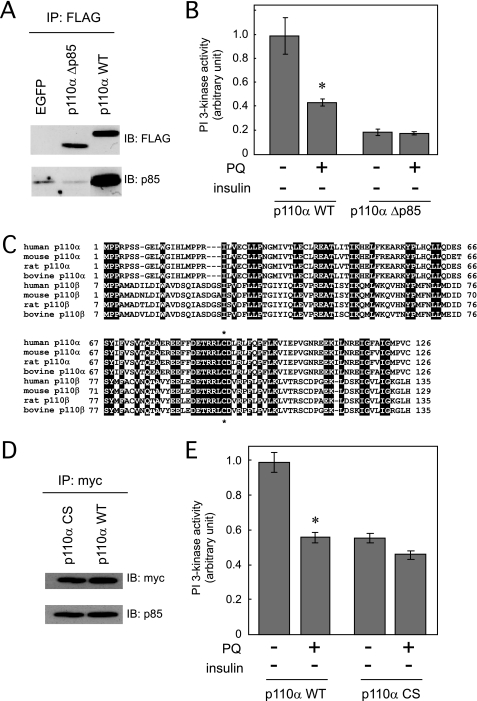
Next, we prepared the expression vector containing cDNA of the PI 3-kinase p110α mutant, which lacks the binding region for the PI 3-kinase p85 regulatory subunit (FLAG-p110α-Δp85). We confirmed that this PI 3-kinase p110α mutant did not bind to the PI 3-kinase p85 regulatory subunit (Fig. 10A). The basal activity of this PI 3-kinase p110α mutant was remarkably reduced, but when cells expressing this mutant were treated with paraquat, the mutant PI 3-kinase activity was not further depressed (Fig. 10B), suggesting that the PI 3-kinase p85 regulatory subunit or its binding region in the PI 3-kinase p110α is one possible primary target of paraquat.
FIGURE 10.
Effect of paraquat on the basal PI 3-kinase activity of p110α mutants without insulin stimulation. A, HEK293T cells were transfected with pEGFP, pFLAG-p110αWT, or pFLAG-p110αΔp85. Cell lysate was immunoprecipitated (IP) with anti-FLAG antibody, and immunoprecipitates were subjected to SDS-PAGE, and immunoblotting (IB) was performed with the indicated antibodies. B, 3T3-L1 adipocytes were electroporated with pFLAG-p110αWT or pFLAG-p110αΔp85. Cells were serum-starved for 18 h followed by treatment with or without 10 mm PQ for 3 h at which time cells were solubilized. PI 3-kinase activity in the immunoprecipitates by anti-FLAG antibody was measured. C, alignments of the amino acid sequences of the region of PI 3-kinase p110α and p110β that binds to p85 in various species. Common amino acid residues are black-boxed. Asterisk denotes the conserved Cys90 residues in p110α and p110β through various species. D, HEK293T cells were transfected with pCMV5–2×myc-p110αWT or pCMV5–2×myc-p110αC90S. Cell lysate was immunoprecipitated with anti-Myc antibody, and immunoprecipitates were subjected to SDS-PAGE, and immunoblotting was performed with the indicated antibodies. E, 3T3-L1 adipocytes were electroporated with pCMV5–2×myc-p110αWT or pCMV5–2×myc-p110αC90S. Cells were serum-starved for 18 h followed by treatment with or without 10 mm PQ for 3 h at which time cells were solubilized. PI 3-kinase activity in the immunoprecipitates by anti-Myc antibody was measured. The experiments in B and E were performed in triplicate, and the results shown are the mean ± S.E. * indicates the difference between cells with and without paraquat treatment is significant with p < 0.05.
Because oxidation of cysteine residues often occurs in the presence of ROS, we finally constructed the expression vector containing cDNA of the PI 3-kinase p110α mutant in which Cys90 is replaced by Ser. This is the one cysteine residue conserved in the binding region for the PI 3-kinase p85 regulatory subunit in p110α and p110β through various species (Fig. 10C). Although binding of the PI 3-kinase p85 regulatory subunit to the PI 3-kinase p110α mutant was observed the same as wild type p110α (Fig. 10D), PI 3-kinase activity of this mutant that was half that of the wild type p110α was not affected by paraquat treatment (Fig. 10E). The result indicated that Cys90 is a possible target of paraquat.
DISCUSSION
Type II diabetes is a common metabolic disorder characterized in part by insulin resistance in peripheral tissues. Many factors are known to cause insulin resistance, and one factor is oxidative stress. In tissues where insulin resistance has been observed, impairment of insulin signaling at various steps in the insulin signal transduction process has been reported, including decreases in insulin-stimulated IR and IRS tyrosine phosphorylation and PI 3-kinase activation. Subsequent studies have shown that PI 3-kinase and Akt, the downstream kinase, are key signal transducers for insulin-dependent translocation of GLUT4 to the plasma membrane followed by glucose uptake (42–46). As a result, reduction in signal flow via the IRS-PI 3-kinase pathway leads to impaired glucose uptake and utilization in insulin target tissues in insulin-resistant animal models and in humans (47–49).
Paraquat treatment did not significantly decrease the levels of IRS-1 and IRS-2 (Fig. 3, A and C). Phosphorylation of IRS-1 Ser307 is reported to cause inhibition of tyrosine phosphorylation of IRS-1 by insulin receptor tyrosine kinase (50). We observed that insulin treatment increased phosphorylation of IRS-1 Ser307, which explains a band shift in IRS-1 after insulin treatment (supplemental Fig. S1); however, paraquat treatment prevented this serine phosphorylation. In addition, insulin-dependent IRS-1 tyrosine phosphorylation did not significantly decrease in response to paraquat treatment in our study (Fig. 4, A and B). From these results, we conclude that serine phosphorylation of IRS-1 did not explain inhibition of insulin signaling by paraquat. When cells were treated with paraquat, IRS-2 also showed a smear pattern that may be a result of serine/threonine phosphorylation. However, insulin-dependent IRS-2 tyrosine phosphorylation was not affected by paraquat treatment (Fig. 4, A and B), confirming that these modifications did not cause inhibition of tyrosine phosphorylation of IRS-2.
In this study, PI 3-kinase activity bound to IRS was impaired by paraquat-induced oxidative stress, although the amount of PI 3-kinase bound to IRS was unchanged (Figs. 4 and 5). Insulin-dependent Akt phosphorylation, GLUT4 translocation to plasma membrane, and glucose uptake were also decreased (Figs. 2 and 6), a result that is consistent with decreased activity of PI 3-kinase (Figs. 5 and 8). Additionally, it has been reported that myr-Akt is targeted to the plasma membrane where it changes to a constitutively active form. It then stimulates GLUT4 translocation to the plasma membrane and glucose uptake even in the absence of insulin (41). We found that paraquat-induced oxidative stress decreased neither myr-Akt-dependent GLUT4 translocation to plasma membrane nor glucose uptake (Fig. 7). These data clearly indicate that inhibition of PI 3-kinase p110 activity, caused by paraquat-induced oxidative stress, results in impaired glucose uptake in 3T3-L1 adipocytes.
Results from a recent study using a specific inhibitor of p110α or p110β revealed that treatment with the inhibitor of p110α, but not p110β, impaired insulin action and that the p110β inhibitor did not increase the effect of p110α inhibitor on insulin bioactivity in 3T3-L1 adipocytes (12). Taken together with our data, we conclude that inhibition of p110α activity by paraquat-induced oxidative stress is likely to cause impaired glucose uptake in 3T3-L1 adipocytes.
A previous study showed that oxidative stress induced by H2O2 (generated by glucose oxidase in culture medium) decreased neither tyrosine phosphorylation of IR and IRS nor PI 3-kinase activity but did disrupt subcellular distribution of IRS and PI 3-kinase in 3T3-L1 adipocytes resulting in decreased downstream signals of PI 3-kinase and glucose uptake (15). A recent publication reported that exposure to different types of oxidative stress induced by either H2O2, paraquat, or hypoxia resulted in varying effects on cell viability and oxidative damage to protein (16). Another study reported that H2O2 caused a remarkable increase in oxidative damage to the cell membrane, whereas paraquat did not (17). We confirmed that unlike the glucose oxidase system, paraquat generates superoxide inside the cells (Fig. 1A). In addition, paraquat treatment reduced the basal activity of PI 3-kinase; however, when the semi-purified complex of PI 3-kinase p85 and p110 from HEK293T cells was treated with H2O2 in a cell-free system, we failed to observe inhibition of PI 3-kinase activity (supplemental Fig. S2). The varying effects of oxidative stress induced by H2O2 or paraquat on PI 3-kinase activity are probably due to varying levels or duration of ROS, properties of each ROS reactivity, and/or the location at which ROS is generated. Paraquat is one of the tools used to identify potential sites of oxidative damage among the complex chemical reactions that disrupt insulin signaling.
In this study, we demonstrated that not only the activity of PI 3-kinase in response to insulin stimulus but also the basal activity of PI 3-kinase without insulin treatment were reduced by paraquat treatment (Figs. 8 and 9). These results indicate that neither IRS-1 nor IRS-2 is a direct target of paraquat-induced oxidative stress, because without insulin treatment IRSs were associated with very low amounts of PI 3-kinase (Fig. 4A). In contrast, when the PI 3-kinase p110α mutant that does not bind to PI 3-kinase p85 was overexpressed followed by treatment with paraquat, we found that PI 3-kinase activity of this mutant was not reduced by paraquat treatment (Fig. 10B). These results indicate that the p85 PI 3-kinase regulatory subunit or the region of PI 3-kinase p110α that binds to p85 is a potential site of oxidative damage induced by paraquat.
How does paraquat-induced oxidative stress impair the basal activity of PI 3-kinase? One possibility is that there is a direct modification of cysteine thiols of p85 PI 3-kinase regulatory subunit or the region of PI 3-kinase p110α that binds to p85 by ROS that causes a decrease in PI 3-kinase activity. Accumulating evidence implies that excessive ROS generation causes oxidation of various signaling molecules, including protein kinases; for example, the activity of some protein kinases, such as protein kinase A, protein kinase Cϵ, ASK-1, c-Src, and platelet-derived growth factor receptor, is regulated by oxidation of their cysteine thiols (51–55). As stated under “Results,” in the region of PI 3-kinase p110α that binds to p85, only one cysteine residue (Cys90) is conserved in p110α and p110β across various species. The basal PI 3-kinase activity of the C90S mutant was reduced to half compared with wild type PI 3-kinase p110α, indicating that Cys90 is important for maintaining PI 3-kinase activity (Fig. 10E). However, we found that paraquat treatment did not affect the activity of the mutant. Taken together with the result showing that this mutant was associated with the PI 3-kinase p85 regulatory subunit the same as the wild type PI 3-kinase p110α (Fig. 10D), we concluded that Cys90 of PI 3-kinase p110 is one of the possible targets of paraquat. We could not rule out the possibility that mutation of Cys90 to Ser changes its molecular conformation, in a manner that prevents other intramolecular modifications of PI 3-kinase p110 in response to paraquat treatment. Identification of chemical modification in this cysteine thiol by paraquat is required for direct demonstration for our conclusions and is now in progress in our laboratory.
In summary, our results demonstrate that paraquat-induced oxidative stress represses the basal PI 3-kinase activity without affecting tyrosine phosphorylation of IR, IRS, or PI 3-kinase binding to IRS, and these effects lead to decreased glucose uptake in 3T3-L1 adipocytes.
Supplementary Material
Acknowledgments
We thank Dr. Jeffrey E. Pessin (Dept. of Pharmacological Sciences, State University of New York, Stony Brook) for donating exofacial Myc-tagged GLUT4-EGFP/pcDNA3 and for instruction in electroporation for the specific expression vector. We appreciate helpful discussions with Dr. Liria Masuda-Nakagawa. We also thank Dr. Takaaki Akaike (Faculty of Medical and Pharmaceutical Sciences, Kumamoto University) and Dr. Susan H. Hall (University of North Carolina, Chapel Hill) for their suggestions while this manuscript was in preparation.
This work was supported by Grant-in-aid for Scientific Research 16208028 from the Ministry of Education, Science, Culture and Sports, Japan (to S.-I. T.).

The on-line version of this article (available at http://www.jbc.org) contains supplemental Figs. S1 and S2.
- ROS
- reactive oxygen species
- GLUT4
- glucose transporter 4
- 2-DG
- 2-deoxyglucose
- IR
- insulin receptor
- IRS
- insulin receptor substrate
- PI
- phosphatidylinositol
- paraquat or PQ
- 1,1-dimethyl-4, 4-bipyrimidyl chloride
- DMEM
- Dulbecco's modified Eagle's medium
- FBS
- fetal bovine serum
- BSA
- bovine serum albumin
- WGA
- wheat germ agglutinin
- PBS
- phosphate-buffered saline
- PTEN
- phosphatase and tensin homolog.
REFERENCES
- 1.Ferroni P., Basili S., Paoletti V., Davì G. (2006) Nutr. Metab. Cardiovasc. Dis. 16, 222–233 [DOI] [PubMed] [Google Scholar]
- 2.Rösen P., Nawroth P. P., King G., Möller W., Tritschler H. J., Packer L. (2001) Diabetes Metab. Res. Rev. 17, 189–212 [DOI] [PubMed] [Google Scholar]
- 3.Jacob S., Henriksen E. J., Tritschler H. J., Augustin H. J., Dietze G. J. (1996) Exp. Clin. Endocrinol. Diabetes 104, 284–288 [DOI] [PubMed] [Google Scholar]
- 4.Paolisso G., Balbi V., Volpe C., Varricchio G., Gambardella A., Saccomanno F., Ammendola S., Varricchio M., D'Onofrio F. (1995) J. Am. Coll. Nutr. 14, 387–392 [DOI] [PubMed] [Google Scholar]
- 5.Paolisso G., D'Amore A., Giugliano D., Ceriello A., Varricchio M., D'Onofrio F. (1993) Am. J. Clin. Nutr. 57, 650–656 [DOI] [PubMed] [Google Scholar]
- 6.White M. F. (1997) Diabetologia 40, S2–S17 [DOI] [PubMed] [Google Scholar]
- 7.Anderson K. E., Jackson S. P. (2003) Int. J. Biochem. Cell Biol. 35, 1028–1033 [DOI] [PubMed] [Google Scholar]
- 8.Backer J. M., Myers M. G., Jr., Shoelson S. E., Chin D. J., Sun X. J., Miralpeix M., Hu P., Margolis B., Skolnik E. Y., Schlessinger J., et al. (1992) EMBO J. 11, 3469–3479 [DOI] [PMC free article] [PubMed] [Google Scholar]
- 9.Asano T., Kanda A., Katagiri H., Nawano M., Ogihara T., Inukai K., Anai M., Fukushima Y., Yazaki Y., Kikuchi M., Hooshmand-Rad R., Heldin C. H., Oka Y., Funaki M. (2000) J. Biol. Chem. 275, 17671–17676 [DOI] [PubMed] [Google Scholar]
- 10.Wang Q., Bilan P. J., Tsakiridis T., Hinek A., Klip A. (1998) Biochem. J. 331, 917–928 [DOI] [PMC free article] [PubMed] [Google Scholar]
- 11.Foukas L. C., Claret M., Pearce W., Okkenhaug K., Meek S., Peskett E., Sancho S., Smith A. J., Withers D. J., Vanhaesebroeck B. (2006) Nature 441, 366–370 [DOI] [PubMed] [Google Scholar]
- 12.Knight Z. A., Gonzalez B., Feldman M. E., Zunder E. R., Goldenberg D. D., Williams O., Loewith R., Stokoe D., Balla A., Toth B., Balla T., Weiss W. A., Williams R. L., Shokat K. M. (2006) Cell 125, 733–747 [DOI] [PMC free article] [PubMed] [Google Scholar]
- 13.Woodgett J. R. (2005) Curr. Opin. Cell Biol. 17, 150–157 [DOI] [PubMed] [Google Scholar]
- 14.Chang L., Chiang S. H., Saltiel A. R. (2004) Mol. Med. 10, 65–71 [DOI] [PMC free article] [PubMed] [Google Scholar]
- 15.Tirosh A., Potashnik R., Bashan N., Rudich A. (1999) J. Biol. Chem. 274, 10595–10602 [DOI] [PubMed] [Google Scholar]
- 16.Lu L., Hackett S. F., Mincey A., Lai H., Campochiaro P. A. (2006) J. Cell. Physiol. 206, 119–125 [DOI] [PubMed] [Google Scholar]
- 17.Kimura K., Tawara S., Igarashi K., Takenaka A. (2007) Biosci. Biotechnol. Biochem. 71, 16–22 [DOI] [PubMed] [Google Scholar]
- 18.Haley T. J. (1979) Clin. Toxicol. 14, 1–46 [DOI] [PubMed] [Google Scholar]
- 19.Dragin N., Smani M., Arnaud-Dabernat S., Dubost C., Moranvillier I., Costet P., Daniel J. Y., Peuchant E. (2006) FEBS Lett. 580, 3845–3852 [DOI] [PubMed] [Google Scholar]
- 20.Krall J., Bagley A. C., Mullenbach G. T., Hallewell R. A., Lynch R. E. (1988) J. Biol. Chem. 263, 1910–1914 [PubMed] [Google Scholar]
- 21.Shimada H., Hirai K., Simamura E., Pan J. (1998) Arch. Biochem. Biophys. 351, 75–81 [DOI] [PubMed] [Google Scholar]
- 22.Migliaccio E., Giorgio M., Mele S., Pelicci G., Reboldi P., Pandolfi P. P., Lanfrancone L., Pelicci P. G. (1999) Nature 402, 309–313 [DOI] [PubMed] [Google Scholar]
- 23.Holzenberger M. (2004) Horm. Res. 62, S89–S92 [DOI] [PubMed] [Google Scholar]
- 24.Wu Z., Rogers B., Kachi S., Hackett S. F., Sick A., Campochiaro P. A. (2006) J. Cell. Physiol. 209, 996–1005 [DOI] [PubMed] [Google Scholar]
- 25.Peng J., Stevenson F. F., Doctrow S. R., Andersen J. K. (2005) J. Biol. Chem. 280, 29194–29198 [DOI] [PubMed] [Google Scholar]
- 26.Alcendor R. R., Gao S., Zhai P., Zablocki D., Holle E., Yu X., Tian B., Wagner T., Vatner S. F., Sadoshima J. (2007) Circ. Res. 100, 1512–1521 [DOI] [PubMed] [Google Scholar]
- 27.Ogihara T., Shin B. C., Anai M., Katagiri H., Inukai K., Funaki M., Fukushima Y., Ishihara H., Takata K., Kikuchi M., Yazaki Y., Oka Y., Asano T. (1997) J. Biol. Chem. 272, 12868–12873 [DOI] [PubMed] [Google Scholar]
- 28.Kao A. W., Ceresa B. P., Santeler S. R., Pessin J. E. (1998) J. Biol. Chem. 273, 25450–25457 [DOI] [PubMed] [Google Scholar]
- 29.Inukai K., Anai M., Van Breda E., Hosaka T., Katagiri H., Funaki M., Fukushima Y., Ogihara T., Yazaki Y., Kikuchi, Oka Y., Asano T. (1996) J. Biol. Chem. 271, 5317–5320 [DOI] [PubMed] [Google Scholar]
- 30.Shin B. C., Suzuki M., Inukai K., Anai M., Asano T., Takata K. (1998) Biochem. Biophys. Res. Commun. 246, 313–319 [DOI] [PubMed] [Google Scholar]
- 31.Hakuno F., Kurihara S., Watson R. T., Pessin J. E., Takahashi S. (2007) J. Biol. Chem. 282, 37747–37758 [DOI] [PubMed] [Google Scholar]
- 32.Kabuta T., Hakuno F., Asano T., Takahashi S. (2002) J. Biol. Chem. 277, 6846–6851 [DOI] [PubMed] [Google Scholar]
- 33.Chen C. S., Gee K. R. (2000) Free Radic. Biol. Med. 28, 1266–1278 [DOI] [PubMed] [Google Scholar]
- 34.Katagiri H., Asano T., Ishihara H., Inukai K., Shibasaki Y., Kikuchi M., Yazaki Y., Oka Y. (1996) J. Biol. Chem. 271, 16987–16990 [DOI] [PubMed] [Google Scholar]
- 35.Shigematsu S., Khan A. H., Kanzaki M., Pessin J. E. (2002) Mol. Endocrinol. 16, 1060–1068 [DOI] [PubMed] [Google Scholar]
- 36.Mitra P., Zheng X., Czech M. P. (2004) J. Biol. Chem. 279, 37431–37435 [DOI] [PubMed] [Google Scholar]
- 37.Cho Y., Ariga M., Uchijima Y., Kimura K., Rho J. Y., Furuhata Y., Hakuno F., Yamanouchi K., Nishihara M., Takahashi S. (2006) Endocrinology 147, 5374–5384 [DOI] [PubMed] [Google Scholar]
- 38.Nedachi T., Akahori M., Ariga M., Sakamoto H., Suzuki N., Umesaki K., Hakuno F., Takahashi S. I. (2000) Endocrinology 141, 2429–2438 [DOI] [PubMed] [Google Scholar]
- 39.Packer L., Tritschler H. J., Wessel K. (1997) Free Radic. Biol. Med. 22, 359–378 [DOI] [PubMed] [Google Scholar]
- 40.Evans J. L., Goldfine I. D., Maddux B. A., Grodsky G. M. (2002) Endocr. Rev. 23, 599–622 [DOI] [PubMed] [Google Scholar]
- 41.Kohn A. D., Summers S. A., Birnbaum M. J., Roth R. A. (1996) J. Biol. Chem. 271, 31372–31378 [DOI] [PubMed] [Google Scholar]
- 42.Okada T., Kawano Y., Sakakibara T., Hazeki O., Ui M. (1994) J. Biol. Chem. 269, 3568–3573 [PubMed] [Google Scholar]
- 43.Kanai F., Ito K., Todaka M., Hayashi H., Kamohara S., Ishii K., Okada T., Hazeki O., Ui M., Ebina Y. (1993) Biochem. Biophys. Res. Commun. 195, 762–768 [DOI] [PubMed] [Google Scholar]
- 44.Clarke J. F., Young P. W., Yonezawa K., Kasuga M., Holman G. D. (1994) Biochem. J. 300, 631–635 [DOI] [PMC free article] [PubMed] [Google Scholar]
- 45.Cheatham B., Vlahos C. J., Cheatham L., Wang L., Blenis J., Kahn C. R. (1994) Mol. Cell. Biol. 14, 4902–4911 [DOI] [PMC free article] [PubMed] [Google Scholar]
- 46.Hara K., Yonezawa K., Sakaue H., Ando A., Kotani K., Kitamura T., Kitamura Y., Ueda H., Stephens L., Jackson T. R., et al. (1994) Proc. Natl. Acad. Sci. U.S.A. 91, 7415–7419 [DOI] [PMC free article] [PubMed] [Google Scholar]
- 47.Kahn B. B., Flier J. S. (2000) J. Clin. Invest. 106, 473–481 [DOI] [PMC free article] [PubMed] [Google Scholar]
- 48.Pessin J. E., Saltiel A. R. (2000) J. Clin. Invest. 106, 165–169 [DOI] [PMC free article] [PubMed] [Google Scholar]
- 49.Le Roith D., Zick Y. (2001) Diabetes Care 24, 588–597 [DOI] [PubMed] [Google Scholar]
- 50.Aguirre V., Werner E. D., Giraud J., Lee Y. H., Shoelson S. E., White M. F. (2002) J. Biol. Chem. 277, 1531–1537 [DOI] [PubMed] [Google Scholar]
- 51.Humphries K. M., Deal M. S., Taylor S. S. (2005) J. Biol. Chem. 280, 2750–2758 [DOI] [PubMed] [Google Scholar]
- 52.Park H. S., Yu J. W., Cho J. H., Kim M. S., Huh S. H., Ryoo K., Choi E. J. (2004) J. Biol. Chem. 279, 7584–7590 [DOI] [PubMed] [Google Scholar]
- 53.Giannoni E., Buricchi F., Raugei G., Ramponi G., Chiarugi P. (2005) Mol. Cell. Biol. 25, 6391–6403 [DOI] [PMC free article] [PubMed] [Google Scholar]
- 54.Lee J. W., Kim J. E., Park E. J., Kim J. H., Lee C. H., Lee S. R., Kwon J. (2004) Biochem. J. 382, 631–639 [DOI] [PMC free article] [PubMed] [Google Scholar]
- 55.Chu F., Koomen J. M., Kobayashi R., O'Brian C. A. (2005) Cancer Res. 65, 10478–10485 [DOI] [PubMed] [Google Scholar]
Associated Data
This section collects any data citations, data availability statements, or supplementary materials included in this article.


